San Juan Airbnb Market Analysis 2026: Short Term Rental Data & Vacation Rental Statistics in Metro Manila, Philippines
Is Airbnb profitable in San Juan in 2026? Explore comprehensive Airbnb analytics for San Juan, Metro Manila, Philippines to uncover income potential. This 2026 STR market report for San Juan, based on AirROI data from February 2025 to January 2026, reveals key trends in the niche market of 78 active listings.
Whether you're considering an Airbnb investment in San Juan, optimizing your existing vacation rental, or exploring rental arbitrage opportunities, understanding the San Juan Airbnb data is crucial. Leveraging the low regulation environment is key to maximizing your short term rental income potential. Let's dive into the specifics.
Key San Juan Airbnb Performance Metrics Overview
Monthly Airbnb Revenue Variations & Income Potential in San Juan (2026)
Understanding the monthly revenue variations for Airbnb listings in San Juan is key to maximizing your short term rental income potential. Seasonality significantly impacts earnings. Our analysis, based on data from the past 12 months, shows that the peak revenue month for STRs in San Juan is typically December, while April often presents the lowest earnings, highlighting opportunities for strategic pricing adjustments during shoulder and low seasons. Explore the typical Airbnb income in San Juan across different performance tiers:
- Best-in-class properties (Top 10%) achieve $1,027+ monthly, often utilizing dynamic pricing and superior guest experiences.
- Strong performing properties (Top 25%) earn $626 or more, indicating effective management and desirable locations/amenities.
- Typical properties (Median) generate around $305 per month, representing the average market performance.
- Entry-level properties (Bottom 25%) see earnings around $137, often with potential for optimization.
Average Monthly Airbnb Earnings Trend in San Juan
San Juan Airbnb Occupancy Rate Trends (2026)
Maximize your bookings by understanding the San Juan STR occupancy trends. Seasonal demand shifts significantly influence how often properties are booked. Typically, Novembersees the highest demand (peak season occupancy), while June experiences the lowest (low season). Effective strategies, like adjusting minimum stays or offering promotions, can boost occupancy during slower periods. Here's how different property tiers perform in San Juan:
- Best-in-class properties (Top 10%) achieve 71%+ occupancy, indicating high desirability and potentially optimized availability.
- Strong performing properties (Top 25%) maintain 46% or higher occupancy, suggesting good market fit and guest satisfaction.
- Typical properties (Median) have an occupancy rate around 24%.
- Entry-level properties (Bottom 25%) average 11% occupancy, potentially facing higher vacancy.
Average Monthly Occupancy Rate Trend in San Juan
Average Daily Rate (ADR) Airbnb Trends in San Juan (2026)
Effective short term rental pricing strategy in San Juan involves understanding monthly ADR fluctuations. The Average Daily Rate (ADR) for Airbnb in San Juan typically peaks in June and dips lowest during April. Leveraging Airbnb dynamic pricing tools or strategies based on this seasonality can significantly boost revenue. Here's a look at the typical nightly rates achieved:
- Best-in-class properties (Top 10%) command rates of $86+ per night, often due to premium features or locations.
- Strong performing properties (Top 25%) achieve nightly rates of $50 or more.
- Typical properties (Median) charge around $36 per night.
- Entry-level properties (Bottom 25%) earn around $28 per night.
Average Daily Rate (ADR) Trend by Month in San Juan
Get Live San Juan Market Intelligence 👇

Explore Real-time Analytics
Airbnb Seasonality Analysis & Trends in San Juan (2026)
Peak Season (December, November, January)
- Revenue averages $559 per month
- Occupancy rates average 32.5%
- Daily rates average $46
Shoulder Season
- Revenue averages $470 per month
- Occupancy maintains around 32.0%
- Daily rates hold near $46
Low Season (April, August, October)
- Revenue drops to average $420 per month
- Occupancy decreases to average 30.9%
- Daily rates adjust to average $46
Seasonality Insights for San Juan
- The Airbnb seasonality in San Juan shows moderate seasonality with distinct peak and low periods. While the sections above show seasonal averages, it's also insightful to look at the extremes:
- During the high season, the absolute peak month showcases San Juan's highest earning potential, with monthly revenues capable of climbing to $598, occupancy reaching a high of 34.8%, and ADRs peaking at $47.
- Conversely, the slowest single month of the year, typically falling within the low season, marks the market's lowest point. In this month, revenue might dip to $413, occupancy could drop to 27.5%, and ADRs may adjust down to $45.
- Understanding both the seasonal averages and these monthly peaks and troughs in revenue, occupancy, and ADR is crucial for maximizing your Airbnb profit potential in San Juan.
Seasonal Strategies for Maximizing Profit
- Peak Season: Maximize revenue through premium pricing and potentially longer minimum stays. Ensure high availability.
- Low Season: Offer competitive pricing, special promotions (e.g., extended stay discounts), and flexible cancellation policies. Target off-season travelers like remote workers or budget-conscious guests.
- Shoulder Seasons: Implement dynamic pricing that balances peak and low rates. Target weekend travelers or specific events. Offer slightly more flexible terms than peak season.
- Regularly analyze your own performance against these San Juan seasonality benchmarks and adjust your pricing and availability strategy accordingly.
Best Areas for Airbnb Investment in San Juan (2026)
Exploring the top neighborhoods for short-term rentals in San Juan? This section highlights key areas, outlining why they are attractive for hosts and guests, along with notable local attractions. Consider these locations based on your target guest profile and investment strategy.
| Neighborhood / Area | Why Host Here? (Target Guests & Appeal) | Key Attractions & Landmarks |
|---|---|---|
| Bonifacio Global City (BGC) | A modern business district known for its upscale lifestyle, shopping, and dining. It's popular with both local and foreign tourists, offering a vibrant urban environment. | The Mind Museum, Fort Bonifacio High Street, Venice Grand Canal Mall, SM Aura Premier, Bonifacio High Street Park |
| Makati | The financial hub of the Philippines, Makati offers a mix of business and leisure with numerous shopping malls, restaurants, and entertainment options. Attracts business travelers and tourists alike. | Greenbelt Mall, Ayala Museum, Makati Avenue nightlife, Greenhills Shopping Center, Ayala Triangle Gardens |
| Malate | A lively area popular for its nightlife, restaurants, and proximity to Manila Bay. It's a diverse area that attracts both locals and tourists looking for an energetic atmosphere. | Roxas Boulevard, Malate Church, Cultural Center of the Philippines, Remedios Circle, Manila Zoo |
| Intramuros | The historic district of Manila, known for its Spanish colonial architecture and rich history. A great location for tourists interested in culture and heritage. | Fort Santiago, San Agustin Church, Intramuros Golf Course, Casa Manila, Manila Cathedral |
| Ermita | Close to many tourist attractions and known for its vibrant nightlife, Ermita is popular with younger crowds and tourists looking for entertainment and accessibility. | Robinsons Place Manila, Dahilayan Adventure Park, Malate Beach, Café Adriatico, Museum of the Filipino People |
| Quezon City | The largest city in Metro Manila, known for its shopping malls, parks, and cultural attractions. It's a good option for families and budget travelers. | Quezon Memorial Circle, SM North EDSA, Ateneo Art Gallery, Ninoy Aquino Parks and Wildlife, La Mesa Eco Park |
| Pasay | Strategically located near the airport and attractions like the Mall of Asia, Pasay is a prime location for travelers and business visitors. | SM Mall of Asia, Coconut Palace, Star City, Diosdado Macapagal Avenue, City of Dreams Manila |
| San Juan | A residential city with a rich cultural scene and local eateries, San Juan offers a more local experience while still being close to the major attractions and business districts. | Greenhills Shopping Center, San Juan City Hall, Pinaglabanan Shrine, San Juan National High School, La Salle Green Hills |
Understanding Airbnb License Requirements & STR Laws in San Juan (2026)
While San Juan, Metro Manila, Philippines currently shows low STR regulations, specific Airbnb license requirements might still exist or change. Always verify the latest short term rental regulations and Airbnb license requirements directly with local government authorities for San Juan to ensure full compliance before hosting.
(Source: AirROI data, 2026, finding no licensed listings among those analyzed)
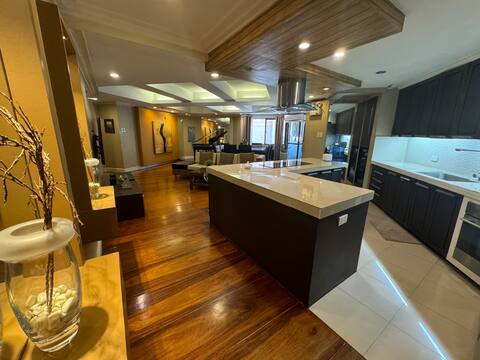
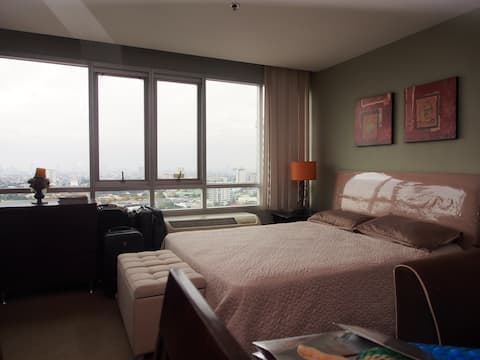
Top Performing Airbnb Properties in San Juan (2026)
Benchmark your potential! Explore examples of top-performing Airbnb properties in San Juanbased on Trailing Twelve Month (TTM) revenue. Analyze their characteristics, revenue, occupancy rate, and ADR to understand what drives success in this market.
My suite at Greenhills
Entire Place • 3 bedrooms

3BR @ Greenhills Shopping Centre
Entire Place • 3 bedrooms

Luxe Loft: 4- Bedroom Condo w/ WIFI and Karaoke
Entire Place • 4 bedrooms

My SuiteHeart of San Juan City close to Greenhills
Entire Place • 3 bedrooms

3 BR/3 BA/5 Air Cons in a 2 level GREENHILLS Loft
Entire Place • 3 bedrooms
23rd Flr. Studio across Greenhills Shopping Centre
Entire Place • N/A
Note: Performance varies based on location, size, amenities, seasonality, and management quality. Data reflects the past 12 months.
Top Performing Airbnb Hosts in San Juan (2026)
Learn from the best! This table showcases top-performing Airbnb hosts in San Juan based on the number of properties managed and estimated total revenue over the past year. Analyze their scale and performance metrics.
| Host Name | Properties | Grossing Revenue | Stay Reviews | Avg Rating |
|---|---|---|---|---|
| 188 Prime Residences | 12 | $32,199 | 956 | 4.89/5.0 |
| Avenilo | 1 | $25,730 | 199 | 4.58/5.0 |
| Ria Janella | 1 | $21,556 | 16 | 5.00/5.0 |
| Lawrence | 1 | $18,489 | 80 | 4.93/5.0 |
| Maria | 1 | $13,347 | 5 | 5.00/5.0 |
| Harry | 8 | $13,092 | 163 | 4.95/5.0 |
| Rico | 1 | $11,406 | 9 | 5.00/5.0 |
| Jireh | 2 | $11,146 | 66 | 4.78/5.0 |
| Ida | 1 | $9,569 | 108 | 4.81/5.0 |
| Mar | 2 | $8,815 | 437 | 4.92/5.0 |
Analyzing the strategies of top hosts, such as their property selection, pricing, and guest communication, can offer valuable lessons for optimizing your own Airbnb operations in San Juan.
Dive Deeper: Advanced San Juan STR Market Data (2026)
Ready to unlock more insights? AirROI provides access to advanced metrics and comprehensive Airbnb data for San Juan. Explore detailed analytics beyond this report to refine your investment strategy, optimize pricing, and maximize your vacation rental profits.
Explore Advanced MetricsSan Juan Short-Term Rental Market Composition (2026): Property & Room Types
Room Type Distribution
Property Type Distribution
Market Composition Insights for San Juan
- The San Juan Airbnb market composition is heavily skewed towards Entire Home/Apt listings, which make up 74.4% of the 78 active rentals. This indicates strong guest preference for privacy and space.
- Looking at the property type distribution in San Juan, Apartment/Condo properties are the most common (79.5%), reflecting the local real estate landscape.
- Houses represent a significant 19.2% portion, catering likely to families or larger groups.
- Smaller segments like hotel/boutique (combined 1.3%) offer potential for unique stay experiences.
San Juan Airbnb Room Capacity Analysis (2026): Bedroom Distribution
Distribution of Listings by Number of Bedrooms
Room Capacity Insights for San Juan
- The dominant room capacity in San Juan is 2 bedrooms listings, making up 35.9% of the market. This suggests a strong demand for properties suitable for couples or solo travelers.
- Together, 2 bedrooms and 1 bedroom properties represent 59.0% of the active Airbnb listings in San Juan, indicating a high concentration in these sizes.
San Juan Vacation Rental Guest Capacity Trends (2026)
Distribution of Listings by Guest Capacity
Guest Capacity Insights for San Juan
- The most common guest capacity trend in San Juan vacation rentals is listings accommodating 4 guests (21.8%). This suggests the primary traveler segment is likely small families or groups.
- Properties designed for 4 guests and 8+ guests dominate the San Juan STR market, accounting for 39.7% of listings.
- 26.9% of properties accommodate 6+ guests, serving the market segment for larger families or group travel in San Juan.
- On average, properties in San Juan are equipped to host 3.7 guests.
San Juan Airbnb Booking Patterns (2026): Available vs. Booked Days
Available Days Distribution
Booked Days Distribution
Booking Pattern Insights for San Juan
- The most common availability pattern in San Juan falls within the 271-366 days range, representing 62.8% of listings. This suggests many properties have significant open periods on their calendars.
- Approximately 93.6% of listings show high availability (181+ days open annually), indicating potential for increased bookings or specific owner usage patterns.
- For booked days, the 31-90 days range is most frequent in San Juan (32.1%), reflecting common guest stay durations or potential owner blocking patterns.
- A notable 6.4% of properties secure long booking periods (181+ days booked per year), highlighting successful long-term rental strategies or significant owner usage.
San Juan Airbnb Minimum Stay Requirements Analysis
Distribution of Listings by Minimum Night Requirement
1 Night
46 listings
59% of total
2 Nights
4 listings
5.1% of total
3 Nights
6 listings
7.7% of total
4-6 Nights
5 listings
6.4% of total
7-29 Nights
5 listings
6.4% of total
30+ Nights
12 listings
15.4% of total
Key Insights
- The most prevalent minimum stay requirement in San Juan is 1 Night, adopted by 59% of listings. This highlights the market's preference for shorter, flexible bookings.
- A strong majority (64.1%) of the San Juan Airbnb data shows acceptance of very short stays (1-2 nights), indicating a dynamic, high-turnover market.
- A significant segment (15.4%) caters to monthly stays (30+ nights) in San Juan, pointing to opportunities in the extended-stay market.
Recommendations
- Align with the market by considering a 1 Night minimum stay, as 59% of San Juan hosts use this setting.
- Explore offering discounts for stays of 30+ nights to attract the 15.4% of the market seeking extended stays.
- Adjust minimum nights based on seasonality – potentially shorter during low season and longer during peak demand periods in San Juan.
San Juan Airbnb Cancellation Policy Trends Analysis (2026)
Limited
2 listings
2.6% of total
Flexible
17 listings
21.8% of total
Moderate
32 listings
41% of total
Firm
21 listings
26.9% of total
Strict
6 listings
7.7% of total
Cancellation Policy Insights for San Juan
- The prevailing Airbnb cancellation policy trend in San Juan is Moderate, used by 41% of listings.
- There's a relatively balanced mix between guest-friendly (62.8%) and stricter (34.6%) policies, offering choices for different guest needs.
- Strict cancellation policies are quite rare (7.7%), potentially making listings with this policy less competitive unless justified by high demand or property type.
Recommendations for Hosts
- Consider adopting a Moderate policy to align with the 41% market standard in San Juan.
- Using a Strict policy might deter some guests, as only 7.7% of listings use it. Evaluate if potential revenue protection outweighs possible lower booking rates.
- Regularly review your cancellation policy against competitors and market demand shifts in San Juan.
San Juan STR Booking Lead Time Analysis (2026)
Average Booking Lead Time by Month
Booking Lead Time Insights for San Juan
- The overall average booking lead time for vacation rentals in San Juan is 17 days.
- Guests book furthest in advance for stays during January (average 22 days), likely coinciding with peak travel demand or local events.
- The shortest booking windows occur for stays in November (average 14 days), indicating more last-minute travel plans during this time.
- Seasonally, Winter (20 days avg.) sees the longest lead times, while Fall (15 days avg.) has the shortest, reflecting typical travel planning cycles.
Recommendations for Hosts
- Use the overall average lead time (17 days) as a baseline for your pricing and availability strategy in San Juan.
- Target marketing efforts for the Winter season well in advance (at least 20 days) to capture early planners.
- Monitor your own booking lead times against these San Juan averages to identify opportunities for dynamic pricing adjustments.
Popular & Essential Airbnb Amenities in San Juan (2026)
Amenity Prevalence
Amenity Insights for San Juan
- Essential amenities in San Juan that guests expect include: Air conditioning, TV, Wifi. Lacking these (any) could significantly impact bookings.
- Popular amenities like Microwave, Dishes and silverware, Hot water are common but not universal. Offering these can provide a competitive edge.
Recommendations for Hosts
- Ensure your listing includes all essential amenities for San Juan: Air conditioning, TV, Wifi.
- Prioritize adding missing essentials: Wifi.
- Consider adding popular differentiators like Microwave or Dishes and silverware to increase appeal.
- Highlight unique or less common amenities you offer (e.g., hot tub, dedicated workspace, EV charger) in your listing description and photos.
- Regularly check competitor amenities in San Juan to stay competitive.
San Juan Airbnb Guest Demographics & Profile Analysis (2026)
Guest Profile Summary for San Juan
- The typical guest profile for Airbnb in San Juan consists of primarily domestic travelers (69%), often arriving from nearby Manila, typically belonging to the Post-2000s (Gen Z/Alpha) group (50%), primarily speaking English or Filipino.
- Domestic travelers account for 69.4% of guests.
- Key international markets include Philippines (69.4%) and United States (14%).
- Top languages spoken are English (49.5%) followed by Filipino (22%).
- A significant demographic segment is the Post-2000s (Gen Z/Alpha) group, representing 50% of guests.
Recommendations for Hosts
- Target domestic marketing efforts towards travelers from Manila and Quezon City.
- Tailor amenities and listing descriptions to appeal to the dominant Post-2000s (Gen Z/Alpha) demographic (e.g., highlight fast WiFi, smart home features, local guides).
- Highlight unique local experiences or amenities relevant to the primary guest profile.
- Consider seasonal promotions aligned with peak travel times for key origin markets.
Nearby Short-Term Rental Market Comparison
How does the San Juan Airbnb market stack up against its neighbors? Compare key performance metrics like average monthly revenue, ADR, and occupancy rates in surrounding areas to understand the broader regional STR landscape.
| Market | Active Properties | Monthly Revenue | Daily Rate | Avg. Occupancy |
|---|---|---|---|---|
| Bustos | 10 | $1,728 | $216.86 | 28% |
| Cabangan | 44 | $1,529 | $200.94 | 26% |
| Lian | 121 | $1,491 | $216.20 | 24% |
| Jalajala | 19 | $1,489 | $234.86 | 21% |
| Laoag | 17 | $1,412 | $158.39 | 33% |
| Beneg | 13 | $1,304 | $267.34 | 22% |
| Arew | 11 | $1,288 | $193.81 | 22% |
| Cabuyao | 25 | $1,202 | $114.93 | 36% |
| Binangonan | 49 | $1,191 | $135.12 | 29% |
| Porac | 51 | $1,157 | $203.91 | 21% |