Valenzuela Airbnb Market Analysis 2026: Short Term Rental Data & Vacation Rental Statistics in Metro Manila, Philippines
Is Airbnb profitable in Valenzuela in 2026? Explore comprehensive Airbnb analytics for Valenzuela, Metro Manila, Philippines to uncover income potential. This 2026 STR market report for Valenzuela, based on AirROI data from February 2025 to January 2026, reveals key trends in the niche market of 68 active listings.
Whether you're considering an Airbnb investment in Valenzuela, optimizing your existing vacation rental, or exploring rental arbitrage opportunities, understanding the Valenzuela Airbnb data is crucial. Leveraging the low regulation environment is key to maximizing your short term rental income potential. Let's dive into the specifics.
Key Valenzuela Airbnb Performance Metrics Overview
Monthly Airbnb Revenue Variations & Income Potential in Valenzuela (2026)
Understanding the monthly revenue variations for Airbnb listings in Valenzuela is key to maximizing your short term rental income potential. Seasonality significantly impacts earnings. Our analysis, based on data from the past 12 months, shows that the peak revenue month for STRs in Valenzuela is typically December, while July often presents the lowest earnings, highlighting opportunities for strategic pricing adjustments during shoulder and low seasons. Explore the typical Airbnb income in Valenzuela across different performance tiers:
- Best-in-class properties (Top 10%) achieve $808+ monthly, often utilizing dynamic pricing and superior guest experiences.
- Strong performing properties (Top 25%) earn $513 or more, indicating effective management and desirable locations/amenities.
- Typical properties (Median) generate around $291 per month, representing the average market performance.
- Entry-level properties (Bottom 25%) see earnings around $143, often with potential for optimization.
Average Monthly Airbnb Earnings Trend in Valenzuela
Valenzuela Airbnb Occupancy Rate Trends (2026)
Maximize your bookings by understanding the Valenzuela STR occupancy trends. Seasonal demand shifts significantly influence how often properties are booked. Typically, Decembersees the highest demand (peak season occupancy), while July experiences the lowest (low season). Effective strategies, like adjusting minimum stays or offering promotions, can boost occupancy during slower periods. Here's how different property tiers perform in Valenzuela:
- Best-in-class properties (Top 10%) achieve 62%+ occupancy, indicating high desirability and potentially optimized availability.
- Strong performing properties (Top 25%) maintain 43% or higher occupancy, suggesting good market fit and guest satisfaction.
- Typical properties (Median) have an occupancy rate around 26%.
- Entry-level properties (Bottom 25%) average 12% occupancy, potentially facing higher vacancy.
Average Monthly Occupancy Rate Trend in Valenzuela
Average Daily Rate (ADR) Airbnb Trends in Valenzuela (2026)
Effective short term rental pricing strategy in Valenzuela involves understanding monthly ADR fluctuations. The Average Daily Rate (ADR) for Airbnb in Valenzuela typically peaks in October and dips lowest during March. Leveraging Airbnb dynamic pricing tools or strategies based on this seasonality can significantly boost revenue. Here's a look at the typical nightly rates achieved:
- Best-in-class properties (Top 10%) command rates of $62+ per night, often due to premium features or locations.
- Strong performing properties (Top 25%) achieve nightly rates of $46 or more.
- Typical properties (Median) charge around $33 per night.
- Entry-level properties (Bottom 25%) earn around $27 per night.
Average Daily Rate (ADR) Trend by Month in Valenzuela
Get Live Valenzuela Market Intelligence 👇

Explore Real-time Analytics
Airbnb Seasonality Analysis & Trends in Valenzuela (2026)
Peak Season (December, April, May)
- Revenue averages $500 per month
- Occupancy rates average 32.7%
- Daily rates average $42
Shoulder Season
- Revenue averages $392 per month
- Occupancy maintains around 32.2%
- Daily rates hold near $42
Low Season (July, September, November)
- Revenue drops to average $298 per month
- Occupancy decreases to average 24.2%
- Daily rates adjust to average $43
Seasonality Insights for Valenzuela
- The Airbnb seasonality in Valenzuela shows highly seasonal trends requiring careful strategy. While the sections above show seasonal averages, it's also insightful to look at the extremes:
- During the high season, the absolute peak month showcases Valenzuela's highest earning potential, with monthly revenues capable of climbing to $552, occupancy reaching a high of 39.0%, and ADRs peaking at $45.
- Conversely, the slowest single month of the year, typically falling within the low season, marks the market's lowest point. In this month, revenue might dip to $274, occupancy could drop to 22.7%, and ADRs may adjust down to $40.
- Understanding both the seasonal averages and these monthly peaks and troughs in revenue, occupancy, and ADR is crucial for maximizing your Airbnb profit potential in Valenzuela.
Seasonal Strategies for Maximizing Profit
- Peak Season: Maximize revenue through premium pricing and potentially longer minimum stays. Ensure high availability.
- Low Season: Offer competitive pricing, special promotions (e.g., extended stay discounts), and flexible cancellation policies. Target off-season travelers like remote workers or budget-conscious guests.
- Shoulder Seasons: Implement dynamic pricing that balances peak and low rates. Target weekend travelers or specific events. Offer slightly more flexible terms than peak season.
- Regularly analyze your own performance against these Valenzuela seasonality benchmarks and adjust your pricing and availability strategy accordingly.
Best Areas for Airbnb Investment in Valenzuela (2026)
Exploring the top neighborhoods for short-term rentals in Valenzuela? This section highlights key areas, outlining why they are attractive for hosts and guests, along with notable local attractions. Consider these locations based on your target guest profile and investment strategy.
| Neighborhood / Area | Why Host Here? (Target Guests & Appeal) | Key Attractions & Landmarks |
|---|---|---|
| Karuhatan | A bustling urban area with a mix of residential and commercial spaces. It attracts both business travelers and families due to its accessibility and amenities. | SM City Valenzuela, Valenzuela City Hall, Valenzuela People's Park, Riverbanks Center, Villar SIPAG |
| Gen. T. De Leon | One of the most populated Barangays in Valenzuela, known for its local markets and close-knit community feel. Ideal for those looking to experience everyday Filipino life. | Gen. T. De Leon Wet Market, Bamboo Park, Our Lady of Fatima Parish, local food stalls, Valenzuela Central Park |
| Poblacion | The city center of Valenzuela, rich in history and with a variety of local attractions. Great for tourists wanting to explore the cultural aspects of the area. | Valenzuela Museum, San Diego de Alcala Parish, Old Valenzuela City Hall, local artisan shops, food trips |
| Bagong Silang | A vibrant area known for its community spirit and cultural events. Attracts visitors looking for authentic local experiences and interactions. | Bagong Silang Church, Community bazaars, Food parks, family-oriented events, nearby parks |
| Malinta | A suburban area that offers a mix of residential lifestyle and local businesses. Ideal for families and travelers seeking a quieter environment. | Malinta Elementary School, local eateries, community events, Malinta Park, access to major roads |
| Palasan | A developing area attractive for its potential growth, with many upcoming residential projects and businesses catering to locals and visitors alike. | Palasan Health Center, local markets, new restaurants, residential communities, near transportation hubs |
| Lingunan | A peaceful residential area with easy access to transportation and urban amenities. Suitable for those looking for a relaxing stay while still being near the city. | Lingunan Chapel, local parks, relaxing cafes, community events, access to major routes |
| Lawang Bato | An emerging neighborhood with a blend of urban and cozy atmosphere. Great for those seeking modern accommodations close to urban conveniences. | Lawang Bato Church, local artisan shops, food markets, parks, transport hubs |
Understanding Airbnb License Requirements & STR Laws in Valenzuela (2026)
While Valenzuela, Metro Manila, Philippines currently shows low STR regulations, specific Airbnb license requirements might still exist or change. Always verify the latest short term rental regulations and Airbnb license requirements directly with local government authorities for Valenzuela to ensure full compliance before hosting.
(Source: AirROI data, 2026, finding no licensed listings among those analyzed)
Top Performing Airbnb Properties in Valenzuela (2026)
Benchmark your potential! Explore examples of top-performing Airbnb properties in Valenzuelabased on Trailing Twelve Month (TTM) revenue. Analyze their characteristics, revenue, occupancy rate, and ADR to understand what drives success in this market.
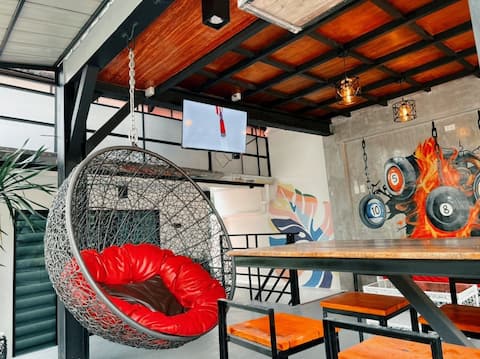
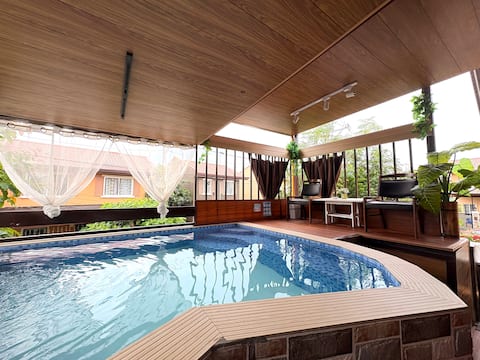
Private Resort in Valenzuela
Entire Place • 2 bedrooms

Cozy House, w/ Mini Pool, Billiard & Videoke.
Entire Place • 3 bedrooms

Jacuzzi Suite | Cozy 2BR Staycation in Valenzuela
Entire Place • 2 bedrooms
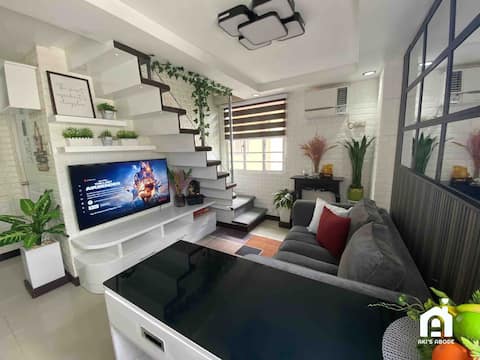
Aki's Abode-Cozy 2storey condo in Valenzuela
Entire Place • 2 bedrooms
Cozy Room, w/ Mini Pool, Billiard & Videoke
Private Room • 1 bedroom
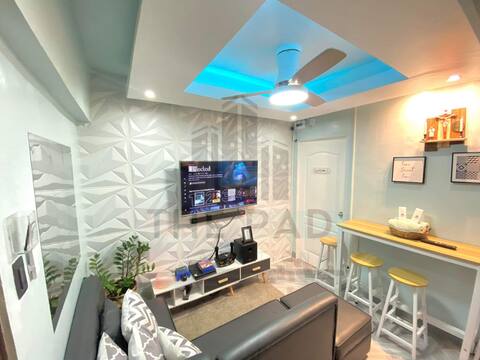
The PAD l 2BR with PS4, WiFi, Netflix
Entire Place • 2 bedrooms
Note: Performance varies based on location, size, amenities, seasonality, and management quality. Data reflects the past 12 months.
Top Performing Airbnb Hosts in Valenzuela (2026)
Learn from the best! This table showcases top-performing Airbnb hosts in Valenzuela based on the number of properties managed and estimated total revenue over the past year. Analyze their scale and performance metrics.
| Host Name | Properties | Grossing Revenue | Stay Reviews | Avg Rating |
|---|---|---|---|---|
| Maria Bernadette | 3 | $23,572 | 54 | 4.83/5.0 |
| Rhea Mae | 9 | $20,238 | 75 | 4.96/5.0 |
| Mark Anthony | 4 | $18,767 | 54 | 4.91/5.0 |
| Arbie | 1 | $17,477 | 4 | 5.00/5.0 |
| Rosshyr Nicole | 4 | $14,447 | 501 | 4.87/5.0 |
| Eve | 2 | $12,430 | 88 | 4.96/5.0 |
| Cheryl | 2 | $11,494 | 151 | 4.91/5.0 |
| Emman & Jovy Staycation | 3 | $10,608 | 54 | 4.69/5.0 |
| Menchie | 1 | $7,354 | 96 | 4.99/5.0 |
| Dhost Ph | 2 | $5,869 | 136 | 4.86/5.0 |
Analyzing the strategies of top hosts, such as their property selection, pricing, and guest communication, can offer valuable lessons for optimizing your own Airbnb operations in Valenzuela.
Dive Deeper: Advanced Valenzuela STR Market Data (2026)
Ready to unlock more insights? AirROI provides access to advanced metrics and comprehensive Airbnb data for Valenzuela. Explore detailed analytics beyond this report to refine your investment strategy, optimize pricing, and maximize your vacation rental profits.
Explore Advanced MetricsValenzuela Short-Term Rental Market Composition (2026): Property & Room Types
Room Type Distribution
Property Type Distribution
Market Composition Insights for Valenzuela
- The Valenzuela Airbnb market composition is heavily skewed towards Entire Home/Apt listings, which make up 85.3% of the 68 active rentals. This indicates strong guest preference for privacy and space.
- Looking at the property type distribution in Valenzuela, Apartment/Condo properties are the most common (72.1%), reflecting the local real estate landscape.
- Houses represent a significant 16.2% portion, catering likely to families or larger groups.
- The presence of 8.8% Hotel/Boutique listings indicates integration with traditional hospitality.
- Smaller segments like others, unique stays (combined 3.0%) offer potential for unique stay experiences.
Valenzuela Airbnb Room Capacity Analysis (2026): Bedroom Distribution
Distribution of Listings by Number of Bedrooms
Room Capacity Insights for Valenzuela
- The dominant room capacity in Valenzuela is 1 bedroom listings, making up 42.6% of the market. This suggests a strong demand for properties suitable for couples or solo travelers.
- Together, 1 bedroom and 2 bedrooms properties represent 79.4% of the active Airbnb listings in Valenzuela, indicating a high concentration in these sizes.
- Listings with 3+ bedrooms (8.9%) represent a smaller niche, potentially indicating an underserved market for larger group accommodations in Valenzuela.
Valenzuela Vacation Rental Guest Capacity Trends (2026)
Distribution of Listings by Guest Capacity
Guest Capacity Insights for Valenzuela
- The most common guest capacity trend in Valenzuela vacation rentals is listings accommodating 8+ guests (29.4%). This suggests the primary traveler segment is likely larger groups.
- Properties designed for 8+ guests and 2 guests dominate the Valenzuela STR market, accounting for 47.0% of listings.
- 39.7% of properties accommodate 6+ guests, serving the market segment for larger families or group travel in Valenzuela.
- On average, properties in Valenzuela are equipped to host 4.6 guests.
Valenzuela Airbnb Booking Patterns (2026): Available vs. Booked Days
Available Days Distribution
Booked Days Distribution
Booking Pattern Insights for Valenzuela
- The most common availability pattern in Valenzuela falls within the 271-366 days range, representing 72.1% of listings. This suggests many properties have significant open periods on their calendars.
- Approximately 97.1% of listings show high availability (181+ days open annually), indicating potential for increased bookings or specific owner usage patterns.
- For booked days, the 31-90 days range is most frequent in Valenzuela (45.6%), reflecting common guest stay durations or potential owner blocking patterns.
- A notable 2.9% of properties secure long booking periods (181+ days booked per year), highlighting successful long-term rental strategies or significant owner usage.
Valenzuela Airbnb Minimum Stay Requirements Analysis
Distribution of Listings by Minimum Night Requirement
1 Night
63 listings
92.6% of total
2 Nights
3 listings
4.4% of total
30+ Nights
2 listings
2.9% of total
Key Insights
- The most prevalent minimum stay requirement in Valenzuela is 1 Night, adopted by 92.6% of listings. This highlights the market's preference for shorter, flexible bookings.
- A strong majority (97.0%) of the Valenzuela Airbnb data shows acceptance of very short stays (1-2 nights), indicating a dynamic, high-turnover market.
- Dedicated monthly rentals (30+ nights) represent a small niche (2.9%), possibly an untapped area for hosts.
Recommendations
- Align with the market by considering a 1 Night minimum stay, as 92.6% of Valenzuela hosts use this setting.
- Adjust minimum nights based on seasonality – potentially shorter during low season and longer during peak demand periods in Valenzuela.
Valenzuela Airbnb Cancellation Policy Trends Analysis (2026)
Limited
6 listings
9.1% of total
Flexible
13 listings
19.7% of total
Moderate
13 listings
19.7% of total
Firm
30 listings
45.5% of total
Strict
4 listings
6.1% of total
Cancellation Policy Insights for Valenzuela
- The prevailing Airbnb cancellation policy trend in Valenzuela is Firm, used by 45.5% of listings.
- A majority (51.6%) of hosts in Valenzuela utilize Firm or Strict policies, indicating a market where hosts prioritize booking security.
- Strict cancellation policies are quite rare (6.1%), potentially making listings with this policy less competitive unless justified by high demand or property type.
Recommendations for Hosts
- Consider adopting a Firm policy to align with the 45.5% market standard in Valenzuela.
- Using a Strict policy might deter some guests, as only 6.1% of listings use it. Evaluate if potential revenue protection outweighs possible lower booking rates.
- Regularly review your cancellation policy against competitors and market demand shifts in Valenzuela.
Valenzuela STR Booking Lead Time Analysis (2026)
Average Booking Lead Time by Month
Booking Lead Time Insights for Valenzuela
- The overall average booking lead time for vacation rentals in Valenzuela is 16 days.
- Guests book furthest in advance for stays during December (average 43 days), likely coinciding with peak travel demand or local events.
- The shortest booking windows occur for stays in June (average 8 days), indicating more last-minute travel plans during this time.
- Seasonally, Winter (23 days avg.) sees the longest lead times, while Summer (12 days avg.) has the shortest, reflecting typical travel planning cycles.
Recommendations for Hosts
- Use the overall average lead time (16 days) as a baseline for your pricing and availability strategy in Valenzuela.
- For December stays, consider implementing length-of-stay discounts or slightly higher rates for bookings made less than 43 days out to capitalize on advance planning.
- During June, focus on last-minute booking availability and promotions, as guests book with very short notice (8 days avg.).
- Target marketing efforts for the Winter season well in advance (at least 23 days) to capture early planners.
- Monitor your own booking lead times against these Valenzuela averages to identify opportunities for dynamic pricing adjustments.
Popular & Essential Airbnb Amenities in Valenzuela (2026)
Amenity Prevalence
Amenity Insights for Valenzuela
- Essential amenities in Valenzuela that guests expect include: Air conditioning, Wifi, Kitchen, TV. Lacking these (any) could significantly impact bookings.
- Popular amenities like Pool, Smoke alarm, Refrigerator are common but not universal. Offering these can provide a competitive edge.
- A pool is a highly desired but not standard amenity, making it a key feature for attracting guests seeking leisure in Valenzuela.
Recommendations for Hosts
- Ensure your listing includes all essential amenities for Valenzuela: Air conditioning, Wifi, Kitchen, TV.
- Prioritize adding missing essentials: Air conditioning, Wifi, Kitchen, TV.
- Consider adding popular differentiators like Pool or Smoke alarm to increase appeal.
- Highlight unique or less common amenities you offer (e.g., hot tub, dedicated workspace, EV charger) in your listing description and photos.
- Regularly check competitor amenities in Valenzuela to stay competitive.
Valenzuela Airbnb Guest Demographics & Profile Analysis (2026)
Guest Profile Summary for Valenzuela
- The typical guest profile for Airbnb in Valenzuela consists of primarily domestic travelers (74%), often arriving from nearby Valenzuela, typically belonging to the Post-2000s (Gen Z/Alpha) group (50%), primarily speaking English or Filipino.
- Domestic travelers account for 73.6% of guests.
- Key international markets include Philippines (73.6%) and United States (12.9%).
- Top languages spoken are English (51.1%) followed by Filipino (21.6%).
- A significant demographic segment is the Post-2000s (Gen Z/Alpha) group, representing 50% of guests.
Recommendations for Hosts
- Target domestic marketing efforts towards travelers from Valenzuela and Caloocan.
- Tailor amenities and listing descriptions to appeal to the dominant Post-2000s (Gen Z/Alpha) demographic (e.g., highlight fast WiFi, smart home features, local guides).
- Highlight unique local experiences or amenities relevant to the primary guest profile.
- Consider seasonal promotions aligned with peak travel times for key origin markets.
Nearby Short-Term Rental Market Comparison
How does the Valenzuela Airbnb market stack up against its neighbors? Compare key performance metrics like average monthly revenue, ADR, and occupancy rates in surrounding areas to understand the broader regional STR landscape.
| Market | Active Properties | Monthly Revenue | Daily Rate | Avg. Occupancy |
|---|---|---|---|---|
| Bustos | 10 | $1,728 | $216.86 | 28% |
| Cabangan | 44 | $1,529 | $200.94 | 26% |
| Lian | 121 | $1,491 | $216.20 | 24% |
| Jalajala | 19 | $1,489 | $234.86 | 21% |
| Laoag | 17 | $1,412 | $158.39 | 33% |
| Beneg | 13 | $1,304 | $267.34 | 22% |
| Arew | 11 | $1,288 | $193.81 | 22% |
| Cabuyao | 25 | $1,202 | $114.93 | 36% |
| Binangonan | 49 | $1,191 | $135.12 | 29% |
| Porac | 51 | $1,157 | $203.91 | 21% |