Bacong Airbnb Market Analysis 2026: Short Term Rental Data & Vacation Rental Statistics in Negros Oriental, Philippines
Is Airbnb profitable in Bacong in 2026? Explore comprehensive Airbnb analytics for Bacong, Negros Oriental, Philippines to uncover income potential. This 2026 STR market report for Bacong, based on AirROI data from February 2025 to January 2026, reveals key trends in the niche market of 20 active listings.
Whether you're considering an Airbnb investment in Bacong, optimizing your existing vacation rental, or exploring rental arbitrage opportunities, understanding the Bacong Airbnb data is crucial. Leveraging the low regulation environment is key to maximizing your short term rental income potential. Let's dive into the specifics.
Key Bacong Airbnb Performance Metrics Overview
Monthly Airbnb Revenue Variations & Income Potential in Bacong (2026)
Understanding the monthly revenue variations for Airbnb listings in Bacong is key to maximizing your short term rental income potential. Seasonality significantly impacts earnings. Our analysis, based on data from the past 12 months, shows that the peak revenue month for STRs in Bacong is typically February, while January often presents the lowest earnings, highlighting opportunities for strategic pricing adjustments during shoulder and low seasons. Explore the typical Airbnb income in Bacong across different performance tiers:
- Best-in-class properties (Top 10%) achieve $1,744+ monthly, often utilizing dynamic pricing and superior guest experiences.
- Strong performing properties (Top 25%) earn $621 or more, indicating effective management and desirable locations/amenities.
- Typical properties (Median) generate around $267 per month, representing the average market performance.
- Entry-level properties (Bottom 25%) see earnings around $109, often with potential for optimization.
Average Monthly Airbnb Earnings Trend in Bacong
Bacong Airbnb Occupancy Rate Trends (2026)
Maximize your bookings by understanding the Bacong STR occupancy trends. Seasonal demand shifts significantly influence how often properties are booked. Typically, Februarysees the highest demand (peak season occupancy), while November experiences the lowest (low season). Effective strategies, like adjusting minimum stays or offering promotions, can boost occupancy during slower periods. Here's how different property tiers perform in Bacong:
- Best-in-class properties (Top 10%) achieve 75%+ occupancy, indicating high desirability and potentially optimized availability.
- Strong performing properties (Top 25%) maintain 52% or higher occupancy, suggesting good market fit and guest satisfaction.
- Typical properties (Median) have an occupancy rate around 34%.
- Entry-level properties (Bottom 25%) average 18% occupancy, potentially facing higher vacancy.
Average Monthly Occupancy Rate Trend in Bacong
Average Daily Rate (ADR) Airbnb Trends in Bacong (2026)
Effective short term rental pricing strategy in Bacong involves understanding monthly ADR fluctuations. The Average Daily Rate (ADR) for Airbnb in Bacong typically peaks in May and dips lowest during January. Leveraging Airbnb dynamic pricing tools or strategies based on this seasonality can significantly boost revenue. Here's a look at the typical nightly rates achieved:
- Best-in-class properties (Top 10%) command rates of $79+ per night, often due to premium features or locations.
- Strong performing properties (Top 25%) achieve nightly rates of $49 or more.
- Typical properties (Median) charge around $28 per night.
- Entry-level properties (Bottom 25%) earn around $21 per night.
Average Daily Rate (ADR) Trend by Month in Bacong
Get Live Bacong Market Intelligence 👇

Explore Real-time Analytics
Airbnb Seasonality Analysis & Trends in Bacong (2026)
Peak Season (February, April, May)
- Revenue averages $667 per month
- Occupancy rates average 47.7%
- Daily rates average $41
Shoulder Season
- Revenue averages $504 per month
- Occupancy maintains around 34.8%
- Daily rates hold near $39
Low Season (January, August, November)
- Revenue drops to average $391 per month
- Occupancy decreases to average 29.7%
- Daily rates adjust to average $38
Seasonality Insights for Bacong
- The Airbnb seasonality in Bacong shows highly seasonal trends requiring careful strategy. While the sections above show seasonal averages, it's also insightful to look at the extremes:
- During the high season, the absolute peak month showcases Bacong's highest earning potential, with monthly revenues capable of climbing to $717, occupancy reaching a high of 54.4%, and ADRs peaking at $41.
- Conversely, the slowest single month of the year, typically falling within the low season, marks the market's lowest point. In this month, revenue might dip to $331, occupancy could drop to 23.0%, and ADRs may adjust down to $37.
- Understanding both the seasonal averages and these monthly peaks and troughs in revenue, occupancy, and ADR is crucial for maximizing your Airbnb profit potential in Bacong.
Seasonal Strategies for Maximizing Profit
- Peak Season: Maximize revenue through premium pricing and potentially longer minimum stays. Ensure high availability.
- Low Season: Offer competitive pricing, special promotions (e.g., extended stay discounts), and flexible cancellation policies. Target off-season travelers like remote workers or budget-conscious guests.
- Shoulder Seasons: Implement dynamic pricing that balances peak and low rates. Target weekend travelers or specific events. Offer slightly more flexible terms than peak season.
- Regularly analyze your own performance against these Bacong seasonality benchmarks and adjust your pricing and availability strategy accordingly.
Best Areas for Airbnb Investment in Bacong (2026)
Exploring the top neighborhoods for short-term rentals in Bacong? This section highlights key areas, outlining why they are attractive for hosts and guests, along with notable local attractions. Consider these locations based on your target guest profile and investment strategy.
| Neighborhood / Area | Why Host Here? (Target Guests & Appeal) | Key Attractions & Landmarks |
|---|---|---|
| Dumaguete City | The capital of Negros Oriental known for its vibrant expat community and educational institutions. It attracts tourists with its cultural mix, coastal lifestyle, and proximity to diving spots. | Silliman University, Dumaguete Belfry, Rizal Boulevard, Casaroro Falls, Palitang Beach |
| Apo Island | A UNESCO Marine Reserve famous for its diving and snorkeling opportunities. This remote island attracts adventure seekers and nature lovers looking for a unique aquatic experience. | Apo Island Marine Sanctuary, Diving spots, Snorkeling areas, Beaches, Mt. Apo |
| Valencia | A picturesque town located 8 kilometers from Dumaguete, known for its cooler climate and beautiful landscapes. It's ideal for tourists looking for a serene getaway close to the city. | Forest Camp, Casaroro Falls, Nangkaan Falls, Malabo Falls, Antulang Beach |
| Banilad | A serene area near Dumaguete known for its beaches and laid-back lifestyle. Attracts those looking for a relaxing beach atmosphere with close distance to the city. | Banilad Beach, Marina Bay, Santa Monica Beach, Dive sites, Local restaurants |
| Sibulan | A small town close to Dumaguete that serves as a hub for travelers going to Apo Island. A good spot for budget travelers and those looking to explore surrounding areas. | Sibulan Beach, Local markets, Diving schools, Marine sanctuaries, Historical sites |
| Zamboanguita | A coastal town located south of Dumaguete, known for its serenity and diving spots. A hidden gem for those who want a peaceful beach experience away from the crowds. | Dive sites, Bamboo Beach, Local eateries, Beautiful sunsets, Underrated beaches |
| Kanlaon | Home to Mount Kanlaon, the highest peak in the Visayas, attracting trekkers and nature enthusiasts. It's ideal for adventure seekers looking for hiking and natural attractions. | Kanlaon Volcano, Forest reserves, Scenic hiking trails, Camping spots, Wildlife sanctuaries |
| Negros Oriental Reclamation Area | A developing area in Dumaguete that attracts businesses and tourists alike. It's great for those looking to invest in a growing commercial area. | New developments, Coastal parks, Restaurants, Shopping areas, Recreational facilities |
Understanding Airbnb License Requirements & STR Laws in Bacong (2026)
While Bacong, Negros Oriental, Philippines currently shows low STR regulations, specific Airbnb license requirements might still exist or change. Always verify the latest short term rental regulations and Airbnb license requirements directly with local government authorities for Bacong to ensure full compliance before hosting.
(Source: AirROI data, 2026, finding no licensed listings among those analyzed)
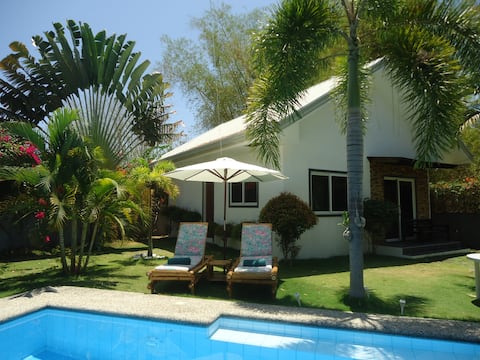
Top Performing Airbnb Properties in Bacong (2026)
Benchmark your potential! Explore examples of top-performing Airbnb properties in Bacongbased on Trailing Twelve Month (TTM) revenue. Analyze their characteristics, revenue, occupancy rate, and ADR to understand what drives success in this market.

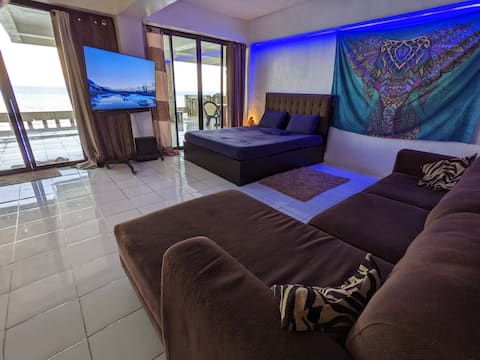
Tropical Hideaway 6 BR and pool
Entire Place • 6 bedrooms
A hidden jewel: Joy's Garden Guest House
Entire Place • 1 bedroom
Modern 3-Bedroom Home | Just 10 Minutes from Dauin
Entire Place • 3 bedrooms
Spacious Dauin Beach House with Island Views!
Entire Place • 2 bedrooms
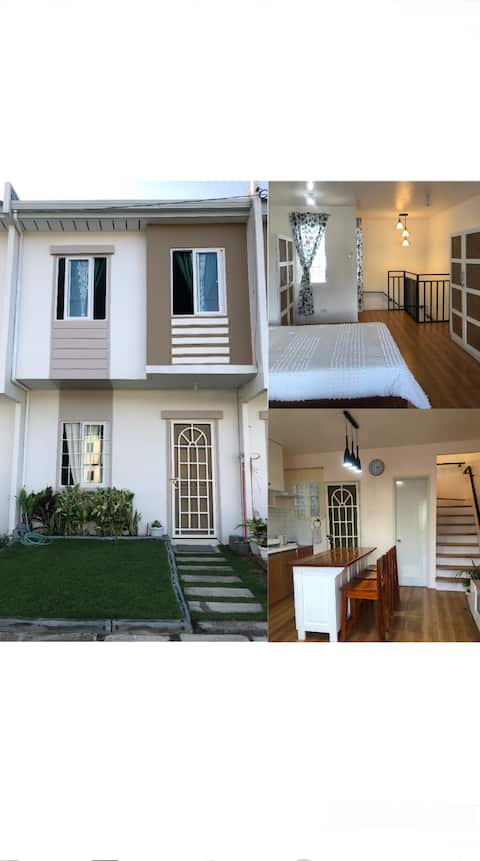
Cozy Home (2-storey, 50sq.ft.)
Entire Place • 1 bedroom
Beach Studio Fast Wi-Fi Bacong - Dumaguete
Private Room • N/A
Note: Performance varies based on location, size, amenities, seasonality, and management quality. Data reflects the past 12 months.
Top Performing Airbnb Hosts in Bacong (2026)
Learn from the best! This table showcases top-performing Airbnb hosts in Bacong based on the number of properties managed and estimated total revenue over the past year. Analyze their scale and performance metrics.
| Host Name | Properties | Grossing Revenue | Stay Reviews | Avg Rating |
|---|---|---|---|---|
| Trajan | 1 | $26,746 | 504 | 4.82/5.0 |
| Joy | 1 | $7,372 | 48 | 5.00/5.0 |
| Hanz | 1 | $5,855 | 48 | 4.79/5.0 |
| Lu | 4 | $3,555 | 38 | 4.37/5.0 |
| Gaël | 2 | $3,478 | 24 | 4.58/5.0 |
| Catherine Rose | 2 | $3,025 | 7 | 4.83/5.0 |
| Roy | 1 | $2,886 | 13 | 4.85/5.0 |
| Longski | 1 | $2,672 | 26 | 4.73/5.0 |
| Ranz | 1 | $1,486 | 11 | 4.64/5.0 |
| Rosaly | 1 | $1,308 | 1 | Not Rated |
Analyzing the strategies of top hosts, such as their property selection, pricing, and guest communication, can offer valuable lessons for optimizing your own Airbnb operations in Bacong.
Dive Deeper: Advanced Bacong STR Market Data (2026)
Ready to unlock more insights? AirROI provides access to advanced metrics and comprehensive Airbnb data for Bacong. Explore detailed analytics beyond this report to refine your investment strategy, optimize pricing, and maximize your vacation rental profits.
Explore Advanced MetricsBacong Short-Term Rental Market Composition (2026): Property & Room Types
Room Type Distribution
Property Type Distribution
Market Composition Insights for Bacong
- The Bacong Airbnb market composition is heavily skewed towards Entire Home/Apt listings, which make up 80% of the 20 active rentals. This indicates strong guest preference for privacy and space.
- Looking at the property type distribution in Bacong, House properties are the most common (45%), reflecting the local real estate landscape.
- Houses represent a significant 45% portion, catering likely to families or larger groups.
- The presence of 15% Hotel/Boutique listings indicates integration with traditional hospitality.
Bacong Airbnb Room Capacity Analysis (2026): Bedroom Distribution
Distribution of Listings by Number of Bedrooms
Room Capacity Insights for Bacong
- The dominant room capacity in Bacong is 1 bedroom listings, making up 60% of the market. This suggests a strong demand for properties suitable for couples or solo travelers.
- Together, 1 bedroom and 2 bedrooms properties represent 80.0% of the active Airbnb listings in Bacong, indicating a high concentration in these sizes.
- With over half the market (60%) consisting of studios or 1-bedroom units, Bacong is particularly well-suited for individuals or couples.
Bacong Vacation Rental Guest Capacity Trends (2026)
Distribution of Listings by Guest Capacity
Guest Capacity Insights for Bacong
- The most common guest capacity trend in Bacong vacation rentals is listings accommodating 2 guests (35%). This suggests the primary traveler segment is likely couples or solo travelers.
- Properties designed for 2 guests and 8+ guests dominate the Bacong STR market, accounting for 50.0% of listings.
- 20.0% of properties accommodate 6+ guests, serving the market segment for larger families or group travel in Bacong.
- On average, properties in Bacong are equipped to host 3.6 guests.
Bacong Airbnb Booking Patterns (2026): Available vs. Booked Days
Available Days Distribution
Booked Days Distribution
Booking Pattern Insights for Bacong
- The most common availability pattern in Bacong falls within the 271-366 days range, representing 70% of listings. This suggests many properties have significant open periods on their calendars.
- Approximately 90.0% of listings show high availability (181+ days open annually), indicating potential for increased bookings or specific owner usage patterns.
- For booked days, the 1-30 days range is most frequent in Bacong (50%), reflecting common guest stay durations or potential owner blocking patterns.
- A notable 15.0% of properties secure long booking periods (181+ days booked per year), highlighting successful long-term rental strategies or significant owner usage.
Bacong Airbnb Minimum Stay Requirements Analysis
Distribution of Listings by Minimum Night Requirement
1 Night
8 listings
40% of total
2 Nights
3 listings
15% of total
3 Nights
3 listings
15% of total
30+ Nights
6 listings
30% of total
Key Insights
- The most prevalent minimum stay requirement in Bacong is 1 Night, adopted by 40% of listings. This highlights the market's preference for shorter, flexible bookings.
- A significant segment (30%) caters to monthly stays (30+ nights) in Bacong, pointing to opportunities in the extended-stay market.
Recommendations
- Align with the market by considering a 1 Night minimum stay, as 40% of Bacong hosts use this setting.
- Explore offering discounts for stays of 30+ nights to attract the 30% of the market seeking extended stays.
- Adjust minimum nights based on seasonality – potentially shorter during low season and longer during peak demand periods in Bacong.
Bacong Airbnb Cancellation Policy Trends Analysis (2026)
Flexible
6 listings
30% of total
Moderate
5 listings
25% of total
Firm
8 listings
40% of total
Strict
1 listings
5% of total
Cancellation Policy Insights for Bacong
- The prevailing Airbnb cancellation policy trend in Bacong is Firm, used by 40% of listings.
- There's a relatively balanced mix between guest-friendly (55.0%) and stricter (45.0%) policies, offering choices for different guest needs.
- Strict cancellation policies are quite rare (5%), potentially making listings with this policy less competitive unless justified by high demand or property type.
Recommendations for Hosts
- Consider adopting a Firm policy to align with the 40% market standard in Bacong.
- Using a Strict policy might deter some guests, as only 5% of listings use it. Evaluate if potential revenue protection outweighs possible lower booking rates.
- Regularly review your cancellation policy against competitors and market demand shifts in Bacong.
Bacong STR Booking Lead Time Analysis (2026)
Average Booking Lead Time by Month
Booking Lead Time Insights for Bacong
- The overall average booking lead time for vacation rentals in Bacong is 36 days.
- Guests book furthest in advance for stays during August (average 59 days), likely coinciding with peak travel demand or local events.
- The shortest booking windows occur for stays in October (average 16 days), indicating more last-minute travel plans during this time.
- Seasonally, Summer (42 days avg.) sees the longest lead times, while Fall (22 days avg.) has the shortest, reflecting typical travel planning cycles.
Recommendations for Hosts
- Use the overall average lead time (36 days) as a baseline for your pricing and availability strategy in Bacong.
- For August stays, consider implementing length-of-stay discounts or slightly higher rates for bookings made less than 59 days out to capitalize on advance planning.
- Target marketing efforts for the Summer season well in advance (at least 42 days) to capture early planners.
- Monitor your own booking lead times against these Bacong averages to identify opportunities for dynamic pricing adjustments.
Popular & Essential Airbnb Amenities in Bacong (2026)
Amenity Prevalence
Amenity Insights for Bacong
- Essential amenities in Bacong that guests expect include: Air conditioning, Wifi. Lacking these (any) could significantly impact bookings.
- Popular amenities like Fire extinguisher, Free parking on premises, TV are common but not universal. Offering these can provide a competitive edge.
Recommendations for Hosts
- Ensure your listing includes all essential amenities for Bacong: Air conditioning, Wifi.
- Prioritize adding missing essentials: Air conditioning, Wifi.
- Consider adding popular differentiators like Fire extinguisher or Free parking on premises to increase appeal.
- Highlight unique or less common amenities you offer (e.g., hot tub, dedicated workspace, EV charger) in your listing description and photos.
- Regularly check competitor amenities in Bacong to stay competitive.
Bacong Airbnb Guest Demographics & Profile Analysis (2026)
Guest Profile Summary for Bacong
- The typical guest profile for Airbnb in Bacong consists of predominantly international visitors (74%), with top international origins including Philippines, typically belonging to the Post-2000s (Gen Z/Alpha) group (50%), primarily speaking English or Tagalog.
- Domestic travelers account for 26.5% of guests.
- Key international markets include United States (32.7%) and Philippines (26.5%).
- Top languages spoken are English (50%) followed by Tagalog (10.4%).
- A significant demographic segment is the Post-2000s (Gen Z/Alpha) group, representing 50% of guests.
Recommendations for Hosts
- Focus marketing internationally, particularly towards travelers from Philippines.
- Tailor amenities and listing descriptions to appeal to the dominant Post-2000s (Gen Z/Alpha) demographic (e.g., highlight fast WiFi, smart home features, local guides).
- Highlight unique local experiences or amenities relevant to the primary guest profile.
- Consider seasonal promotions aligned with peak travel times for key origin markets.
Nearby Short-Term Rental Market Comparison
How does the Bacong Airbnb market stack up against its neighbors? Compare key performance metrics like average monthly revenue, ADR, and occupancy rates in surrounding areas to understand the broader regional STR landscape.
| Market | Active Properties | Monthly Revenue | Daily Rate | Avg. Occupancy |
|---|---|---|---|---|
| Mantalongon | 11 | $1,269 | $126.62 | 35% |
| Gaas | 10 | $1,141 | $180.05 | 30% |
| Samboan | 11 | $1,048 | $117.88 | 28% |
| Santander | 14 | $905 | $96.82 | 32% |
| Tuble | 37 | $631 | $63.59 | 34% |
| Basdiot | 144 | $601 | $58.88 | 38% |
| Balabagon | 13 | $561 | $43.13 | 53% |
| Lazi | 30 | $515 | $50.03 | 37% |
| Manolo Fortich | 37 | $511 | $103.03 | 23% |
| Panglao | 526 | $507 | $66.52 | 31% |