Cabanatuan Airbnb Market Analysis 2026: Short Term Rental Data & Vacation Rental Statistics in Nueva Ecija, Philippines
Is Airbnb profitable in Cabanatuan in 2026? Explore comprehensive Airbnb analytics for Cabanatuan, Nueva Ecija, Philippines to uncover income potential. This 2026 STR market report for Cabanatuan, based on AirROI data from February 2025 to January 2026, reveals key trends in the niche market of 73 active listings.
Whether you're considering an Airbnb investment in Cabanatuan, optimizing your existing vacation rental, or exploring rental arbitrage opportunities, understanding the Cabanatuan Airbnb data is crucial. Leveraging the low regulation environment is key to maximizing your short term rental income potential. Let's dive into the specifics.
Key Cabanatuan Airbnb Performance Metrics Overview
Monthly Airbnb Revenue Variations & Income Potential in Cabanatuan (2026)
Understanding the monthly revenue variations for Airbnb listings in Cabanatuan is key to maximizing your short term rental income potential. Seasonality significantly impacts earnings. Our analysis, based on data from the past 12 months, shows that the peak revenue month for STRs in Cabanatuan is typically July, while January often presents the lowest earnings, highlighting opportunities for strategic pricing adjustments during shoulder and low seasons. Explore the typical Airbnb income in Cabanatuan across different performance tiers:
- Best-in-class properties (Top 10%) achieve $791+ monthly, often utilizing dynamic pricing and superior guest experiences.
- Strong performing properties (Top 25%) earn $361 or more, indicating effective management and desirable locations/amenities.
- Typical properties (Median) generate around $169 per month, representing the average market performance.
- Entry-level properties (Bottom 25%) see earnings around $73, often with potential for optimization.
Average Monthly Airbnb Earnings Trend in Cabanatuan
Cabanatuan Airbnb Occupancy Rate Trends (2026)
Maximize your bookings by understanding the Cabanatuan STR occupancy trends. Seasonal demand shifts significantly influence how often properties are booked. Typically, Februarysees the highest demand (peak season occupancy), while October experiences the lowest (low season). Effective strategies, like adjusting minimum stays or offering promotions, can boost occupancy during slower periods. Here's how different property tiers perform in Cabanatuan:
- Best-in-class properties (Top 10%) achieve 59%+ occupancy, indicating high desirability and potentially optimized availability.
- Strong performing properties (Top 25%) maintain 38% or higher occupancy, suggesting good market fit and guest satisfaction.
- Typical properties (Median) have an occupancy rate around 20%.
- Entry-level properties (Bottom 25%) average 9% occupancy, potentially facing higher vacancy.
Average Monthly Occupancy Rate Trend in Cabanatuan
Average Daily Rate (ADR) Airbnb Trends in Cabanatuan (2026)
Effective short term rental pricing strategy in Cabanatuan involves understanding monthly ADR fluctuations. The Average Daily Rate (ADR) for Airbnb in Cabanatuan typically peaks in July and dips lowest during March. Leveraging Airbnb dynamic pricing tools or strategies based on this seasonality can significantly boost revenue. Here's a look at the typical nightly rates achieved:
- Best-in-class properties (Top 10%) command rates of $54+ per night, often due to premium features or locations.
- Strong performing properties (Top 25%) achieve nightly rates of $37 or more.
- Typical properties (Median) charge around $26 per night.
- Entry-level properties (Bottom 25%) earn around $22 per night.
Average Daily Rate (ADR) Trend by Month in Cabanatuan
Get Live Cabanatuan Market Intelligence 👇

Explore Real-time Analytics
Airbnb Seasonality Analysis & Trends in Cabanatuan (2026)
Peak Season (July, May, December)
- Revenue averages $603 per month
- Occupancy rates average 26.7%
- Daily rates average $38
Shoulder Season
- Revenue averages $403 per month
- Occupancy maintains around 28.5%
- Daily rates hold near $37
Low Season (January, October, November)
- Revenue drops to average $322 per month
- Occupancy decreases to average 22.0%
- Daily rates adjust to average $37
Seasonality Insights for Cabanatuan
- The Airbnb seasonality in Cabanatuan shows highly seasonal trends requiring careful strategy. While the sections above show seasonal averages, it's also insightful to look at the extremes:
- During the high season, the absolute peak month showcases Cabanatuan's highest earning potential, with monthly revenues capable of climbing to $675, occupancy reaching a high of 34.8%, and ADRs peaking at $39.
- Conversely, the slowest single month of the year, typically falling within the low season, marks the market's lowest point. In this month, revenue might dip to $314, occupancy could drop to 21.6%, and ADRs may adjust down to $36.
- Understanding both the seasonal averages and these monthly peaks and troughs in revenue, occupancy, and ADR is crucial for maximizing your Airbnb profit potential in Cabanatuan.
Seasonal Strategies for Maximizing Profit
- Peak Season: Maximize revenue through premium pricing and potentially longer minimum stays. Ensure high availability.
- Low Season: Offer competitive pricing, special promotions (e.g., extended stay discounts), and flexible cancellation policies. Target off-season travelers like remote workers or budget-conscious guests.
- Shoulder Seasons: Implement dynamic pricing that balances peak and low rates. Target weekend travelers or specific events. Offer slightly more flexible terms than peak season.
- Regularly analyze your own performance against these Cabanatuan seasonality benchmarks and adjust your pricing and availability strategy accordingly.
Best Areas for Airbnb Investment in Cabanatuan (2026)
Exploring the top neighborhoods for short-term rentals in Cabanatuan? This section highlights key areas, outlining why they are attractive for hosts and guests, along with notable local attractions. Consider these locations based on your target guest profile and investment strategy.
| Neighborhood / Area | Why Host Here? (Target Guests & Appeal) | Key Attractions & Landmarks |
|---|---|---|
| San Isidro | A bustling suburban neighborhood known for its local markets and family-friendly environment. It's a growing area with increasing interest from tourists seeking a local experience in Cabanatuan. | San Isidro Cathedral, Cabanatuan Public Market, Fried Chicken Alley, local eateries and shops |
| Del Pilar | One of the most accessible areas in Cabanatuan, popular for its proximity to schools and businesses. Ideal for guests visiting the city for work or family events. | Cabanatuan City Plaza, historical sites, restaurants, local cafes |
| Bambang | A vibrant neighborhood known for its lively atmosphere and shopping options. It attracts tourists looking for a local shopping experience and food adventures. | Bambang Market, food stalls, shopping outlets, Cabanatuan's best local cuisine |
| Quezon | A residential area that offers a peaceful environment yet is close to the city center. It appeals to families and travelers looking for a quiet stay while being near attractions. | Cabanatuan Cathedral, local parks, community events |
| Carmen | A mix of residential and commercial zones, Carmen is expanding rapidly and offers various rental options. It's perfect for short and extended stays. | Vibrant night market, local attractions, convenience to amenities |
| Nueva Ecija Science High School Area | Popular among students and their families, this area attracts visitors attending school events and competitions throughout the year. | Science High School events, community gatherings, local parks |
| Barangay San Jose | Located near educational institutions and local businesses, this neighborhood is attractive for those visiting for academic purposes or local work. | educational institutions, local dining options, community centers |
| Poblacion | The heart of Cabanatuan, being the central business district, it is perfect for tourists who want to be close to shops, restaurants, and cultural hotspots. | main shopping areas, Cabanatuan historical markers, nightlife options |
Understanding Airbnb License Requirements & STR Laws in Cabanatuan (2026)
While Cabanatuan, Nueva Ecija, Philippines currently shows low STR regulations, specific Airbnb license requirements might still exist or change. Always verify the latest short term rental regulations and Airbnb license requirements directly with local government authorities for Cabanatuan to ensure full compliance before hosting.
(Source: AirROI data, 2026, finding no licensed listings among those analyzed)
Top Performing Airbnb Properties in Cabanatuan (2026)
Benchmark your potential! Explore examples of top-performing Airbnb properties in Cabanatuanbased on Trailing Twelve Month (TTM) revenue. Analyze their characteristics, revenue, occupancy rate, and ADR to understand what drives success in this market.

The Resthouse Sister
Entire Place • 3 bedrooms
![NearSM: Staycation Villa [Fully AC+Pool+Videoke]](https://a0.muscache.com/im/pictures/miso/Hosting-1030825897186619855/original/9d86e84b-8200-4e8e-83b6-bd9eebb05358.jpeg?im_w=480&im_format=avif)
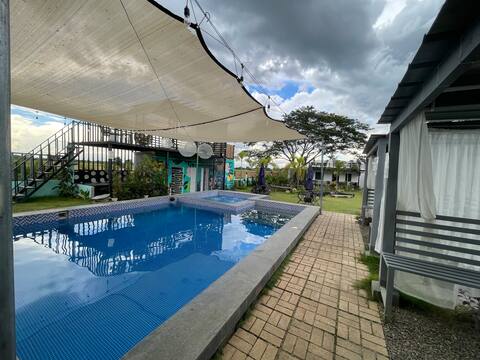
NearSM: Staycation Villa [Fully AC+Pool+Videoke]
Entire Place • 3 bedrooms

Swimming Pool and villa
Entire Place • 3 bedrooms
Private, serene, and relaxing.
Entire Place • 1 bedroom

Comfy & Cozy in Cabanatuan
Entire Place • 2 bedrooms
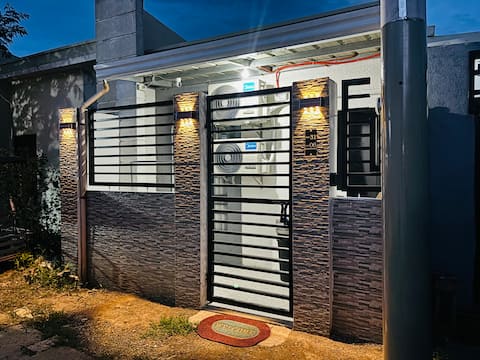
Minimalist,2 aircon,washing,netflix,room division.
Entire Place • 1 bedroom
Note: Performance varies based on location, size, amenities, seasonality, and management quality. Data reflects the past 12 months.
Top Performing Airbnb Hosts in Cabanatuan (2026)
Learn from the best! This table showcases top-performing Airbnb hosts in Cabanatuan based on the number of properties managed and estimated total revenue over the past year. Analyze their scale and performance metrics.
| Host Name | Properties | Grossing Revenue | Stay Reviews | Avg Rating |
|---|---|---|---|---|
| Roxanne | 1 | $57,543 | 8 | 5.00/5.0 |
| Divina | 4 | $36,991 | 207 | 4.97/5.0 |
| Leanne | 1 | $16,994 | 14 | 4.79/5.0 |
| May Dee | 1 | $11,000 | 2 | Not Rated |
| Elena Kristine | 3 | $9,198 | 49 | 4.92/5.0 |
| Francisco | 2 | $8,808 | 137 | 4.97/5.0 |
| Olivia | 8 | $8,779 | 146 | 4.92/5.0 |
| Ardie | 1 | $6,524 | 57 | 4.88/5.0 |
| Galvin Jaye | 4 | $5,232 | 86 | 4.96/5.0 |
| Mike | 1 | $4,355 | 6 | 5.00/5.0 |
Analyzing the strategies of top hosts, such as their property selection, pricing, and guest communication, can offer valuable lessons for optimizing your own Airbnb operations in Cabanatuan.
Dive Deeper: Advanced Cabanatuan STR Market Data (2026)
Ready to unlock more insights? AirROI provides access to advanced metrics and comprehensive Airbnb data for Cabanatuan. Explore detailed analytics beyond this report to refine your investment strategy, optimize pricing, and maximize your vacation rental profits.
Explore Advanced MetricsCabanatuan Short-Term Rental Market Composition (2026): Property & Room Types
Room Type Distribution
Property Type Distribution
Market Composition Insights for Cabanatuan
- The Cabanatuan Airbnb market composition is heavily skewed towards Entire Home/Apt listings, which make up 83.6% of the 73 active rentals. This indicates strong guest preference for privacy and space.
- Looking at the property type distribution in Cabanatuan, House properties are the most common (64.4%), reflecting the local real estate landscape.
- Houses represent a significant 64.4% portion, catering likely to families or larger groups.
- The presence of 6.8% Hotel/Boutique listings indicates integration with traditional hospitality.
- Smaller segments like others (combined 4.1%) offer potential for unique stay experiences.
Cabanatuan Airbnb Room Capacity Analysis (2026): Bedroom Distribution
Distribution of Listings by Number of Bedrooms
Room Capacity Insights for Cabanatuan
- The dominant room capacity in Cabanatuan is 1 bedroom listings, making up 53.4% of the market. This suggests a strong demand for properties suitable for couples or solo travelers.
- Together, 1 bedroom and 2 bedrooms properties represent 68.5% of the active Airbnb listings in Cabanatuan, indicating a high concentration in these sizes.
- With over half the market (53.4%) consisting of studios or 1-bedroom units, Cabanatuan is particularly well-suited for individuals or couples.
Cabanatuan Vacation Rental Guest Capacity Trends (2026)
Distribution of Listings by Guest Capacity
Guest Capacity Insights for Cabanatuan
- The most common guest capacity trend in Cabanatuan vacation rentals is listings accommodating 2 guests (28.8%). This suggests the primary traveler segment is likely couples or solo travelers.
- Properties designed for 2 guests and 4 guests dominate the Cabanatuan STR market, accounting for 46.6% of listings.
- 23.3% of properties accommodate 6+ guests, serving the market segment for larger families or group travel in Cabanatuan.
- On average, properties in Cabanatuan are equipped to host 3.8 guests.
Cabanatuan Airbnb Booking Patterns (2026): Available vs. Booked Days
Available Days Distribution
Booked Days Distribution
Booking Pattern Insights for Cabanatuan
- The most common availability pattern in Cabanatuan falls within the 271-366 days range, representing 75.3% of listings. This suggests many properties have significant open periods on their calendars.
- Approximately 97.2% of listings show high availability (181+ days open annually), indicating potential for increased bookings or specific owner usage patterns.
- For booked days, the 1-30 days range is most frequent in Cabanatuan (38.4%), reflecting common guest stay durations or potential owner blocking patterns.
- A notable 2.7% of properties secure long booking periods (181+ days booked per year), highlighting successful long-term rental strategies or significant owner usage.
Cabanatuan Airbnb Minimum Stay Requirements Analysis
Distribution of Listings by Minimum Night Requirement
1 Night
70 listings
95.9% of total
2 Nights
2 listings
2.7% of total
30+ Nights
1 listings
1.4% of total
Key Insights
- The most prevalent minimum stay requirement in Cabanatuan is 1 Night, adopted by 95.9% of listings. This highlights the market's preference for shorter, flexible bookings.
- A strong majority (98.6%) of the Cabanatuan Airbnb data shows acceptance of very short stays (1-2 nights), indicating a dynamic, high-turnover market.
- Dedicated monthly rentals (30+ nights) represent a small niche (1.4%), possibly an untapped area for hosts.
Recommendations
- Align with the market by considering a 1 Night minimum stay, as 95.9% of Cabanatuan hosts use this setting.
- Adjust minimum nights based on seasonality – potentially shorter during low season and longer during peak demand periods in Cabanatuan.
Cabanatuan Airbnb Cancellation Policy Trends Analysis (2026)
Limited
6 listings
8.3% of total
Super Strict 60 Days
1 listings
1.4% of total
Flexible
18 listings
25% of total
Moderate
15 listings
20.8% of total
Firm
27 listings
37.5% of total
Strict
5 listings
6.9% of total
Cancellation Policy Insights for Cabanatuan
- The prevailing Airbnb cancellation policy trend in Cabanatuan is Firm, used by 37.5% of listings.
- There's a relatively balanced mix between guest-friendly (45.8%) and stricter (44.4%) policies, offering choices for different guest needs.
- Strict cancellation policies are quite rare (6.9%), potentially making listings with this policy less competitive unless justified by high demand or property type.
Recommendations for Hosts
- Consider adopting a Firm policy to align with the 37.5% market standard in Cabanatuan.
- Using a Strict policy might deter some guests, as only 6.9% of listings use it. Evaluate if potential revenue protection outweighs possible lower booking rates.
- Regularly review your cancellation policy against competitors and market demand shifts in Cabanatuan.
Cabanatuan STR Booking Lead Time Analysis (2026)
Average Booking Lead Time by Month
Booking Lead Time Insights for Cabanatuan
- The overall average booking lead time for vacation rentals in Cabanatuan is 10 days.
- Guests book furthest in advance for stays during October (average 18 days), likely coinciding with peak travel demand or local events.
- The shortest booking windows occur for stays in March (average 7 days), indicating more last-minute travel plans during this time.
- Seasonally, Winter (13 days avg.) sees the longest lead times, while Spring (11 days avg.) has the shortest, reflecting typical travel planning cycles.
Recommendations for Hosts
- Use the overall average lead time (10 days) as a baseline for your pricing and availability strategy in Cabanatuan.
- Target marketing efforts for the Winter season well in advance (at least 13 days) to capture early planners.
- Monitor your own booking lead times against these Cabanatuan averages to identify opportunities for dynamic pricing adjustments.
Popular & Essential Airbnb Amenities in Cabanatuan (2026)
Amenity Prevalence
Amenity Insights for Cabanatuan
- Essential amenities in Cabanatuan that guests expect include: Wifi, Air conditioning, TV. Lacking these (any) could significantly impact bookings.
- Popular amenities like Kitchen, Free parking on premises, Dishes and silverware are common but not universal. Offering these can provide a competitive edge.
Recommendations for Hosts
- Ensure your listing includes all essential amenities for Cabanatuan: Wifi, Air conditioning, TV.
- Prioritize adding missing essentials: TV.
- Consider adding popular differentiators like Kitchen or Free parking on premises to increase appeal.
- Highlight unique or less common amenities you offer (e.g., hot tub, dedicated workspace, EV charger) in your listing description and photos.
- Regularly check competitor amenities in Cabanatuan to stay competitive.
Cabanatuan Airbnb Guest Demographics & Profile Analysis (2026)
Guest Profile Summary for Cabanatuan
- The typical guest profile for Airbnb in Cabanatuan consists of primarily domestic travelers (77%), often arriving from nearby Quezon City, typically belonging to the Post-2000s (Gen Z/Alpha) group (50%), primarily speaking English or Filipino.
- Domestic travelers account for 77.0% of guests.
- Key international markets include Philippines (77%) and United States (6.1%).
- Top languages spoken are English (49.5%) followed by Filipino (18.9%).
- A significant demographic segment is the Post-2000s (Gen Z/Alpha) group, representing 50% of guests.
Recommendations for Hosts
- Target domestic marketing efforts towards travelers from Quezon City and Manila.
- Tailor amenities and listing descriptions to appeal to the dominant Post-2000s (Gen Z/Alpha) demographic (e.g., highlight fast WiFi, smart home features, local guides).
- Highlight unique local experiences or amenities relevant to the primary guest profile.
- Consider seasonal promotions aligned with peak travel times for key origin markets.
Nearby Short-Term Rental Market Comparison
How does the Cabanatuan Airbnb market stack up against its neighbors? Compare key performance metrics like average monthly revenue, ADR, and occupancy rates in surrounding areas to understand the broader regional STR landscape.
| Market | Active Properties | Monthly Revenue | Daily Rate | Avg. Occupancy |
|---|---|---|---|---|
| Bustos | 10 | $1,728 | $216.86 | 28% |
| Cabangan | 44 | $1,529 | $200.94 | 26% |
| Jalajala | 19 | $1,489 | $234.86 | 21% |
| Laoag | 17 | $1,412 | $158.39 | 33% |
| Beneg | 13 | $1,304 | $267.34 | 22% |
| Arew | 11 | $1,288 | $193.81 | 22% |
| Cabuyao | 25 | $1,202 | $114.93 | 36% |
| Binangonan | 49 | $1,191 | $135.12 | 29% |
| Porac | 51 | $1,157 | $203.91 | 21% |
| Los Baños | 158 | $1,129 | $242.23 | 21% |