Roxas Airbnb Market Analysis 2026: Short Term Rental Data & Vacation Rental Statistics in Palawan, Philippines
Is Airbnb profitable in Roxas in 2026? Explore comprehensive Airbnb analytics for Roxas, Palawan, Philippines to uncover income potential. This 2026 STR market report for Roxas, based on AirROI data from February 2025 to January 2026, reveals key trends in the niche market of 107 active listings.
Whether you're considering an Airbnb investment in Roxas, optimizing your existing vacation rental, or exploring rental arbitrage opportunities, understanding the Roxas Airbnb data is crucial. Leveraging the low regulation environment is key to maximizing your short term rental income potential. Let's dive into the specifics.
Key Roxas Airbnb Performance Metrics Overview
Monthly Airbnb Revenue Variations & Income Potential in Roxas (2026)
Understanding the monthly revenue variations for Airbnb listings in Roxas is key to maximizing your short term rental income potential. Seasonality significantly impacts earnings. Our analysis, based on data from the past 12 months, shows that the peak revenue month for STRs in Roxas is typically February, while August often presents the lowest earnings, highlighting opportunities for strategic pricing adjustments during shoulder and low seasons. Explore the typical Airbnb income in Roxas across different performance tiers:
- Best-in-class properties (Top 10%) achieve $1,797+ monthly, often utilizing dynamic pricing and superior guest experiences.
- Strong performing properties (Top 25%) earn $890 or more, indicating effective management and desirable locations/amenities.
- Typical properties (Median) generate around $375 per month, representing the average market performance.
- Entry-level properties (Bottom 25%) see earnings around $169, often with potential for optimization.
Average Monthly Airbnb Earnings Trend in Roxas
Roxas Airbnb Occupancy Rate Trends (2026)
Maximize your bookings by understanding the Roxas STR occupancy trends. Seasonal demand shifts significantly influence how often properties are booked. Typically, Februarysees the highest demand (peak season occupancy), while September experiences the lowest (low season). Effective strategies, like adjusting minimum stays or offering promotions, can boost occupancy during slower periods. Here's how different property tiers perform in Roxas:
- Best-in-class properties (Top 10%) achieve 61%+ occupancy, indicating high desirability and potentially optimized availability.
- Strong performing properties (Top 25%) maintain 45% or higher occupancy, suggesting good market fit and guest satisfaction.
- Typical properties (Median) have an occupancy rate around 27%.
- Entry-level properties (Bottom 25%) average 14% occupancy, potentially facing higher vacancy.
Average Monthly Occupancy Rate Trend in Roxas
Average Daily Rate (ADR) Airbnb Trends in Roxas (2026)
Effective short term rental pricing strategy in Roxas involves understanding monthly ADR fluctuations. The Average Daily Rate (ADR) for Airbnb in Roxas typically peaks in January and dips lowest during July. Leveraging Airbnb dynamic pricing tools or strategies based on this seasonality can significantly boost revenue. Here's a look at the typical nightly rates achieved:
- Best-in-class properties (Top 10%) command rates of $137+ per night, often due to premium features or locations.
- Strong performing properties (Top 25%) achieve nightly rates of $71 or more.
- Typical properties (Median) charge around $44 per night.
- Entry-level properties (Bottom 25%) earn around $29 per night.
Average Daily Rate (ADR) Trend by Month in Roxas
Get Live Roxas Market Intelligence 👇

Explore Real-time Analytics
Airbnb Seasonality Analysis & Trends in Roxas (2026)
Peak Season (February, March, April)
- Revenue averages $1,099 per month
- Occupancy rates average 50.5%
- Daily rates average $65
Shoulder Season
- Revenue averages $718 per month
- Occupancy maintains around 27.1%
- Daily rates hold near $65
Low Season (June, July, August)
- Revenue drops to average $532 per month
- Occupancy decreases to average 19.5%
- Daily rates adjust to average $63
Seasonality Insights for Roxas
- The Airbnb seasonality in Roxas shows highly seasonal trends requiring careful strategy. While the sections above show seasonal averages, it's also insightful to look at the extremes:
- During the high season, the absolute peak month showcases Roxas's highest earning potential, with monthly revenues capable of climbing to $1,182, occupancy reaching a high of 59.4%, and ADRs peaking at $67.
- Conversely, the slowest single month of the year, typically falling within the low season, marks the market's lowest point. In this month, revenue might dip to $495, occupancy could drop to 16.1%, and ADRs may adjust down to $63.
- Understanding both the seasonal averages and these monthly peaks and troughs in revenue, occupancy, and ADR is crucial for maximizing your Airbnb profit potential in Roxas.
Seasonal Strategies for Maximizing Profit
- Peak Season: Maximize revenue through premium pricing and potentially longer minimum stays. Ensure high availability.
- Low Season: Offer competitive pricing, special promotions (e.g., extended stay discounts), and flexible cancellation policies. Target off-season travelers like remote workers or budget-conscious guests.
- Shoulder Seasons: Implement dynamic pricing that balances peak and low rates. Target weekend travelers or specific events. Offer slightly more flexible terms than peak season.
- Regularly analyze your own performance against these Roxas seasonality benchmarks and adjust your pricing and availability strategy accordingly.
Best Areas for Airbnb Investment in Roxas (2026)
Exploring the top neighborhoods for short-term rentals in Roxas? This section highlights key areas, outlining why they are attractive for hosts and guests, along with notable local attractions. Consider these locations based on your target guest profile and investment strategy.
| Neighborhood / Area | Why Host Here? (Target Guests & Appeal) | Key Attractions & Landmarks |
|---|---|---|
| Sabang Beach | Famous for its beautiful beach and close proximity to the Puerto Princesa Subterranean River National Park, a UNESCO World Heritage site. Excellent for tourists looking for natural beauty and adventure activities. | Puerto Princesa Subterranean River National Park, Sabang Beach, Mangrove Forest Tour, Underground River Tour, Zipline Adventure |
| Port Barton | A laid-back coastal village known for its serene beaches and island-hopping tours. Perfect for travelers seeking tranquility and a taste of local culture. | Port Barton Beach, Kuyba Almoneca, Island Hopping Tours, Waterfalls, Local Seafood Restaurants |
| El Nido | Renowned for its stunning limestone cliffs and crystal-clear waters. A prime location for eco-tourism and adventure, attracting backpackers and luxury travelers alike. | El Nido Beach, Bacuit Archipelago, Kayaking, Diving Spots, Snorkeling Tours |
| Coron | Known for its scuba diving and beautiful lagoons. Popular among divers and those seeking picturesque landscapes and vibrant marine life. | Kayangan Lake, Barracuda Lake, Coron Island, Diving Sites, Emperor Suites |
| Cuyo | A lesser-known destination offering a glimpse of local Filipino culture and beautiful, untouched beaches. Great for travelers looking for off-the-beaten-path experiences. | Cuyo Island Beaches, Local Festivals, Mangrove Tours, Cultural Heritage Sites |
| San Vicente | Boasting the longest beach in the Philippines, San Vicente is developing as a prime tourist spot with opportunities for nature adventures and relaxation. | Long Beach, Island Hopping, Water Sports, Local Food Scene, Ecotourism |
| Roxas Town Proper | The town center of Roxas, offering a mix of local charm, accessibility to services, and proximity to attractions. Ideal for budget travelers and those seeking local experiences. | Local Markets, Roxas Church, Cultural Sites, Local Cuisine, Festivals |
| Ocampo Beach | A serene and less crowded beach area perfect for those looking to unwind away from tourist hotspots. Great for intimate family getaways and nature appreciation. | Ocampo Beach, Snorkeling, Local Fishing Villages, Cultural Experiences |
Understanding Airbnb License Requirements & STR Laws in Roxas (2026)
While Roxas, Palawan, Philippines currently shows low STR regulations, specific Airbnb license requirements might still exist or change. Always verify the latest short term rental regulations and Airbnb license requirements directly with local government authorities for Roxas to ensure full compliance before hosting.
(Source: AirROI data, 2026, finding no licensed listings among those analyzed)
Top Performing Airbnb Properties in Roxas (2026)
Benchmark your potential! Explore examples of top-performing Airbnb properties in Roxasbased on Trailing Twelve Month (TTM) revenue. Analyze their characteristics, revenue, occupancy rate, and ADR to understand what drives success in this market.
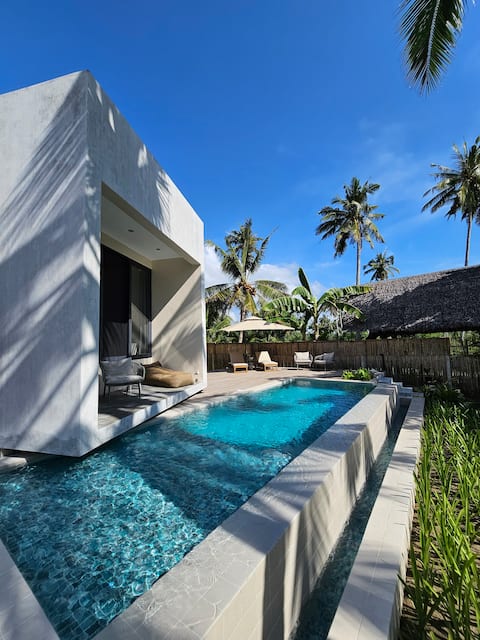
Tropical Nordic Pool Villa in Roxas, Palawan
Entire Place • 1 bedroom
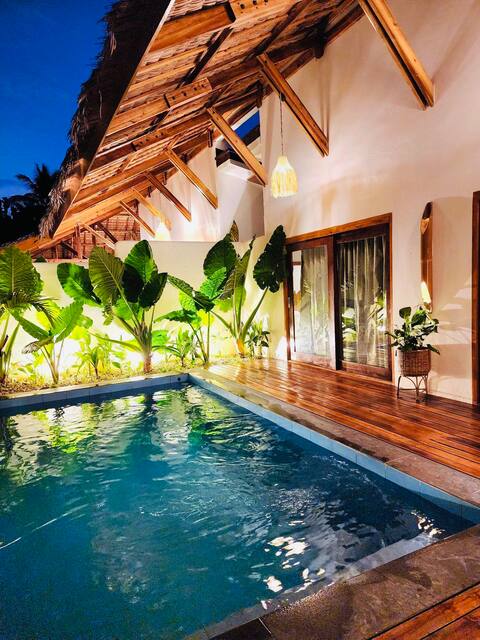
Yumi Villas
Entire Place • 2 bedrooms

Gilligans Port Barton Palawan.
Entire Place • 3 bedrooms

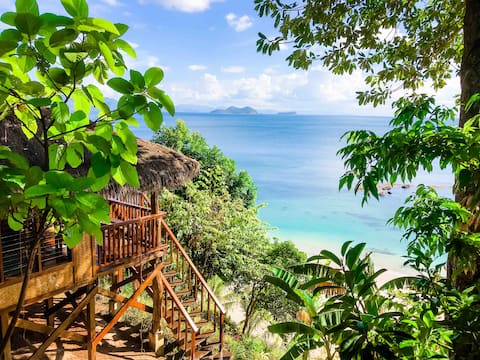
Romantic Jungle Cottage in a Secluded Beach Cove
Entire Place • 1 bedroom

Beachfront, quiet, secluded, stunning views
Entire Place • 2 bedrooms
Private Beach Getaway In a Secluded Cove- Palawan
Entire Place • 3 bedrooms
Note: Performance varies based on location, size, amenities, seasonality, and management quality. Data reflects the past 12 months.
Top Performing Airbnb Hosts in Roxas (2026)
Learn from the best! This table showcases top-performing Airbnb hosts in Roxas based on the number of properties managed and estimated total revenue over the past year. Analyze their scale and performance metrics.
| Host Name | Properties | Grossing Revenue | Stay Reviews | Avg Rating |
|---|---|---|---|---|
| Anton | 1 | $57,749 | 15 | 4.93/5.0 |
| Charity | 3 | $57,697 | 93 | 4.83/5.0 |
| Thoreen Deniega | 3 | $42,871 | 75 | 4.83/5.0 |
| Sandy | 6 | $42,366 | 75 | 4.86/5.0 |
| Yumi | 1 | $38,020 | 75 | 4.85/5.0 |
| Benferly | 2 | $36,121 | 104 | 4.87/5.0 |
| Mich | 1 | $35,969 | 29 | 4.93/5.0 |
| Royal Suites | 4 | $28,879 | 43 | 4.85/5.0 |
| Monika | 2 | $26,901 | 62 | 4.92/5.0 |
| Ruth | 1 | $19,033 | 109 | 4.82/5.0 |
Analyzing the strategies of top hosts, such as their property selection, pricing, and guest communication, can offer valuable lessons for optimizing your own Airbnb operations in Roxas.
Dive Deeper: Advanced Roxas STR Market Data (2026)
Ready to unlock more insights? AirROI provides access to advanced metrics and comprehensive Airbnb data for Roxas. Explore detailed analytics beyond this report to refine your investment strategy, optimize pricing, and maximize your vacation rental profits.
Explore Advanced MetricsRoxas Short-Term Rental Market Composition (2026): Property & Room Types
Room Type Distribution
Property Type Distribution
Market Composition Insights for Roxas
- The Roxas Airbnb market composition is heavily skewed towards Private Room listings, which make up 63.6% of the 107 active rentals. This indicates strong guest preference for privacy and space.
- Looking at the property type distribution in Roxas, Hotel/Boutique properties are the most common (43%), reflecting the local real estate landscape.
- Houses represent a significant 30.8% portion, catering likely to families or larger groups.
- The presence of 43% Hotel/Boutique listings indicates integration with traditional hospitality.
- Smaller segments like others (combined 1.9%) offer potential for unique stay experiences.
Roxas Airbnb Room Capacity Analysis (2026): Bedroom Distribution
Distribution of Listings by Number of Bedrooms
Room Capacity Insights for Roxas
- The dominant room capacity in Roxas is 1 bedroom listings, making up 60.7% of the market. This suggests a strong demand for properties suitable for couples or solo travelers.
- Together, 1 bedroom and 2 bedrooms properties represent 71.9% of the active Airbnb listings in Roxas, indicating a high concentration in these sizes.
- With over half the market (60.7%) consisting of studios or 1-bedroom units, Roxas is particularly well-suited for individuals or couples.
Roxas Vacation Rental Guest Capacity Trends (2026)
Distribution of Listings by Guest Capacity
Guest Capacity Insights for Roxas
- The most common guest capacity trend in Roxas vacation rentals is listings accommodating 2 guests (44.9%). This suggests the primary traveler segment is likely couples or solo travelers.
- Properties designed for 2 guests and 4 guests dominate the Roxas STR market, accounting for 60.8% of listings.
- A significant 44.9% of listings cater specifically to 1-2 guests, highlighting strong demand from couples and solo travelers in Roxas.
- 13.9% of properties accommodate 6+ guests, serving the market segment for larger families or group travel in Roxas.
- On average, properties in Roxas are equipped to host 2.8 guests.
Roxas Airbnb Booking Patterns (2026): Available vs. Booked Days
Available Days Distribution
Booked Days Distribution
Booking Pattern Insights for Roxas
- The most common availability pattern in Roxas falls within the 271-366 days range, representing 68.2% of listings. This suggests many properties have significant open periods on their calendars.
- Approximately 93.4% of listings show high availability (181+ days open annually), indicating potential for increased bookings or specific owner usage patterns.
- For booked days, the 31-90 days range is most frequent in Roxas (40.2%), reflecting common guest stay durations or potential owner blocking patterns.
- A notable 6.5% of properties secure long booking periods (181+ days booked per year), highlighting successful long-term rental strategies or significant owner usage.
Roxas Airbnb Minimum Stay Requirements Analysis
Distribution of Listings by Minimum Night Requirement
1 Night
86 listings
80.4% of total
2 Nights
13 listings
12.1% of total
3 Nights
3 listings
2.8% of total
4-6 Nights
1 listings
0.9% of total
30+ Nights
4 listings
3.7% of total
Key Insights
- The most prevalent minimum stay requirement in Roxas is 1 Night, adopted by 80.4% of listings. This highlights the market's preference for shorter, flexible bookings.
- A strong majority (92.5%) of the Roxas Airbnb data shows acceptance of very short stays (1-2 nights), indicating a dynamic, high-turnover market.
Recommendations
- Align with the market by considering a 1 Night minimum stay, as 80.4% of Roxas hosts use this setting.
- Adjust minimum nights based on seasonality – potentially shorter during low season and longer during peak demand periods in Roxas.
Roxas Airbnb Cancellation Policy Trends Analysis (2026)
Limited
1 listings
0.9% of total
Flexible
38 listings
35.8% of total
Moderate
32 listings
30.2% of total
Firm
34 listings
32.1% of total
Strict
1 listings
0.9% of total
Cancellation Policy Insights for Roxas
- The prevailing Airbnb cancellation policy trend in Roxas is Flexible, used by 35.8% of listings.
- There's a relatively balanced mix between guest-friendly (66.0%) and stricter (33.0%) policies, offering choices for different guest needs.
- Strict cancellation policies are quite rare (0.9%), potentially making listings with this policy less competitive unless justified by high demand or property type.
Recommendations for Hosts
- Consider adopting a Flexible policy to align with the 35.8% market standard in Roxas.
- Using a Strict policy might deter some guests, as only 0.9% of listings use it. Evaluate if potential revenue protection outweighs possible lower booking rates.
- Regularly review your cancellation policy against competitors and market demand shifts in Roxas.
Roxas STR Booking Lead Time Analysis (2026)
Average Booking Lead Time by Month
Booking Lead Time Insights for Roxas
- The overall average booking lead time for vacation rentals in Roxas is 37 days.
- Guests book furthest in advance for stays during January (average 60 days), likely coinciding with peak travel demand or local events.
- The shortest booking windows occur for stays in June (average 24 days), indicating more last-minute travel plans during this time.
- Seasonally, Winter (50 days avg.) sees the longest lead times, while Summer (35 days avg.) has the shortest, reflecting typical travel planning cycles.
Recommendations for Hosts
- Use the overall average lead time (37 days) as a baseline for your pricing and availability strategy in Roxas.
- For January stays, consider implementing length-of-stay discounts or slightly higher rates for bookings made less than 60 days out to capitalize on advance planning.
- Target marketing efforts for the Winter season well in advance (at least 50 days) to capture early planners.
- Monitor your own booking lead times against these Roxas averages to identify opportunities for dynamic pricing adjustments.
Popular & Essential Airbnb Amenities in Roxas (2026)
Amenity Prevalence
Amenity Insights for Roxas
- Popular amenities like Free parking on premises, Fire extinguisher, Wifi are common but not universal. Offering these can provide a competitive edge.
- Warning: Wifi is not universally provided but is considered essential globally. Ensure reliable Wifi is offered.
Recommendations for Hosts
- Consider adding popular differentiators like Free parking on premises or Fire extinguisher to increase appeal.
- Highlight unique or less common amenities you offer (e.g., hot tub, dedicated workspace, EV charger) in your listing description and photos.
- Regularly check competitor amenities in Roxas to stay competitive.
Roxas Airbnb Guest Demographics & Profile Analysis (2026)
Guest Profile Summary for Roxas
- The typical guest profile for Airbnb in Roxas consists of predominantly international visitors (96%), with top international origins including Germany, typically belonging to the Post-2000s (Gen Z/Alpha) group (50%), primarily speaking English or French.
- Domestic travelers account for 4.5% of guests.
- Key international markets include France (16.5%) and Germany (15.5%).
- Top languages spoken are English (43%) followed by French (15.1%).
- A significant demographic segment is the Post-2000s (Gen Z/Alpha) group, representing 50% of guests.
Recommendations for Hosts
- Focus marketing internationally, particularly towards travelers from Germany.
- Tailor amenities and listing descriptions to appeal to the dominant Post-2000s (Gen Z/Alpha) demographic (e.g., highlight fast WiFi, smart home features, local guides).
- Highlight unique local experiences or amenities relevant to the primary guest profile.
- Consider seasonal promotions aligned with peak travel times for key origin markets.
Nearby Short-Term Rental Market Comparison
How does the Roxas Airbnb market stack up against its neighbors? Compare key performance metrics like average monthly revenue, ADR, and occupancy rates in surrounding areas to understand the broader regional STR landscape.
| Market | Active Properties | Monthly Revenue | Daily Rate | Avg. Occupancy |
|---|---|---|---|---|
| El Nido | 571 | $1,350 | $122.65 | 39% |
| Culion | 17 | $1,026 | $106.15 | 32% |
| Puerto Princesa | 433 | $291 | $50.25 | 29% |