Cainta Airbnb Market Analysis 2026: Short Term Rental Data & Vacation Rental Statistics in Rizal, Philippines
Is Airbnb profitable in Cainta in 2026? Explore comprehensive Airbnb analytics for Cainta, Rizal, Philippines to uncover income potential. This 2026 STR market report for Cainta, based on AirROI data from February 2025 to January 2026, reveals key trends in the market of 212 active listings.
Whether you're considering an Airbnb investment in Cainta, optimizing your existing vacation rental, or exploring rental arbitrage opportunities, understanding the Cainta Airbnb data is crucial. Leveraging the low regulation environment is key to maximizing your short term rental income potential. Let's dive into the specifics.
Key Cainta Airbnb Performance Metrics Overview
Monthly Airbnb Revenue Variations & Income Potential in Cainta (2026)
Understanding the monthly revenue variations for Airbnb listings in Cainta is key to maximizing your short term rental income potential. Seasonality significantly impacts earnings. Our analysis, based on data from the past 12 months, shows that the peak revenue month for STRs in Cainta is typically December, while July often presents the lowest earnings, highlighting opportunities for strategic pricing adjustments during shoulder and low seasons. Explore the typical Airbnb income in Cainta across different performance tiers:
- Best-in-class properties (Top 10%) achieve $828+ monthly, often utilizing dynamic pricing and superior guest experiences.
- Strong performing properties (Top 25%) earn $511 or more, indicating effective management and desirable locations/amenities.
- Typical properties (Median) generate around $261 per month, representing the average market performance.
- Entry-level properties (Bottom 25%) see earnings around $106, often with potential for optimization.
Average Monthly Airbnb Earnings Trend in Cainta
Cainta Airbnb Occupancy Rate Trends (2026)
Maximize your bookings by understanding the Cainta STR occupancy trends. Seasonal demand shifts significantly influence how often properties are booked. Typically, Decembersees the highest demand (peak season occupancy), while July experiences the lowest (low season). Effective strategies, like adjusting minimum stays or offering promotions, can boost occupancy during slower periods. Here's how different property tiers perform in Cainta:
- Best-in-class properties (Top 10%) achieve 68%+ occupancy, indicating high desirability and potentially optimized availability.
- Strong performing properties (Top 25%) maintain 45% or higher occupancy, suggesting good market fit and guest satisfaction.
- Typical properties (Median) have an occupancy rate around 24%.
- Entry-level properties (Bottom 25%) average 10% occupancy, potentially facing higher vacancy.
Average Monthly Occupancy Rate Trend in Cainta
Average Daily Rate (ADR) Airbnb Trends in Cainta (2026)
Effective short term rental pricing strategy in Cainta involves understanding monthly ADR fluctuations. The Average Daily Rate (ADR) for Airbnb in Cainta typically peaks in December and dips lowest during April. Leveraging Airbnb dynamic pricing tools or strategies based on this seasonality can significantly boost revenue. Here's a look at the typical nightly rates achieved:
- Best-in-class properties (Top 10%) command rates of $50+ per night, often due to premium features or locations.
- Strong performing properties (Top 25%) achieve nightly rates of $39 or more.
- Typical properties (Median) charge around $32 per night.
- Entry-level properties (Bottom 25%) earn around $25 per night.
Average Daily Rate (ADR) Trend by Month in Cainta
Get Live Cainta Market Intelligence 👇

Explore Real-time Analytics
Airbnb Seasonality Analysis & Trends in Cainta (2026)
Peak Season (December, April, March)
- Revenue averages $496 per month
- Occupancy rates average 36.0%
- Daily rates average $41
Shoulder Season
- Revenue averages $411 per month
- Occupancy maintains around 30.1%
- Daily rates hold near $42
Low Season (January, July, August)
- Revenue drops to average $357 per month
- Occupancy decreases to average 26.7%
- Daily rates adjust to average $42
Seasonality Insights for Cainta
- The Airbnb seasonality in Cainta shows moderate seasonality with distinct peak and low periods. While the sections above show seasonal averages, it's also insightful to look at the extremes:
- During the high season, the absolute peak month showcases Cainta's highest earning potential, with monthly revenues capable of climbing to $549, occupancy reaching a high of 37.2%, and ADRs peaking at $42.
- Conversely, the slowest single month of the year, typically falling within the low season, marks the market's lowest point. In this month, revenue might dip to $344, occupancy could drop to 25.8%, and ADRs may adjust down to $40.
- Understanding both the seasonal averages and these monthly peaks and troughs in revenue, occupancy, and ADR is crucial for maximizing your Airbnb profit potential in Cainta.
Seasonal Strategies for Maximizing Profit
- Peak Season: Maximize revenue through premium pricing and potentially longer minimum stays. Ensure high availability.
- Low Season: Offer competitive pricing, special promotions (e.g., extended stay discounts), and flexible cancellation policies. Target off-season travelers like remote workers or budget-conscious guests.
- Shoulder Seasons: Implement dynamic pricing that balances peak and low rates. Target weekend travelers or specific events. Offer slightly more flexible terms than peak season.
- Regularly analyze your own performance against these Cainta seasonality benchmarks and adjust your pricing and availability strategy accordingly.
Best Areas for Airbnb Investment in Cainta (2026)
Exploring the top neighborhoods for short-term rentals in Cainta? This section highlights key areas, outlining why they are attractive for hosts and guests, along with notable local attractions. Consider these locations based on your target guest profile and investment strategy.
| Neighborhood / Area | Why Host Here? (Target Guests & Appeal) | Key Attractions & Landmarks |
|---|---|---|
| San Juan | A bustling area with good accessibility to Metro Manila and various amenities. Attractive for both tourists and locals seeking a suburban experience close to the city. | SM City San Juan, Greenhills Shopping Center, Taoist Temple, San Juan National High School, Pinaglabanan Shrine |
| Barangay San Isidro | Known for its residential vibe, this area is becoming popular for people seeking homey accommodations. It's ideal for families visiting the numerous schools and parks nearby. | San Isidro Labrador Church, Buhay Na Tubig Park, Twin Lakes Resort, Mercato Centrale Cainta, Cainta Greenfield |
| Cainta Green Park | A residential hotspot with parks and recreational areas, appealing to families and groups looking for short-term stays with access to nature. | Cainta Green Park, Greenfield District, Shopwise Cainta, Cainta Church, Cainta Public Market |
| Ortigas Extension | A main thoroughfare leading into the business district of Ortigas, perfect for business travelers seeking short-term lodgings near offices and malls. | SM City Taytay, Robinsons Metro East, Ortigas Center, Tiendesitas, Emerald Avenue |
| Pasig-Cainta Border | This area is strategically located between two cities, making it a desirable destination for locals and tourists accessing various attractions in Pasig. | Pasig Cathedral, Rizal Technological University, Julia Vargas Avenue, Capitol Commons, Dela Rosa Park |
| Cainta Town Center | The historical center of Cainta with easy access to local landmarks, popular amongst visitors looking to explore local culture and heritage. | Cainta Rizal's Old Town, Cainta Church, Municipal Hall of Cainta, Local street food stalls, Rizal Shrine |
| Santolan | A serene residential area that attracts visitors seeking a quieter place while still being close to major urban centers and conveniences. | Santolan Town Plaza, Loyola Memorial Park, Concepcion Aguila, St. Paul College Pasig, The Grove by Rockwell |
| Brgy. Dolores | A neighborhood that provides a mix of local charm and proximity to commercial establishments, ideal for visitors who enjoy a more laid-back atmosphere. | Dolores Park, St. John the Evangelist Church, Shops and Cafes along E. Rodriguez Ave, Local markets, Poverty Alleviation Center |
Understanding Airbnb License Requirements & STR Laws in Cainta (2026)
While Cainta, Rizal, Philippines currently shows low STR regulations, specific Airbnb license requirements might still exist or change. Always verify the latest short term rental regulations and Airbnb license requirements directly with local government authorities for Cainta to ensure full compliance before hosting.
(Source: AirROI data, 2026, based on 0% licensed listings)
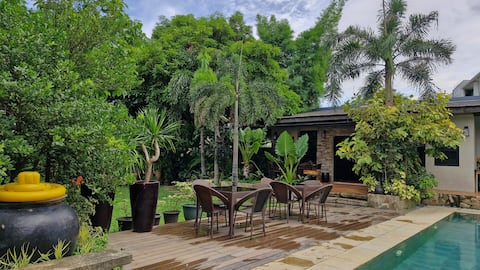
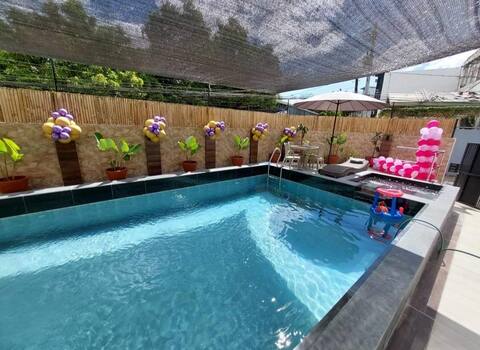
Top Performing Airbnb Properties in Cainta (2026)
Benchmark your potential! Explore examples of top-performing Airbnb properties in Caintabased on Trailing Twelve Month (TTM) revenue. Analyze their characteristics, revenue, occupancy rate, and ADR to understand what drives success in this market.

Stylish Villa with Heated Pool
Entire Place • 3 bedrooms

Private Villa with Pool Oasis in Cainta
Entire Place • 4 bedrooms

Nazville Vacation Home
Entire Place • N/A
Hidden Garden near the Metro
Entire Place • 4 bedrooms

Casa Mi Hijas Private Resort w/ Pool | Sleeps 15
Entire Place • 3 bedrooms
Villa in Cainta, Rizal
Entire Place • 3 bedrooms
Note: Performance varies based on location, size, amenities, seasonality, and management quality. Data reflects the past 12 months.
Top Performing Airbnb Hosts in Cainta (2026)
Learn from the best! This table showcases top-performing Airbnb hosts in Cainta based on the number of properties managed and estimated total revenue over the past year. Analyze their scale and performance metrics.
| Host Name | Properties | Grossing Revenue | Stay Reviews | Avg Rating |
|---|---|---|---|---|
| Michael | 1 | $51,619 | 58 | 5.00/5.0 |
| Rafael | 1 | $38,073 | 83 | 4.72/5.0 |
| Tiniel | 1 | $26,140 | 14 | 4.79/5.0 |
| Darren Andrei | 1 | $22,777 | 21 | 4.90/5.0 |
| Ivan | 3 | $20,689 | 453 | 4.96/5.0 |
| Cheryl | 1 | $18,845 | 10 | 5.00/5.0 |
| Charm | 1 | $17,672 | 5 | 4.80/5.0 |
| Ma Janice | 4 | $17,336 | 163 | 4.96/5.0 |
| Linda | 1 | $15,090 | 22 | 4.91/5.0 |
| Cyra | 5 | $14,324 | 103 | 4.78/5.0 |
Analyzing the strategies of top hosts, such as their property selection, pricing, and guest communication, can offer valuable lessons for optimizing your own Airbnb operations in Cainta.
Dive Deeper: Advanced Cainta STR Market Data (2026)
Ready to unlock more insights? AirROI provides access to advanced metrics and comprehensive Airbnb data for Cainta. Explore detailed analytics beyond this report to refine your investment strategy, optimize pricing, and maximize your vacation rental profits.
Explore Advanced MetricsCainta Short-Term Rental Market Composition (2026): Property & Room Types
Room Type Distribution
Property Type Distribution
Market Composition Insights for Cainta
- The Cainta Airbnb market composition is heavily skewed towards Entire Home/Apt listings, which make up 90.1% of the 212 active rentals. This indicates strong guest preference for privacy and space.
- Looking at the property type distribution in Cainta, Apartment/Condo properties are the most common (84%), reflecting the local real estate landscape.
- Smaller segments like hotel/boutique, others, unique stays (combined 7.1%) offer potential for unique stay experiences.
Cainta Airbnb Room Capacity Analysis (2026): Bedroom Distribution
Distribution of Listings by Number of Bedrooms
Room Capacity Insights for Cainta
- The dominant room capacity in Cainta is 1 bedroom listings, making up 42.9% of the market. This suggests a strong demand for properties suitable for couples or solo travelers.
- Together, 1 bedroom and 2 bedrooms properties represent 80.6% of the active Airbnb listings in Cainta, indicating a high concentration in these sizes.
- Listings with 3+ bedrooms (5.7%) represent a smaller niche, potentially indicating an underserved market for larger group accommodations in Cainta.
Cainta Vacation Rental Guest Capacity Trends (2026)
Distribution of Listings by Guest Capacity
Guest Capacity Insights for Cainta
- The most common guest capacity trend in Cainta vacation rentals is listings accommodating 4 guests (35.4%). This suggests the primary traveler segment is likely small families or groups.
- Properties designed for 4 guests and 2 guests dominate the Cainta STR market, accounting for 61.8% of listings.
- 15.0% of properties accommodate 6+ guests, serving the market segment for larger families or group travel in Cainta.
- On average, properties in Cainta are equipped to host 3.8 guests.
Cainta Airbnb Booking Patterns (2026): Available vs. Booked Days
Available Days Distribution
Booked Days Distribution
Booking Pattern Insights for Cainta
- The most common availability pattern in Cainta falls within the 271-366 days range, representing 68.9% of listings. This suggests many properties have significant open periods on their calendars.
- Approximately 91.5% of listings show high availability (181+ days open annually), indicating potential for increased bookings or specific owner usage patterns.
- For booked days, the 1-30 days range is most frequent in Cainta (34.4%), reflecting common guest stay durations or potential owner blocking patterns.
- A notable 9.0% of properties secure long booking periods (181+ days booked per year), highlighting successful long-term rental strategies or significant owner usage.
Cainta Airbnb Minimum Stay Requirements Analysis
Distribution of Listings by Minimum Night Requirement
1 Night
170 listings
80.2% of total
2 Nights
11 listings
5.2% of total
3 Nights
4 listings
1.9% of total
4-6 Nights
6 listings
2.8% of total
7-29 Nights
4 listings
1.9% of total
30+ Nights
17 listings
8% of total
Key Insights
- The most prevalent minimum stay requirement in Cainta is 1 Night, adopted by 80.2% of listings. This highlights the market's preference for shorter, flexible bookings.
- A strong majority (85.4%) of the Cainta Airbnb data shows acceptance of very short stays (1-2 nights), indicating a dynamic, high-turnover market.
Recommendations
- Align with the market by considering a 1 Night minimum stay, as 80.2% of Cainta hosts use this setting.
- Explore offering discounts for stays of 30+ nights to attract the 8% of the market seeking extended stays.
- Adjust minimum nights based on seasonality – potentially shorter during low season and longer during peak demand periods in Cainta.
Cainta Airbnb Cancellation Policy Trends Analysis (2026)
Limited
9 listings
4.2% of total
Flexible
87 listings
41% of total
Moderate
44 listings
20.8% of total
Firm
55 listings
25.9% of total
Strict
17 listings
8% of total
Cancellation Policy Insights for Cainta
- The prevailing Airbnb cancellation policy trend in Cainta is Flexible, used by 41% of listings.
- There's a relatively balanced mix between guest-friendly (61.8%) and stricter (33.9%) policies, offering choices for different guest needs.
- Strict cancellation policies are quite rare (8%), potentially making listings with this policy less competitive unless justified by high demand or property type.
Recommendations for Hosts
- Consider adopting a Flexible policy to align with the 41% market standard in Cainta.
- Using a Strict policy might deter some guests, as only 8% of listings use it. Evaluate if potential revenue protection outweighs possible lower booking rates.
- Regularly review your cancellation policy against competitors and market demand shifts in Cainta.
Cainta STR Booking Lead Time Analysis (2026)
Average Booking Lead Time by Month
Booking Lead Time Insights for Cainta
- The overall average booking lead time for vacation rentals in Cainta is 15 days.
- Guests book furthest in advance for stays during December (average 20 days), likely coinciding with peak travel demand or local events.
- The shortest booking windows occur for stays in March (average 10 days), indicating more last-minute travel plans during this time.
- Seasonally, Winter (17 days avg.) sees the longest lead times, while Spring (14 days avg.) has the shortest, reflecting typical travel planning cycles.
Recommendations for Hosts
- Use the overall average lead time (15 days) as a baseline for your pricing and availability strategy in Cainta.
- Target marketing efforts for the Winter season well in advance (at least 17 days) to capture early planners.
- Monitor your own booking lead times against these Cainta averages to identify opportunities for dynamic pricing adjustments.
Popular & Essential Airbnb Amenities in Cainta (2026)
Amenity Prevalence
Amenity Insights for Cainta
- Essential amenities in Cainta that guests expect include: Air conditioning, Wifi, TV, Kitchen. Lacking these (any) could significantly impact bookings.
- Popular amenities like Dishes and silverware, Smoke alarm, Refrigerator are common but not universal. Offering these can provide a competitive edge.
Recommendations for Hosts
- Ensure your listing includes all essential amenities for Cainta: Air conditioning, Wifi, TV, Kitchen.
- Prioritize adding missing essentials: Air conditioning, Wifi, TV, Kitchen.
- Consider adding popular differentiators like Dishes and silverware or Smoke alarm to increase appeal.
- Highlight unique or less common amenities you offer (e.g., hot tub, dedicated workspace, EV charger) in your listing description and photos.
- Regularly check competitor amenities in Cainta to stay competitive.
Cainta Airbnb Guest Demographics & Profile Analysis (2026)
Guest Profile Summary for Cainta
- The typical guest profile for Airbnb in Cainta consists of primarily domestic travelers (83%), often arriving from nearby Quezon City, typically belonging to the Post-2000s (Gen Z/Alpha) group (50%), primarily speaking English or Tagalog.
- Domestic travelers account for 83.1% of guests.
- Key international markets include Philippines (83.1%) and United States (5.3%).
- Top languages spoken are English (52.3%) followed by Tagalog (21.4%).
- A significant demographic segment is the Post-2000s (Gen Z/Alpha) group, representing 50% of guests.
Recommendations for Hosts
- Target domestic marketing efforts towards travelers from Quezon City and Pasig.
- Tailor amenities and listing descriptions to appeal to the dominant Post-2000s (Gen Z/Alpha) demographic (e.g., highlight fast WiFi, smart home features, local guides).
- Highlight unique local experiences or amenities relevant to the primary guest profile.
- Consider seasonal promotions aligned with peak travel times for key origin markets.
Nearby Short-Term Rental Market Comparison
How does the Cainta Airbnb market stack up against its neighbors? Compare key performance metrics like average monthly revenue, ADR, and occupancy rates in surrounding areas to understand the broader regional STR landscape.
| Market | Active Properties | Monthly Revenue | Daily Rate | Avg. Occupancy |
|---|---|---|---|---|
| Bustos | 10 | $1,728 | $216.86 | 28% |
| Cabangan | 44 | $1,529 | $200.94 | 26% |
| Lian | 121 | $1,491 | $216.20 | 24% |
| Jalajala | 19 | $1,489 | $234.86 | 21% |
| Laoag | 17 | $1,412 | $158.39 | 33% |
| Beneg | 13 | $1,304 | $267.34 | 22% |
| Arew | 11 | $1,288 | $193.81 | 22% |
| Cabuyao | 25 | $1,202 | $114.93 | 36% |
| Binangonan | 49 | $1,191 | $135.12 | 29% |
| Porac | 51 | $1,157 | $203.91 | 21% |