Jalajala Airbnb Market Analysis 2026: Short Term Rental Data & Vacation Rental Statistics in Rizal, Philippines
Is Airbnb profitable in Jalajala in 2026? Explore comprehensive Airbnb analytics for Jalajala, Rizal, Philippines to uncover income potential. This 2026 STR market report for Jalajala, based on AirROI data from February 2025 to January 2026, reveals key trends in the niche market of 19 active listings.
Whether you're considering an Airbnb investment in Jalajala, optimizing your existing vacation rental, or exploring rental arbitrage opportunities, understanding the Jalajala Airbnb data is crucial. Leveraging the low regulation environment is key to maximizing your short term rental income potential. Let's dive into the specifics.
Key Jalajala Airbnb Performance Metrics Overview
Monthly Airbnb Revenue Variations & Income Potential in Jalajala (2026)
Understanding the monthly revenue variations for Airbnb listings in Jalajala is key to maximizing your short term rental income potential. Seasonality significantly impacts earnings. Our analysis, based on data from the past 12 months, shows that the peak revenue month for STRs in Jalajala is typically December, while September often presents the lowest earnings, highlighting opportunities for strategic pricing adjustments during shoulder and low seasons. Explore the typical Airbnb income in Jalajala across different performance tiers:
- Best-in-class properties (Top 10%) achieve $5,955+ monthly, often utilizing dynamic pricing and superior guest experiences.
- Strong performing properties (Top 25%) earn $1,997 or more, indicating effective management and desirable locations/amenities.
- Typical properties (Median) generate around $813 per month, representing the average market performance.
- Entry-level properties (Bottom 25%) see earnings around $491, often with potential for optimization.
Average Monthly Airbnb Earnings Trend in Jalajala
Jalajala Airbnb Occupancy Rate Trends (2026)
Maximize your bookings by understanding the Jalajala STR occupancy trends. Seasonal demand shifts significantly influence how often properties are booked. Typically, Aprilsees the highest demand (peak season occupancy), while September experiences the lowest (low season). Effective strategies, like adjusting minimum stays or offering promotions, can boost occupancy during slower periods. Here's how different property tiers perform in Jalajala:
- Best-in-class properties (Top 10%) achieve 52%+ occupancy, indicating high desirability and potentially optimized availability.
- Strong performing properties (Top 25%) maintain 27% or higher occupancy, suggesting good market fit and guest satisfaction.
- Typical properties (Median) have an occupancy rate around 15%.
- Entry-level properties (Bottom 25%) average 9% occupancy, potentially facing higher vacancy.
Average Monthly Occupancy Rate Trend in Jalajala
Average Daily Rate (ADR) Airbnb Trends in Jalajala (2026)
Effective short term rental pricing strategy in Jalajala involves understanding monthly ADR fluctuations. The Average Daily Rate (ADR) for Airbnb in Jalajala typically peaks in January and dips lowest during April. Leveraging Airbnb dynamic pricing tools or strategies based on this seasonality can significantly boost revenue. Here's a look at the typical nightly rates achieved:
- Best-in-class properties (Top 10%) command rates of $414+ per night, often due to premium features or locations.
- Strong performing properties (Top 25%) achieve nightly rates of $331 or more.
- Typical properties (Median) charge around $218 per night.
- Entry-level properties (Bottom 25%) earn around $152 per night.
Average Daily Rate (ADR) Trend by Month in Jalajala
Get Live Jalajala Market Intelligence 👇

Explore Real-time Analytics
Airbnb Seasonality Analysis & Trends in Jalajala (2026)
Peak Season (December, April, June)
- Revenue averages $2,490 per month
- Occupancy rates average 29.6%
- Daily rates average $241
Shoulder Season
- Revenue averages $1,834 per month
- Occupancy maintains around 21.4%
- Daily rates hold near $241
Low Season (August, September, October)
- Revenue drops to average $1,343 per month
- Occupancy decreases to average 13.8%
- Daily rates adjust to average $243
Seasonality Insights for Jalajala
- The Airbnb seasonality in Jalajala shows highly seasonal trends requiring careful strategy. While the sections above show seasonal averages, it's also insightful to look at the extremes:
- During the high season, the absolute peak month showcases Jalajala's highest earning potential, with monthly revenues capable of climbing to $2,806, occupancy reaching a high of 32.8%, and ADRs peaking at $252.
- Conversely, the slowest single month of the year, typically falling within the low season, marks the market's lowest point. In this month, revenue might dip to $1,067, occupancy could drop to 11.6%, and ADRs may adjust down to $230.
- Understanding both the seasonal averages and these monthly peaks and troughs in revenue, occupancy, and ADR is crucial for maximizing your Airbnb profit potential in Jalajala.
Seasonal Strategies for Maximizing Profit
- Peak Season: Maximize revenue through premium pricing and potentially longer minimum stays. Ensure high availability.
- Low Season: Offer competitive pricing, special promotions (e.g., extended stay discounts), and flexible cancellation policies. Target off-season travelers like remote workers or budget-conscious guests.
- Shoulder Seasons: Implement dynamic pricing that balances peak and low rates. Target weekend travelers or specific events. Offer slightly more flexible terms than peak season.
- Regularly analyze your own performance against these Jalajala seasonality benchmarks and adjust your pricing and availability strategy accordingly.
Best Areas for Airbnb Investment in Jalajala (2026)
Exploring the top neighborhoods for short-term rentals in Jalajala? This section highlights key areas, outlining why they are attractive for hosts and guests, along with notable local attractions. Consider these locations based on your target guest profile and investment strategy.
| Neighborhood / Area | Why Host Here? (Target Guests & Appeal) | Key Attractions & Landmarks |
|---|---|---|
| Pulong Bunga | A serene location near nature with rivers and scenic views, ideal for vacationers looking for relaxation away from the city hustle. | Jalajala River, Mount Talamitam, Local coffee shops, Eco-resorts, Nature trails |
| Dolorito | Known for its peaceful ambiance and access to natural hot springs, this area attracts visitors seeking wellness and relaxation. | Local hot springs, Nature retreats, Hiking trails, Farm stays, Cultural experiences |
| San Juan | A vibrant community with access to beach resorts and water activities, perfect for families and adventure seekers. | Beachfront resorts, Water sports, Local seafood cuisine, Fishing spots, Night markets |
| Poblacion | The town center with access to local markets, nightlife, and cultural heritage, a great spot for both tourists and locals. | Local markets, Cultural festivals, Historic landmarks, Restaurants and bars, Community events |
| Lumban | Known for its scenic lake and outdoor activities, attractive to nature lovers and tourist groups. | Lake Laguna, Water activities, Outdoor sports, Picnic spots, Local handicrafts |
| Puting Bato | Famous for its beautiful sandy beaches and diving spots, it draws in beachgoers and marine enthusiasts. | Scuba diving spots, Beach resorts, Sunbathing areas, Local beach parties, Marine life tours |
| Binangonan | A nearby town offering a mix of cultural history and natural parks, appealing for a quieter stay yet close to urban amenities. | Binangonan Church, Art galleries, Cultural parks, Local eateries, Scenic views of the mountains |
| Masanag | Offering a secluded and tranquil environment with picturesque landscapes, ideal for couples and individuals looking for peace. | Tranquil landscapes, Local farms, Hiking trails, Bird watching, Nature photography spots |
Understanding Airbnb License Requirements & STR Laws in Jalajala (2026)
While Jalajala, Rizal, Philippines currently shows low STR regulations, specific Airbnb license requirements might still exist or change. Always verify the latest short term rental regulations and Airbnb license requirements directly with local government authorities for Jalajala to ensure full compliance before hosting.
(Source: AirROI data, 2026, finding no licensed listings among those analyzed)
Top Performing Airbnb Properties in Jalajala (2026)
Benchmark your potential! Explore examples of top-performing Airbnb properties in Jalajalabased on Trailing Twelve Month (TTM) revenue. Analyze their characteristics, revenue, occupancy rate, and ADR to understand what drives success in this market.

Farmhouse w/ Pool, ATV & Bonfire | Rizal Escape
Entire Place • 4 bedrooms
Pahuwai Lakehouse
Entire Place • 4 bedrooms
Hardin De Rosa - Lumen Villa
Entire Place • 5 bedrooms
Farm place w/ dipping pool & sulfur spring
Entire Place • 2 bedrooms

75 JcK
Entire Place • 3 bedrooms

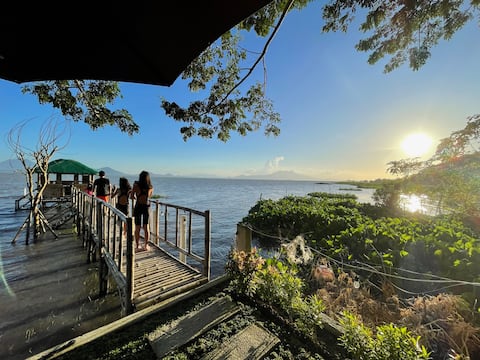
Infinity Pool, Offshore Kubo & Bamboo Walkway
Entire Place • 2 bedrooms
Note: Performance varies based on location, size, amenities, seasonality, and management quality. Data reflects the past 12 months.
Top Performing Airbnb Hosts in Jalajala (2026)
Learn from the best! This table showcases top-performing Airbnb hosts in Jalajala based on the number of properties managed and estimated total revenue over the past year. Analyze their scale and performance metrics.
| Host Name | Properties | Grossing Revenue | Stay Reviews | Avg Rating |
|---|---|---|---|---|
| Sharon | 1 | $92,918 | 86 | 4.87/5.0 |
| Bang | 2 | $70,997 | 13 | 5.00/5.0 |
| Hardin | 2 | $46,756 | 133 | 4.91/5.0 |
| Oscar Jr | 2 | $33,353 | 133 | 4.97/5.0 |
| Jan | 1 | $20,195 | 11 | 4.73/5.0 |
| Katrina | 1 | $19,487 | 19 | 4.95/5.0 |
| Grace Joyce | 2 | $11,689 | 87 | 4.75/5.0 |
| Sam | 1 | $11,042 | 7 | 5.00/5.0 |
| Sunshine | 1 | $6,883 | 1 | Not Rated |
| Ruth Gay | 1 | $6,597 | 45 | 4.87/5.0 |
Analyzing the strategies of top hosts, such as their property selection, pricing, and guest communication, can offer valuable lessons for optimizing your own Airbnb operations in Jalajala.
Dive Deeper: Advanced Jalajala STR Market Data (2026)
Ready to unlock more insights? AirROI provides access to advanced metrics and comprehensive Airbnb data for Jalajala. Explore detailed analytics beyond this report to refine your investment strategy, optimize pricing, and maximize your vacation rental profits.
Explore Advanced MetricsJalajala Short-Term Rental Market Composition (2026): Property & Room Types
Room Type Distribution
Property Type Distribution
Market Composition Insights for Jalajala
- The Jalajala Airbnb market composition is heavily skewed towards Entire Home/Apt listings, which make up 94.7% of the 19 active rentals. This indicates strong guest preference for privacy and space.
- Looking at the property type distribution in Jalajala, House properties are the most common (63.2%), reflecting the local real estate landscape.
- Houses represent a significant 63.2% portion, catering likely to families or larger groups.
- The presence of 5.3% Hotel/Boutique listings indicates integration with traditional hospitality.
Jalajala Airbnb Room Capacity Analysis (2026): Bedroom Distribution
Distribution of Listings by Number of Bedrooms
Room Capacity Insights for Jalajala
- The dominant room capacity in Jalajala is 3 bedrooms listings, making up 47.4% of the market. This suggests a strong demand for properties suitable for families or small groups.
- Together, 3 bedrooms and 2 bedrooms properties represent 79.0% of the active Airbnb listings in Jalajala, indicating a high concentration in these sizes.
- A significant 68.4% of listings offer 3+ bedrooms, catering to larger groups and families seeking more space in Jalajala.
Jalajala Vacation Rental Guest Capacity Trends (2026)
Distribution of Listings by Guest Capacity
Guest Capacity Insights for Jalajala
- The most common guest capacity trend in Jalajala vacation rentals is listings accommodating 8+ guests (100%). This suggests the primary traveler segment is likely larger groups.
- 100.0% of properties accommodate 6+ guests, serving the market segment for larger families or group travel in Jalajala.
- On average, properties in Jalajala are equipped to host 8.0 guests.
Jalajala Airbnb Booking Patterns (2026): Available vs. Booked Days
Available Days Distribution
Booked Days Distribution
Booking Pattern Insights for Jalajala
- The most common availability pattern in Jalajala falls within the 271-366 days range, representing 84.2% of listings. This suggests many properties have significant open periods on their calendars.
- Approximately 94.7% of listings show high availability (181+ days open annually), indicating potential for increased bookings or specific owner usage patterns.
- For booked days, the 31-90 days range is most frequent in Jalajala (73.7%), reflecting common guest stay durations or potential owner blocking patterns.
- A notable 5.3% of properties secure long booking periods (181+ days booked per year), highlighting successful long-term rental strategies or significant owner usage.
Jalajala Airbnb Minimum Stay Requirements Analysis
Distribution of Listings by Minimum Night Requirement
1 Night
18 listings
94.7% of total
30+ Nights
1 listings
5.3% of total
Key Insights
- The most prevalent minimum stay requirement in Jalajala is 1 Night, adopted by 94.7% of listings. This highlights the market's preference for shorter, flexible bookings.
- A strong majority (94.7%) of the Jalajala Airbnb data shows acceptance of very short stays (1-2 nights), indicating a dynamic, high-turnover market.
Recommendations
- Align with the market by considering a 1 Night minimum stay, as 94.7% of Jalajala hosts use this setting.
- Explore offering discounts for stays of 30+ nights to attract the 5.3% of the market seeking extended stays.
- Adjust minimum nights based on seasonality – potentially shorter during low season and longer during peak demand periods in Jalajala.
Jalajala Airbnb Cancellation Policy Trends Analysis (2026)
Flexible
4 listings
21.1% of total
Moderate
2 listings
10.5% of total
Firm
9 listings
47.4% of total
Strict
4 listings
21.1% of total
Cancellation Policy Insights for Jalajala
- The prevailing Airbnb cancellation policy trend in Jalajala is Firm, used by 47.4% of listings.
- A majority (68.5%) of hosts in Jalajala utilize Firm or Strict policies, indicating a market where hosts prioritize booking security.
Recommendations for Hosts
- Consider adopting a Firm policy to align with the 47.4% market standard in Jalajala.
- Regularly review your cancellation policy against competitors and market demand shifts in Jalajala.
Jalajala STR Booking Lead Time Analysis (2026)
Average Booking Lead Time by Month
Booking Lead Time Insights for Jalajala
- The overall average booking lead time for vacation rentals in Jalajala is 29 days.
- Guests book furthest in advance for stays during December (average 78 days), likely coinciding with peak travel demand or local events.
- The shortest booking windows occur for stays in July (average 18 days), indicating more last-minute travel plans during this time.
- Seasonally, Winter (53 days avg.) sees the longest lead times, while Summer (21 days avg.) has the shortest, reflecting typical travel planning cycles.
Recommendations for Hosts
- Use the overall average lead time (29 days) as a baseline for your pricing and availability strategy in Jalajala.
- For December stays, consider implementing length-of-stay discounts or slightly higher rates for bookings made less than 78 days out to capitalize on advance planning.
- Target marketing efforts for the Winter season well in advance (at least 53 days) to capture early planners.
- Monitor your own booking lead times against these Jalajala averages to identify opportunities for dynamic pricing adjustments.
Popular & Essential Airbnb Amenities in Jalajala (2026)
Amenity Prevalence
Amenity Insights for Jalajala
- Essential amenities in Jalajala that guests expect include: Wifi, Free parking on premises, BBQ grill, Air conditioning, Pool. Lacking these (any) could significantly impact bookings.
- Popular amenities like TV, Kitchen, Outdoor dining area are common but not universal. Offering these can provide a competitive edge.
Recommendations for Hosts
- Ensure your listing includes all essential amenities for Jalajala: Wifi, Free parking on premises, BBQ grill, Air conditioning, Pool.
- Consider adding popular differentiators like TV or Kitchen to increase appeal.
- Highlight unique or less common amenities you offer (e.g., hot tub, dedicated workspace, EV charger) in your listing description and photos.
- Regularly check competitor amenities in Jalajala to stay competitive.
Jalajala Airbnb Guest Demographics & Profile Analysis (2026)
Guest Profile Summary for Jalajala
- The typical guest profile for Airbnb in Jalajala consists of primarily domestic travelers (91%), often arriving from nearby Quezon City, typically belonging to the Post-2000s (Gen Z/Alpha) group (50%), primarily speaking English or Tagalog.
- Domestic travelers account for 91.2% of guests.
- Key international markets include Philippines (91.2%) and Canada (5.9%).
- Top languages spoken are English (55%) followed by Tagalog (25%).
- A significant demographic segment is the Post-2000s (Gen Z/Alpha) group, representing 50% of guests.
Recommendations for Hosts
- Target domestic marketing efforts towards travelers from Quezon City and Pasig.
- Tailor amenities and listing descriptions to appeal to the dominant Post-2000s (Gen Z/Alpha) demographic (e.g., highlight fast WiFi, smart home features, local guides).
- Highlight unique local experiences or amenities relevant to the primary guest profile.
- Consider seasonal promotions aligned with peak travel times for key origin markets.
Nearby Short-Term Rental Market Comparison
How does the Jalajala Airbnb market stack up against its neighbors? Compare key performance metrics like average monthly revenue, ADR, and occupancy rates in surrounding areas to understand the broader regional STR landscape.
| Market | Active Properties | Monthly Revenue | Daily Rate | Avg. Occupancy |
|---|---|---|---|---|
| Bustos | 10 | $1,728 | $216.86 | 28% |
| Cabangan | 44 | $1,529 | $200.94 | 26% |
| Lian | 121 | $1,491 | $216.20 | 24% |
| Laoag | 17 | $1,412 | $158.39 | 33% |
| Beneg | 13 | $1,304 | $267.34 | 22% |
| Arew | 11 | $1,288 | $193.81 | 22% |
| Cabuyao | 25 | $1,202 | $114.93 | 36% |
| Binangonan | 49 | $1,191 | $135.12 | 29% |
| Porac | 51 | $1,157 | $203.91 | 21% |
| Los Baños | 158 | $1,129 | $242.23 | 21% |