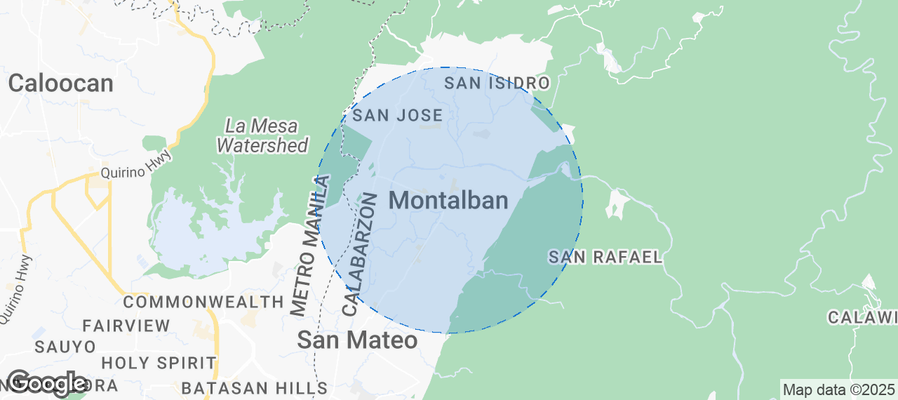
Montalban Airbnb Market Analysis 2026: Short Term Rental Data & Vacation Rental Statistics in Rizal, Philippines
Is Airbnb profitable in Montalban in 2026? Explore comprehensive Airbnb analytics for Montalban, Rizal, Philippines to uncover income potential. This 2026 STR market report for Montalban, based on AirROI data from February 2025 to January 2026, reveals key trends in the niche market of 22 active listings.
Whether you're considering an Airbnb investment in Montalban, optimizing your existing vacation rental, or exploring rental arbitrage opportunities, understanding the Montalban Airbnb data is crucial. Leveraging the low regulation environment is key to maximizing your short term rental income potential. Let's dive into the specifics.
Key Montalban Airbnb Performance Metrics Overview
Monthly Airbnb Revenue Variations & Income Potential in Montalban (2026)
Understanding the monthly revenue variations for Airbnb listings in Montalban is key to maximizing your short term rental income potential. Seasonality significantly impacts earnings. Our analysis, based on data from the past 12 months, shows that the peak revenue month for STRs in Montalban is typically May, while January often presents the lowest earnings, highlighting opportunities for strategic pricing adjustments during shoulder and low seasons. Explore the typical Airbnb income in Montalban across different performance tiers:
- Best-in-class properties (Top 10%) achieve $1,214+ monthly, often utilizing dynamic pricing and superior guest experiences.
- Strong performing properties (Top 25%) earn $529 or more, indicating effective management and desirable locations/amenities.
- Typical properties (Median) generate around $250 per month, representing the average market performance.
- Entry-level properties (Bottom 25%) see earnings around $124, often with potential for optimization.
Average Monthly Airbnb Earnings Trend in Montalban
Montalban Airbnb Occupancy Rate Trends (2026)
Maximize your bookings by understanding the Montalban STR occupancy trends. Seasonal demand shifts significantly influence how often properties are booked. Typically, Aprilsees the highest demand (peak season occupancy), while September experiences the lowest (low season). Effective strategies, like adjusting minimum stays or offering promotions, can boost occupancy during slower periods. Here's how different property tiers perform in Montalban:
- Best-in-class properties (Top 10%) achieve 56%+ occupancy, indicating high desirability and potentially optimized availability.
- Strong performing properties (Top 25%) maintain 32% or higher occupancy, suggesting good market fit and guest satisfaction.
- Typical properties (Median) have an occupancy rate around 19%.
- Entry-level properties (Bottom 25%) average 8% occupancy, potentially facing higher vacancy.
Average Monthly Occupancy Rate Trend in Montalban
Average Daily Rate (ADR) Airbnb Trends in Montalban (2026)
Effective short term rental pricing strategy in Montalban involves understanding monthly ADR fluctuations. The Average Daily Rate (ADR) for Airbnb in Montalban typically peaks in September and dips lowest during April. Leveraging Airbnb dynamic pricing tools or strategies based on this seasonality can significantly boost revenue. Here's a look at the typical nightly rates achieved:
- Best-in-class properties (Top 10%) command rates of $109+ per night, often due to premium features or locations.
- Strong performing properties (Top 25%) achieve nightly rates of $48 or more.
- Typical properties (Median) charge around $32 per night.
- Entry-level properties (Bottom 25%) earn around $23 per night.
Average Daily Rate (ADR) Trend by Month in Montalban
Get Live Montalban Market Intelligence 👇
Explore Real-time Analytics
Airbnb Seasonality Analysis & Trends in Montalban (2026)
Peak Season (May, February, March)
- Revenue averages $732 per month
- Occupancy rates average 25.1%
- Daily rates average $53
Shoulder Season
- Revenue averages $441 per month
- Occupancy maintains around 24.7%
- Daily rates hold near $54
Low Season (January, August, November)
- Revenue drops to average $296 per month
- Occupancy decreases to average 21.0%
- Daily rates adjust to average $54
Seasonality Insights for Montalban
- The Airbnb seasonality in Montalban shows highly seasonal trends requiring careful strategy. While the sections above show seasonal averages, it's also insightful to look at the extremes:
- During the high season, the absolute peak month showcases Montalban's highest earning potential, with monthly revenues capable of climbing to $807, occupancy reaching a high of 35.2%, and ADRs peaking at $55.
- Conversely, the slowest single month of the year, typically falling within the low season, marks the market's lowest point. In this month, revenue might dip to $243, occupancy could drop to 9.6%, and ADRs may adjust down to $52.
- Understanding both the seasonal averages and these monthly peaks and troughs in revenue, occupancy, and ADR is crucial for maximizing your Airbnb profit potential in Montalban.
Seasonal Strategies for Maximizing Profit
- Peak Season: Maximize revenue through premium pricing and potentially longer minimum stays. Ensure high availability.
- Low Season: Offer competitive pricing, special promotions (e.g., extended stay discounts), and flexible cancellation policies. Target off-season travelers like remote workers or budget-conscious guests.
- Shoulder Seasons: Implement dynamic pricing that balances peak and low rates. Target weekend travelers or specific events. Offer slightly more flexible terms than peak season.
- Regularly analyze your own performance against these Montalban seasonality benchmarks and adjust your pricing and availability strategy accordingly.
Best Areas for Airbnb Investment in Montalban (2026)
Exploring the top neighborhoods for short-term rentals in Montalban? This section highlights key areas, outlining why they are attractive for hosts and guests, along with notable local attractions. Consider these locations based on your target guest profile and investment strategy.
| Neighborhood / Area | Why Host Here? (Target Guests & Appeal) | Key Attractions & Landmarks |
|---|---|---|
| San Jose | A bustling urban area with a mix of residential and commercial spaces, renowned for its proximity to nature spots like the Wawa Dam and the Rodriguez River. Ideal for tourists looking for both urban and outdoor experiences. | Wawa Dam, Rodriguez River, Montalban Town Center, Nature reserves, Local restaurants |
| Montalban Nature Park | A beautiful area that offers outdoor activities such as hiking and trekking, attracting nature lovers and adventure seekers looking to unwind in a serene environment. | Montalban Nature Park, Eco-trails, Hiking spots, Outdoor activities, Picnic areas |
| San Isidro | A quieter community ideal for families and visitors who prefer a more suburban setting, yet close to urban amenities and attractions. | Local markets, Family parks, Community events, Nearby shops, Dining spots |
| Villa de Tetuan | A newly developed area with modern housing, catering to both residents and tourists looking for comfortable accommodations. | Modern housing, Proximity to schools and malls, Recreational parks, Community centers |
| Rosario | Rich in culture and history, this area presents traditional Filipino experiences with local artisans and shops, perfect for guests wanting to immerse in local culture. | Historical landmarks, Local artisan shops, Cultural events, Community festivals |
| Wawa | A scenic area popular for its natural beauty and outdoor spots, especially the river and dam, making it attractive for eco-tourism and relaxation. | Wawa River, Dambuhayan Falls, Hiking trails, Picnic spots, Scenic views |
| San Juan | Known for its accessibility to main roads and various establishments, making it convenient for tourists needing easy transport to nearby cities and attractions. | Shopping centers, Restaurants, Accessibility to metro roads, Local attractions |
| Montalban City Proper | The heart of Montalban with essential amenities, shopping, dining, and local culture, appealing to tourists who want a central location. | Montalban municipal buildings, Local eateries, Shopping hubs, Cultural attractions |
Understanding Airbnb License Requirements & STR Laws in Montalban (2026)
While Montalban, Rizal, Philippines currently shows low STR regulations, specific Airbnb license requirements might still exist or change. Always verify the latest short term rental regulations and Airbnb license requirements directly with local government authorities for Montalban to ensure full compliance before hosting.
(Source: AirROI data, 2026, finding no licensed listings among those analyzed)
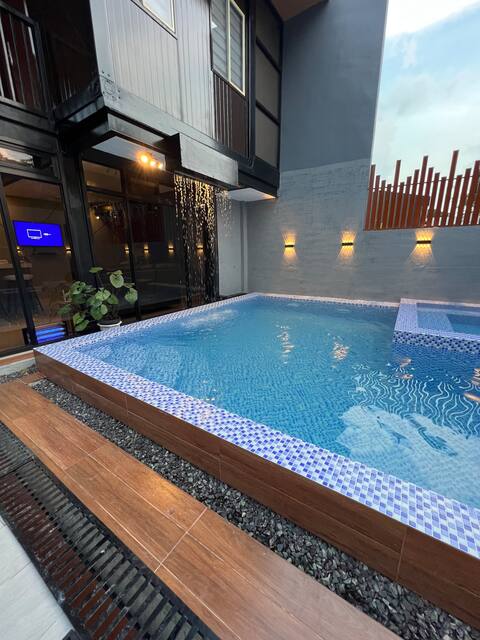
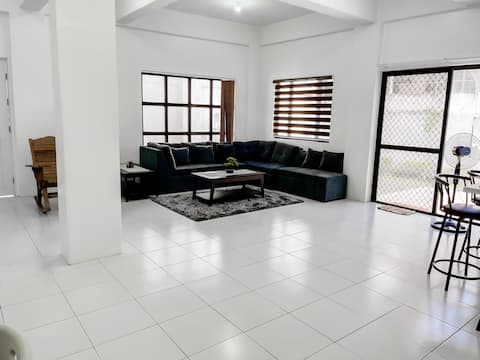
Top Performing Airbnb Properties in Montalban (2026)
Benchmark your potential! Explore examples of top-performing Airbnb properties in Montalbanbased on Trailing Twelve Month (TTM) revenue. Analyze their characteristics, revenue, occupancy rate, and ADR to understand what drives success in this market.

Casa Azil
Entire Place • 2 bedrooms
Casa Teresita,
Entire Place • 1 bedroom

Curvera Rest House w/ Private Swimming Pool
Entire Place • 2 bedrooms
Home in Montalban
Entire Place • 2 bedrooms

Montalban Staycation/Transient 1 - Gelo House
Private Room • N/A

Montalban Staycation/Transient 2 - Gelo House
Private Room • N/A
Note: Performance varies based on location, size, amenities, seasonality, and management quality. Data reflects the past 12 months.
Top Performing Airbnb Hosts in Montalban (2026)
Learn from the best! This table showcases top-performing Airbnb hosts in Montalban based on the number of properties managed and estimated total revenue over the past year. Analyze their scale and performance metrics.
| Host Name | Properties | Grossing Revenue | Stay Reviews | Avg Rating |
|---|---|---|---|---|
| Ixara Marie | 1 | $20,403 | 5 | 5.00/5.0 |
| Angelica | 1 | $10,017 | 1 | Not Rated |
| Wilmor | 1 | $9,900 | 63 | 4.94/5.0 |
| Rogelio Jr | 2 | $6,875 | 69 | 4.83/5.0 |
| Melody | 4 | $5,931 | 32 | 4.89/5.0 |
| Micah | 1 | $4,650 | 10 | 4.50/5.0 |
| Alberto | 2 | $3,182 | 13 | 4.69/5.0 |
| Tina | 1 | $2,735 | 55 | 4.89/5.0 |
| Rowena | 1 | $2,288 | 7 | 4.43/5.0 |
| Jm | 1 | $2,124 | 2 | Not Rated |
Analyzing the strategies of top hosts, such as their property selection, pricing, and guest communication, can offer valuable lessons for optimizing your own Airbnb operations in Montalban.
Dive Deeper: Advanced Montalban STR Market Data (2026)
Ready to unlock more insights? AirROI provides access to advanced metrics and comprehensive Airbnb data for Montalban. Explore detailed analytics beyond this report to refine your investment strategy, optimize pricing, and maximize your vacation rental profits.
Explore Advanced MetricsMontalban Short-Term Rental Market Composition (2026): Property & Room Types
Room Type Distribution
Property Type Distribution
Market Composition Insights for Montalban
- The Montalban Airbnb market composition is heavily skewed towards Entire Home/Apt listings, which make up 77.3% of the 22 active rentals. This indicates strong guest preference for privacy and space.
- Looking at the property type distribution in Montalban, House properties are the most common (63.6%), reflecting the local real estate landscape.
- Houses represent a significant 63.6% portion, catering likely to families or larger groups.
- The presence of 9.1% Hotel/Boutique listings indicates integration with traditional hospitality.
Montalban Airbnb Room Capacity Analysis (2026): Bedroom Distribution
Distribution of Listings by Number of Bedrooms
Room Capacity Insights for Montalban
- The dominant room capacity in Montalban is 1 bedroom listings, making up 50% of the market. This suggests a strong demand for properties suitable for couples or solo travelers.
- Together, 1 bedroom and 2 bedrooms properties represent 81.8% of the active Airbnb listings in Montalban, indicating a high concentration in these sizes.
- Listings with 3+ bedrooms (4.5%) represent a smaller niche, potentially indicating an underserved market for larger group accommodations in Montalban.
Montalban Vacation Rental Guest Capacity Trends (2026)
Distribution of Listings by Guest Capacity
Guest Capacity Insights for Montalban
- The most common guest capacity trend in Montalban vacation rentals is listings accommodating 8+ guests (36.4%). This suggests the primary traveler segment is likely larger groups.
- Properties designed for 8+ guests and 4 guests dominate the Montalban STR market, accounting for 63.7% of listings.
- 54.6% of properties accommodate 6+ guests, serving the market segment for larger families or group travel in Montalban.
- On average, properties in Montalban are equipped to host 5.2 guests.
Montalban Airbnb Booking Patterns (2026): Available vs. Booked Days
Available Days Distribution
Booked Days Distribution
Booking Pattern Insights for Montalban
- The most common availability pattern in Montalban falls within the 271-366 days range, representing 81.8% of listings. This suggests many properties have significant open periods on their calendars.
- Approximately 100.0% of listings show high availability (181+ days open annually), indicating potential for increased bookings or specific owner usage patterns.
- For booked days, the 31-90 days range is most frequent in Montalban (45.5%), reflecting common guest stay durations or potential owner blocking patterns.
Montalban Airbnb Minimum Stay Requirements Analysis
Distribution of Listings by Minimum Night Requirement
1 Night
19 listings
86.4% of total
2 Nights
1 listings
4.5% of total
3 Nights
1 listings
4.5% of total
30+ Nights
1 listings
4.5% of total
Key Insights
- The most prevalent minimum stay requirement in Montalban is 1 Night, adopted by 86.4% of listings. This highlights the market's preference for shorter, flexible bookings.
- A strong majority (90.9%) of the Montalban Airbnb data shows acceptance of very short stays (1-2 nights), indicating a dynamic, high-turnover market.
Recommendations
- Align with the market by considering a 1 Night minimum stay, as 86.4% of Montalban hosts use this setting.
- Adjust minimum nights based on seasonality – potentially shorter during low season and longer during peak demand periods in Montalban.
Montalban Airbnb Cancellation Policy Trends Analysis (2026)
Flexible
5 listings
22.7% of total
Moderate
3 listings
13.6% of total
Firm
8 listings
36.4% of total
Strict
6 listings
27.3% of total
Cancellation Policy Insights for Montalban
- The prevailing Airbnb cancellation policy trend in Montalban is Firm, used by 36.4% of listings.
- A majority (63.7%) of hosts in Montalban utilize Firm or Strict policies, indicating a market where hosts prioritize booking security.
Recommendations for Hosts
- Consider adopting a Firm policy to align with the 36.4% market standard in Montalban.
- Regularly review your cancellation policy against competitors and market demand shifts in Montalban.
Montalban STR Booking Lead Time Analysis (2026)
Average Booking Lead Time by Month
Booking Lead Time Insights for Montalban
- The overall average booking lead time for vacation rentals in Montalban is 21 days.
- Guests book furthest in advance for stays during January (average 39 days), likely coinciding with peak travel demand or local events.
- The shortest booking windows occur for stays in September (average 6 days), indicating more last-minute travel plans during this time.
- Seasonally, Winter (29 days avg.) sees the longest lead times, while Fall (13 days avg.) has the shortest, reflecting typical travel planning cycles.
Recommendations for Hosts
- Use the overall average lead time (21 days) as a baseline for your pricing and availability strategy in Montalban.
- For January stays, consider implementing length-of-stay discounts or slightly higher rates for bookings made less than 39 days out to capitalize on advance planning.
- During September, focus on last-minute booking availability and promotions, as guests book with very short notice (6 days avg.).
- Target marketing efforts for the Winter season well in advance (at least 29 days) to capture early planners.
- Monitor your own booking lead times against these Montalban averages to identify opportunities for dynamic pricing adjustments.
Popular & Essential Airbnb Amenities in Montalban (2026)
Amenity Prevalence
Amenity Insights for Montalban
- Essential amenities in Montalban that guests expect include: Wifi, Free parking on premises. Lacking these (any) could significantly impact bookings.
- Popular amenities like Air conditioning, TV, Kitchen are common but not universal. Offering these can provide a competitive edge.
Recommendations for Hosts
- Ensure your listing includes all essential amenities for Montalban: Wifi, Free parking on premises.
- Prioritize adding missing essentials: Free parking on premises.
- Consider adding popular differentiators like Air conditioning or TV to increase appeal.
- Highlight unique or less common amenities you offer (e.g., hot tub, dedicated workspace, EV charger) in your listing description and photos.
- Regularly check competitor amenities in Montalban to stay competitive.
Montalban Airbnb Guest Demographics & Profile Analysis (2026)
Guest Profile Summary for Montalban
- The typical guest profile for Airbnb in Montalban consists of a mix of domestic (62%) and international guests, often arriving from nearby Manila, typically belonging to the Post-2000s (Gen Z/Alpha) group (50%), primarily speaking English or Tagalog.
- Domestic travelers account for 62.1% of guests.
- Key international markets include Philippines (62.1%) and United States (10.3%).
- Top languages spoken are English (55.6%) followed by Tagalog (25.9%).
- A significant demographic segment is the Post-2000s (Gen Z/Alpha) group, representing 50% of guests.
Recommendations for Hosts
- Target domestic marketing efforts towards travelers from Manila and England.
- Tailor amenities and listing descriptions to appeal to the dominant Post-2000s (Gen Z/Alpha) demographic (e.g., highlight fast WiFi, smart home features, local guides).
- Highlight unique local experiences or amenities relevant to the primary guest profile.
- Consider seasonal promotions aligned with peak travel times for key origin markets.
Nearby Short-Term Rental Market Comparison
How does the Montalban Airbnb market stack up against its neighbors? Compare key performance metrics like average monthly revenue, ADR, and occupancy rates in surrounding areas to understand the broader regional STR landscape.
| Market | Active Properties | Monthly Revenue | Daily Rate | Avg. Occupancy |
|---|---|---|---|---|
| Bustos | 10 | $1,728 | $216.86 | 28% |
| Cabangan | 44 | $1,529 | $200.94 | 26% |
| Lian | 121 | $1,491 | $216.20 | 24% |
| Jalajala | 19 | $1,489 | $234.86 | 21% |
| Laoag | 17 | $1,412 | $158.39 | 33% |
| Beneg | 13 | $1,304 | $267.34 | 22% |
| Arew | 11 | $1,288 | $193.81 | 22% |
| Cabuyao | 25 | $1,202 | $114.93 | 36% |
| Binangonan | 49 | $1,191 | $135.12 | 29% |
| Porac | 51 | $1,157 | $203.91 | 21% |