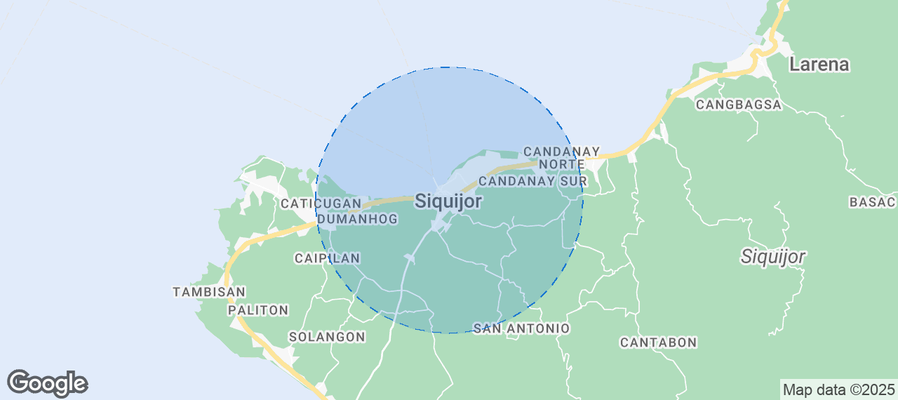
Siquijor Airbnb Market Analysis 2026: Short Term Rental Data & Vacation Rental Statistics in Siquijor, Philippines
Is Airbnb profitable in Siquijor in 2026? Explore comprehensive Airbnb analytics for Siquijor, Siquijor, Philippines to uncover income potential. This 2026 STR market report for Siquijor, based on AirROI data from February 2025 to January 2026, reveals key trends in the niche market of 89 active listings.
Whether you're considering an Airbnb investment in Siquijor, optimizing your existing vacation rental, or exploring rental arbitrage opportunities, understanding the Siquijor Airbnb data is crucial. Leveraging the low regulation environment is key to maximizing your short term rental income potential. Let's dive into the specifics.
Key Siquijor Airbnb Performance Metrics Overview
Monthly Airbnb Revenue Variations & Income Potential in Siquijor (2026)
Understanding the monthly revenue variations for Airbnb listings in Siquijor is key to maximizing your short term rental income potential. Seasonality significantly impacts earnings. Our analysis, based on data from the past 12 months, shows that the peak revenue month for STRs in Siquijor is typically February, while September often presents the lowest earnings, highlighting opportunities for strategic pricing adjustments during shoulder and low seasons. Explore the typical Airbnb income in Siquijor across different performance tiers:
- Best-in-class properties (Top 10%) achieve $1,238+ monthly, often utilizing dynamic pricing and superior guest experiences.
- Strong performing properties (Top 25%) earn $580 or more, indicating effective management and desirable locations/amenities.
- Typical properties (Median) generate around $344 per month, representing the average market performance.
- Entry-level properties (Bottom 25%) see earnings around $194, often with potential for optimization.
Average Monthly Airbnb Earnings Trend in Siquijor
Siquijor Airbnb Occupancy Rate Trends (2026)
Maximize your bookings by understanding the Siquijor STR occupancy trends. Seasonal demand shifts significantly influence how often properties are booked. Typically, Februarysees the highest demand (peak season occupancy), while January experiences the lowest (low season). Effective strategies, like adjusting minimum stays or offering promotions, can boost occupancy during slower periods. Here's how different property tiers perform in Siquijor:
- Best-in-class properties (Top 10%) achieve 79%+ occupancy, indicating high desirability and potentially optimized availability.
- Strong performing properties (Top 25%) maintain 61% or higher occupancy, suggesting good market fit and guest satisfaction.
- Typical properties (Median) have an occupancy rate around 40%.
- Entry-level properties (Bottom 25%) average 20% occupancy, potentially facing higher vacancy.
Average Monthly Occupancy Rate Trend in Siquijor
Average Daily Rate (ADR) Airbnb Trends in Siquijor (2026)
Effective short term rental pricing strategy in Siquijor involves understanding monthly ADR fluctuations. The Average Daily Rate (ADR) for Airbnb in Siquijor typically peaks in December and dips lowest during February. Leveraging Airbnb dynamic pricing tools or strategies based on this seasonality can significantly boost revenue. Here's a look at the typical nightly rates achieved:
- Best-in-class properties (Top 10%) command rates of $88+ per night, often due to premium features or locations.
- Strong performing properties (Top 25%) achieve nightly rates of $45 or more.
- Typical properties (Median) charge around $29 per night.
- Entry-level properties (Bottom 25%) earn around $22 per night.
Average Daily Rate (ADR) Trend by Month in Siquijor
Get Live Siquijor Market Intelligence 👇
Explore Real-time Analytics
Airbnb Seasonality Analysis & Trends in Siquijor (2026)
Peak Season (February, March, May)
- Revenue averages $650 per month
- Occupancy rates average 53.5%
- Daily rates average $41
Shoulder Season
- Revenue averages $525 per month
- Occupancy maintains around 41.2%
- Daily rates hold near $42
Low Season (January, September, October)
- Revenue drops to average $408 per month
- Occupancy decreases to average 30.6%
- Daily rates adjust to average $41
Seasonality Insights for Siquijor
- The Airbnb seasonality in Siquijor shows moderate seasonality with distinct peak and low periods. While the sections above show seasonal averages, it's also insightful to look at the extremes:
- During the high season, the absolute peak month showcases Siquijor's highest earning potential, with monthly revenues capable of climbing to $665, occupancy reaching a high of 59.1%, and ADRs peaking at $42.
- Conversely, the slowest single month of the year, typically falling within the low season, marks the market's lowest point. In this month, revenue might dip to $393, occupancy could drop to 28.0%, and ADRs may adjust down to $40.
- Understanding both the seasonal averages and these monthly peaks and troughs in revenue, occupancy, and ADR is crucial for maximizing your Airbnb profit potential in Siquijor.
Seasonal Strategies for Maximizing Profit
- Peak Season: Maximize revenue through premium pricing and potentially longer minimum stays. Ensure high availability.
- Low Season: Offer competitive pricing, special promotions (e.g., extended stay discounts), and flexible cancellation policies. Target off-season travelers like remote workers or budget-conscious guests.
- Shoulder Seasons: Implement dynamic pricing that balances peak and low rates. Target weekend travelers or specific events. Offer slightly more flexible terms than peak season.
- Regularly analyze your own performance against these Siquijor seasonality benchmarks and adjust your pricing and availability strategy accordingly.
Best Areas for Airbnb Investment in Siquijor (2026)
Exploring the top neighborhoods for short-term rentals in Siquijor? This section highlights key areas, outlining why they are attractive for hosts and guests, along with notable local attractions. Consider these locations based on your target guest profile and investment strategy.
| Neighborhood / Area | Why Host Here? (Target Guests & Appeal) | Key Attractions & Landmarks |
|---|---|---|
| San Juan | Known for beautiful beaches and a vibrant nightlife, San Juan is a favorite among tourists for water activities and beach relaxation. It offers easy access to various attractions and a lively local culture. | Salagdoong Beach, Paliton Beach, Cambughay Falls, Capilay Spring Park, San Juan's nightlife and bars |
| Larena | Home to the ferry terminal, Larena is easily accessible for travelers coming to Siquijor. It features beautiful coastal views and is close to local attractions, making it a convenient base for exploring the island. | St. Isidore de Labrador Parish Church, Siquijor Butterfly Sanctuary, Capilay Spring Park, Larena Beach |
| Siquijor Town | The capital town offers a mix of local culture and attractions. It’s perfect for those wanting to experience the local lifestyle while being close to beautiful beaches and historical sites. | Siquijor Public Market, Sandugan Beach, Siquijor Belfry, Mount Bandilaan |
| Maria | This area is known for its natural beauty and less touristy feel. It gives visitors a chance to experience the serenity of Siquijor's landscapes and also has stunning beaches. | Lugnason Falls, Kampinggan Beach, Cangis Beach, Maria's local markets |
| Salagdoong | Famous for its cliff diving and pristine waters, Salagdoong attracts adventure seekers. It’s also a scenic area for those who love nature and breathtaking views. | Salagdoong Beach, Cliff diving spots, Jungle trails around the area |
| Dumaluan | Dumaluan is known for its tranquility and beautiful shoreline. It’s ideal for families and those seeking a quieter stay close to nature. | Dumaluan Beach, Local seafood restaurants, Scenic boat tours |
| Sambog | A hidden gem on the island, Sambog is known for its rich marine life and stunning coral reefs, making it popular for diving and snorkeling enthusiasts. | Diving spots, Snorkeling sites, Natural beauty of the coastline |
| Balay Ni Mayang | A cultural hub that showcases the traditional way of life in Siquijor. Visitors can enjoy authentic local experiences while being near to other attractions. | Traditional craft markets, Folklore tours, Local food tasting experiences |
Understanding Airbnb License Requirements & STR Laws in Siquijor (2026)
While Siquijor, Siquijor, Philippines currently shows low STR regulations, specific Airbnb license requirements might still exist or change. Always verify the latest short term rental regulations and Airbnb license requirements directly with local government authorities for Siquijor to ensure full compliance before hosting.
(Source: AirROI data, 2026, finding no licensed listings among those analyzed)
Top Performing Airbnb Properties in Siquijor (2026)
Benchmark your potential! Explore examples of top-performing Airbnb properties in Siquijorbased on Trailing Twelve Month (TTM) revenue. Analyze their characteristics, revenue, occupancy rate, and ADR to understand what drives success in this market.
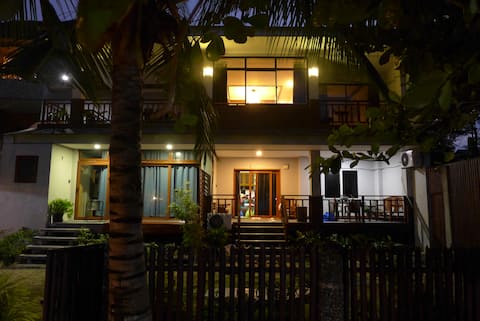
Juvy's Beach House - Ground floor
Entire Place • 2 bedrooms

Seaside White House Siquijor’s best location
Entire Place • 2 bedrooms
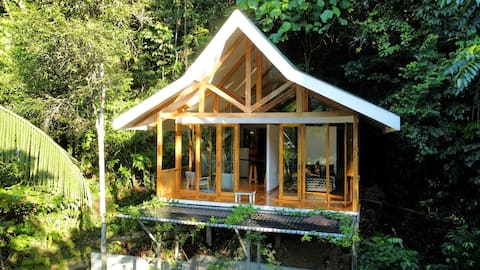
Remote Home near Secret Lagoon with Motorcycle
Entire Place • 1 bedroom

Juvy's Beach House - Top floor
Entire Place • 2 bedrooms

Wejman Mountain Residence
Entire Place • 2 bedrooms

Juvy's Beach House - The Annex
Entire Place • 1 bedroom
Note: Performance varies based on location, size, amenities, seasonality, and management quality. Data reflects the past 12 months.
Top Performing Airbnb Hosts in Siquijor (2026)
Learn from the best! This table showcases top-performing Airbnb hosts in Siquijor based on the number of properties managed and estimated total revenue over the past year. Analyze their scale and performance metrics.
| Host Name | Properties | Grossing Revenue | Stay Reviews | Avg Rating |
|---|---|---|---|---|
| Juvy | 3 | $65,131 | 258 | 4.76/5.0 |
| Susan | 2 | $33,492 | 154 | 4.93/5.0 |
| Elizer | 1 | $23,358 | 214 | 4.96/5.0 |
| Mei Ling | 6 | $21,112 | 186 | 4.61/5.0 |
| Lenie | 4 | $19,619 | 79 | 4.87/5.0 |
| Lukasz | 1 | $18,144 | 10 | 4.70/5.0 |
| Mariza | 6 | $18,034 | 109 | 4.68/5.0 |
| Frances | 3 | $16,640 | 37 | 4.20/5.0 |
| Joanne Beth | 4 | $16,270 | 147 | 4.89/5.0 |
| James | 3 | $15,254 | 65 | 4.77/5.0 |
Analyzing the strategies of top hosts, such as their property selection, pricing, and guest communication, can offer valuable lessons for optimizing your own Airbnb operations in Siquijor.
Dive Deeper: Advanced Siquijor STR Market Data (2026)
Ready to unlock more insights? AirROI provides access to advanced metrics and comprehensive Airbnb data for Siquijor. Explore detailed analytics beyond this report to refine your investment strategy, optimize pricing, and maximize your vacation rental profits.
Explore Advanced MetricsSiquijor Short-Term Rental Market Composition (2026): Property & Room Types
Room Type Distribution
Property Type Distribution
Market Composition Insights for Siquijor
- The Siquijor Airbnb market composition is heavily skewed towards Entire Home/Apt listings, which make up 56.2% of the 89 active rentals. This indicates strong guest preference for privacy and space.
- However, a notable 43.8% share for Private Rooms suggests opportunities for budget-conscious travelers or hosts renting out spare rooms.
- Looking at the property type distribution in Siquijor, House properties are the most common (28.1%), reflecting the local real estate landscape.
- Houses represent a significant 28.1% portion, catering likely to families or larger groups.
- The presence of 28.1% Hotel/Boutique listings indicates integration with traditional hospitality.
Siquijor Airbnb Room Capacity Analysis (2026): Bedroom Distribution
Distribution of Listings by Number of Bedrooms
Room Capacity Insights for Siquijor
- The dominant room capacity in Siquijor is 1 bedroom listings, making up 56.2% of the market. This suggests a strong demand for properties suitable for couples or solo travelers.
- Together, 1 bedroom and 2 bedrooms properties represent 68.6% of the active Airbnb listings in Siquijor, indicating a high concentration in these sizes.
- With over half the market (56.2%) consisting of studios or 1-bedroom units, Siquijor is particularly well-suited for individuals or couples.
- Listings with 3+ bedrooms (4.5%) represent a smaller niche, potentially indicating an underserved market for larger group accommodations in Siquijor.
Siquijor Vacation Rental Guest Capacity Trends (2026)
Distribution of Listings by Guest Capacity
Guest Capacity Insights for Siquijor
- The most common guest capacity trend in Siquijor vacation rentals is listings accommodating 2 guests (33.7%). This suggests the primary traveler segment is likely couples or solo travelers.
- Properties designed for 2 guests and 4 guests dominate the Siquijor STR market, accounting for 52.8% of listings.
- 19.1% of properties accommodate 6+ guests, serving the market segment for larger families or group travel in Siquijor.
- On average, properties in Siquijor are equipped to host 3.1 guests.
Siquijor Airbnb Booking Patterns (2026): Available vs. Booked Days
Available Days Distribution
Booked Days Distribution
Booking Pattern Insights for Siquijor
- The most common availability pattern in Siquijor falls within the 271-366 days range, representing 51.7% of listings. This suggests many properties have significant open periods on their calendars.
- Approximately 77.5% of listings show high availability (181+ days open annually), indicating potential for increased bookings or specific owner usage patterns.
- For booked days, the 31-90 days range is most frequent in Siquijor (32.6%), reflecting common guest stay durations or potential owner blocking patterns.
- A notable 23.6% of properties secure long booking periods (181+ days booked per year), highlighting successful long-term rental strategies or significant owner usage.
Siquijor Airbnb Minimum Stay Requirements Analysis
Distribution of Listings by Minimum Night Requirement
1 Night
68 listings
76.4% of total
2 Nights
14 listings
15.7% of total
30+ Nights
7 listings
7.9% of total
Key Insights
- The most prevalent minimum stay requirement in Siquijor is 1 Night, adopted by 76.4% of listings. This highlights the market's preference for shorter, flexible bookings.
- A strong majority (92.1%) of the Siquijor Airbnb data shows acceptance of very short stays (1-2 nights), indicating a dynamic, high-turnover market.
Recommendations
- Align with the market by considering a 1 Night minimum stay, as 76.4% of Siquijor hosts use this setting.
- Explore offering discounts for stays of 30+ nights to attract the 7.9% of the market seeking extended stays.
- Adjust minimum nights based on seasonality – potentially shorter during low season and longer during peak demand periods in Siquijor.
Siquijor Airbnb Cancellation Policy Trends Analysis (2026)
Limited
5 listings
5.6% of total
Flexible
25 listings
28.1% of total
Moderate
34 listings
38.2% of total
Firm
18 listings
20.2% of total
Strict
7 listings
7.9% of total
Cancellation Policy Insights for Siquijor
- The prevailing Airbnb cancellation policy trend in Siquijor is Moderate, used by 38.2% of listings.
- There's a relatively balanced mix between guest-friendly (66.3%) and stricter (28.1%) policies, offering choices for different guest needs.
- Strict cancellation policies are quite rare (7.9%), potentially making listings with this policy less competitive unless justified by high demand or property type.
Recommendations for Hosts
- Consider adopting a Moderate policy to align with the 38.2% market standard in Siquijor.
- Using a Strict policy might deter some guests, as only 7.9% of listings use it. Evaluate if potential revenue protection outweighs possible lower booking rates.
- Regularly review your cancellation policy against competitors and market demand shifts in Siquijor.
Siquijor STR Booking Lead Time Analysis (2026)
Average Booking Lead Time by Month
Booking Lead Time Insights for Siquijor
- The overall average booking lead time for vacation rentals in Siquijor is 34 days.
- Guests book furthest in advance for stays during November (average 47 days), likely coinciding with peak travel demand or local events.
- The shortest booking windows occur for stays in December (average 27 days), indicating more last-minute travel plans during this time.
- Seasonally, Fall (41 days avg.) sees the longest lead times, while Winter (32 days avg.) has the shortest, reflecting typical travel planning cycles.
Recommendations for Hosts
- Use the overall average lead time (34 days) as a baseline for your pricing and availability strategy in Siquijor.
- For November stays, consider implementing length-of-stay discounts or slightly higher rates for bookings made less than 47 days out to capitalize on advance planning.
- Target marketing efforts for the Fall season well in advance (at least 41 days) to capture early planners.
- Monitor your own booking lead times against these Siquijor averages to identify opportunities for dynamic pricing adjustments.
Popular & Essential Airbnb Amenities in Siquijor (2026)
Amenity Prevalence
Amenity Insights for Siquijor
- Popular amenities like Free parking on premises, Wifi, Air conditioning are common but not universal. Offering these can provide a competitive edge.
- Warning: Wifi is not universally provided but is considered essential globally. Ensure reliable Wifi is offered.
Recommendations for Hosts
- Consider adding popular differentiators like Free parking on premises or Wifi to increase appeal.
- Highlight unique or less common amenities you offer (e.g., hot tub, dedicated workspace, EV charger) in your listing description and photos.
- Regularly check competitor amenities in Siquijor to stay competitive.
Siquijor Airbnb Guest Demographics & Profile Analysis (2026)
Guest Profile Summary for Siquijor
- The typical guest profile for Airbnb in Siquijor consists of predominantly international visitors (70%), with top international origins including France, typically belonging to the Post-2000s (Gen Z/Alpha) group (50%), primarily speaking English or French.
- Domestic travelers account for 30.1% of guests.
- Key international markets include Philippines (30.1%) and France (14.4%).
- Top languages spoken are English (45.9%) followed by French (13.2%).
- A significant demographic segment is the Post-2000s (Gen Z/Alpha) group, representing 50% of guests.
Recommendations for Hosts
- Focus marketing internationally, particularly towards travelers from France.
- Tailor amenities and listing descriptions to appeal to the dominant Post-2000s (Gen Z/Alpha) demographic (e.g., highlight fast WiFi, smart home features, local guides).
- Highlight unique local experiences or amenities relevant to the primary guest profile.
- Consider seasonal promotions aligned with peak travel times for key origin markets.
Nearby Short-Term Rental Market Comparison
How does the Siquijor Airbnb market stack up against its neighbors? Compare key performance metrics like average monthly revenue, ADR, and occupancy rates in surrounding areas to understand the broader regional STR landscape.
| Market | Active Properties | Monthly Revenue | Daily Rate | Avg. Occupancy |
|---|---|---|---|---|
| Mantalongon | 11 | $1,269 | $126.62 | 35% |
| Gaas | 10 | $1,141 | $180.05 | 30% |
| Samboan | 11 | $1,048 | $117.88 | 28% |
| Santander | 14 | $905 | $96.82 | 32% |
| Tuble | 37 | $631 | $63.59 | 34% |
| Basdiot | 144 | $601 | $58.88 | 38% |
| Balabagon | 13 | $561 | $43.13 | 53% |
| Lazi | 30 | $515 | $50.03 | 37% |
| Manolo Fortich | 37 | $511 | $103.03 | 23% |
| Panglao | 526 | $507 | $66.52 | 31% |