La Paz Airbnb Market Analysis 2026: Short Term Rental Data & Vacation Rental Statistics in Zambales, Philippines
Is Airbnb profitable in La Paz in 2026? Explore comprehensive Airbnb analytics for La Paz, Zambales, Philippines to uncover income potential. This 2026 STR market report for La Paz, based on AirROI data from February 2025 to January 2026, reveals key trends in the niche market of 19 active listings.
Whether you're considering an Airbnb investment in La Paz, optimizing your existing vacation rental, or exploring rental arbitrage opportunities, understanding the La Paz Airbnb data is crucial. Leveraging the low regulation environment is key to maximizing your short term rental income potential. Let's dive into the specifics.
Key La Paz Airbnb Performance Metrics Overview
Monthly Airbnb Revenue Variations & Income Potential in La Paz (2026)
Understanding the monthly revenue variations for Airbnb listings in La Paz is key to maximizing your short term rental income potential. Seasonality significantly impacts earnings. Our analysis, based on data from the past 12 months, shows that the peak revenue month for STRs in La Paz is typically September, while November often presents the lowest earnings, highlighting opportunities for strategic pricing adjustments during shoulder and low seasons. Explore the typical Airbnb income in La Paz across different performance tiers:
- Best-in-class properties (Top 10%) achieve $1,382+ monthly, often utilizing dynamic pricing and superior guest experiences.
- Strong performing properties (Top 25%) earn $554 or more, indicating effective management and desirable locations/amenities.
- Typical properties (Median) generate around $294 per month, representing the average market performance.
- Entry-level properties (Bottom 25%) see earnings around $171, often with potential for optimization.
Average Monthly Airbnb Earnings Trend in La Paz
La Paz Airbnb Occupancy Rate Trends (2026)
Maximize your bookings by understanding the La Paz STR occupancy trends. Seasonal demand shifts significantly influence how often properties are booked. Typically, Aprilsees the highest demand (peak season occupancy), while October experiences the lowest (low season). Effective strategies, like adjusting minimum stays or offering promotions, can boost occupancy during slower periods. Here's how different property tiers perform in La Paz:
- Best-in-class properties (Top 10%) achieve 36%+ occupancy, indicating high desirability and potentially optimized availability.
- Strong performing properties (Top 25%) maintain 21% or higher occupancy, suggesting good market fit and guest satisfaction.
- Typical properties (Median) have an occupancy rate around 12%.
- Entry-level properties (Bottom 25%) average 8% occupancy, potentially facing higher vacancy.
Average Monthly Occupancy Rate Trend in La Paz
Average Daily Rate (ADR) Airbnb Trends in La Paz (2026)
Effective short term rental pricing strategy in La Paz involves understanding monthly ADR fluctuations. The Average Daily Rate (ADR) for Airbnb in La Paz typically peaks in October and dips lowest during March. Leveraging Airbnb dynamic pricing tools or strategies based on this seasonality can significantly boost revenue. Here's a look at the typical nightly rates achieved:
- Best-in-class properties (Top 10%) command rates of $246+ per night, often due to premium features or locations.
- Strong performing properties (Top 25%) achieve nightly rates of $142 or more.
- Typical properties (Median) charge around $74 per night.
- Entry-level properties (Bottom 25%) earn around $59 per night.
Average Daily Rate (ADR) Trend by Month in La Paz
Get Live La Paz Market Intelligence 👇

Explore Real-time Analytics
Airbnb Seasonality Analysis & Trends in La Paz (2026)
Peak Season (September, April, May)
- Revenue averages $825 per month
- Occupancy rates average 23.4%
- Daily rates average $119
Shoulder Season
- Revenue averages $595 per month
- Occupancy maintains around 17.9%
- Daily rates hold near $121
Low Season (August, October, November)
- Revenue drops to average $228 per month
- Occupancy decreases to average 8.9%
- Daily rates adjust to average $125
Seasonality Insights for La Paz
- The Airbnb seasonality in La Paz shows highly seasonal trends requiring careful strategy. While the sections above show seasonal averages, it's also insightful to look at the extremes:
- During the high season, the absolute peak month showcases La Paz's highest earning potential, with monthly revenues capable of climbing to $900, occupancy reaching a high of 30.2%, and ADRs peaking at $127.
- Conversely, the slowest single month of the year, typically falling within the low season, marks the market's lowest point. In this month, revenue might dip to $148, occupancy could drop to 7.7%, and ADRs may adjust down to $116.
- Understanding both the seasonal averages and these monthly peaks and troughs in revenue, occupancy, and ADR is crucial for maximizing your Airbnb profit potential in La Paz.
Seasonal Strategies for Maximizing Profit
- Peak Season: Maximize revenue through premium pricing and potentially longer minimum stays. Ensure high availability.
- Low Season: Offer competitive pricing, special promotions (e.g., extended stay discounts), and flexible cancellation policies. Target off-season travelers like remote workers or budget-conscious guests.
- Shoulder Seasons: Implement dynamic pricing that balances peak and low rates. Target weekend travelers or specific events. Offer slightly more flexible terms than peak season.
- Regularly analyze your own performance against these La Paz seasonality benchmarks and adjust your pricing and availability strategy accordingly.
Best Areas for Airbnb Investment in La Paz (2026)
Exploring the top neighborhoods for short-term rentals in La Paz? This section highlights key areas, outlining why they are attractive for hosts and guests, along with notable local attractions. Consider these locations based on your target guest profile and investment strategy.
| Neighborhood / Area | Why Host Here? (Target Guests & Appeal) | Key Attractions & Landmarks |
|---|---|---|
| Pundaquit | A picturesque beach area known for its stunning white sand beaches and crystal-clear waters. Ideal for tourists seeking beach activities, island hopping, and a laid-back lifestyle. | Anawangin Cove, Nagsasa Cove, Capones Island, Beach resorts, Water sports activities |
| Subic Bay | Former US naval base turned into a prime tourist destination with plenty of attractions. Offers a safe and family-friendly environment with various activities for all ages. | Zoobic Safari, Ocean Adventure, Subic Bay Freeport Zone, Dinosaur Island, Baloy Beach |
| San Antonio | A charming coastal town recognized for its beautiful beaches and local culture. Great for travelers looking to experience the local vibe and enjoy outdoor activities. | Potipot Island, Long Beach, San Antonio Church, Beach resorts, Water activities |
| Iba | The capital of Zambales, known for its annual events and access to beautiful beaches. Good for tourists who want to experience local festivals and culture. | Iba Beach, San Jose Church, Local markets, Chapel of the Holy Cross, Annual Mango Festival |
| Botolan | Known for its adventure tourism and natural beauty, including mountains and trails. Appeals to nature lovers and outdoor enthusiasts. | Pulong Bulo Waterfall, Botolan River, Hiking trails, Local indigenous culture, Forest exploration |
| Casa San Miguel | A cultural center and community space that also hosts art workshops and music events. It attracts tourists interested in arts and culture. | Art workshops, Live music events, Local artisan shops, Café and gallery space, Community events |
| Olongapo City | A vibrant city with a rich history and modern amenities. Popular for nightlife and various dining options, appealing to a diverse range of visitors. | Olongapo City Night Market, Subic Bay Boardwalk, Water parks, Shopping malls, Dining options |
| Masinloc | A quieter coastal town, offering peace and tranquility along with beautiful seascapes. Ideal for travelers looking to escape the busy tourist spots. | Masinloc Bay, Talisay Beach, Local seafood restaurants, Historical landmarks, Nature walks |
Understanding Airbnb License Requirements & STR Laws in La Paz (2026)
While La Paz, Zambales, Philippines currently shows low STR regulations, specific Airbnb license requirements might still exist or change. Always verify the latest short term rental regulations and Airbnb license requirements directly with local government authorities for La Paz to ensure full compliance before hosting.
(Source: AirROI data, 2026, finding no licensed listings among those analyzed)
Top Performing Airbnb Properties in La Paz (2026)
Benchmark your potential! Explore examples of top-performing Airbnb properties in La Pazbased on Trailing Twelve Month (TTM) revenue. Analyze their characteristics, revenue, occupancy rate, and ADR to understand what drives success in this market.

Villa Iluminada beachfront big family resthouse
Entire Place • 4 bedrooms

Joel Beach Resort & Camping site
Entire Place • 3 bedrooms

House Near the Beach
Entire Place • 2 bedrooms

Mari’s Lodging Home (In Front of Crystal Beach)
Entire Place • 3 bedrooms
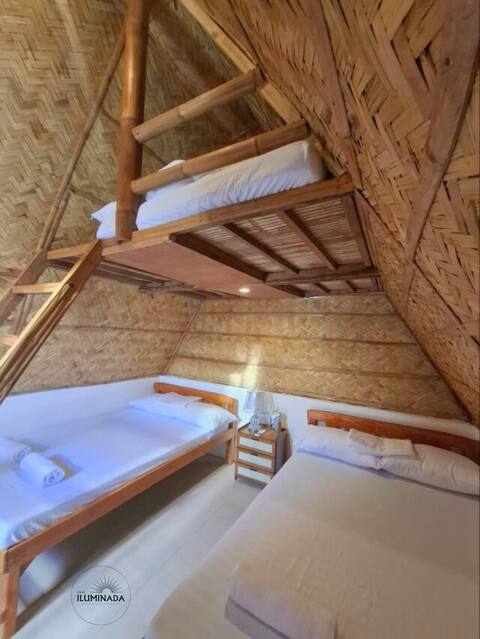
Villa Iluminada aircon huts for up to 6 pax
Private Room • N/A

Cozy Cabin under Pine Trees w/ Beach Access - 4
Entire Place • 1 bedroom
Note: Performance varies based on location, size, amenities, seasonality, and management quality. Data reflects the past 12 months.
Top Performing Airbnb Hosts in La Paz (2026)
Learn from the best! This table showcases top-performing Airbnb hosts in La Paz based on the number of properties managed and estimated total revenue over the past year. Analyze their scale and performance metrics.
| Host Name | Properties | Grossing Revenue | Stay Reviews | Avg Rating |
|---|---|---|---|---|
| Lou Ann | 3 | $25,844 | 28 | 4.97/5.0 |
| Joel | 1 | $12,122 | 8 | 4.25/5.0 |
| Jessa Mae | 5 | $10,688 | 88 | 4.61/5.0 |
| Joan | 2 | $6,876 | 50 | 4.86/5.0 |
| Jessa Mae | 1 | $6,115 | 52 | 4.42/5.0 |
| Maria Lourdes | 1 | $6,090 | 26 | 5.00/5.0 |
| Lianne | 2 | $4,667 | 10 | 4.52/5.0 |
| Daniel | 1 | $2,832 | 42 | 4.74/5.0 |
| KayCee | 1 | $1,743 | 19 | 4.37/5.0 |
| Jeremiah | 1 | $1,063 | 7 | 4.71/5.0 |
Analyzing the strategies of top hosts, such as their property selection, pricing, and guest communication, can offer valuable lessons for optimizing your own Airbnb operations in La Paz.
Dive Deeper: Advanced La Paz STR Market Data (2026)
Ready to unlock more insights? AirROI provides access to advanced metrics and comprehensive Airbnb data for La Paz. Explore detailed analytics beyond this report to refine your investment strategy, optimize pricing, and maximize your vacation rental profits.
Explore Advanced MetricsLa Paz Short-Term Rental Market Composition (2026): Property & Room Types
Room Type Distribution
Property Type Distribution
Market Composition Insights for La Paz
- The La Paz Airbnb market composition is heavily skewed towards Entire Home/Apt listings, which make up 57.9% of the 19 active rentals. This indicates strong guest preference for privacy and space.
- However, a notable 42.1% share for Private Rooms suggests opportunities for budget-conscious travelers or hosts renting out spare rooms.
- Looking at the property type distribution in La Paz, Outdoor/Unique properties are the most common (52.6%), reflecting the local real estate landscape.
- Houses represent a significant 15.8% portion, catering likely to families or larger groups.
- The presence of 21.1% Hotel/Boutique listings indicates integration with traditional hospitality.
La Paz Airbnb Room Capacity Analysis (2026): Bedroom Distribution
Distribution of Listings by Number of Bedrooms
Room Capacity Insights for La Paz
- The dominant room capacity in La Paz is 1 bedroom listings, making up 31.6% of the market. This suggests a strong demand for properties suitable for couples or solo travelers.
- Together, 1 bedroom and 3 bedrooms properties represent 42.1% of the active Airbnb listings in La Paz, indicating a high concentration in these sizes.
- A significant 21.1% of listings offer 3+ bedrooms, catering to larger groups and families seeking more space in La Paz.
La Paz Vacation Rental Guest Capacity Trends (2026)
Distribution of Listings by Guest Capacity
Guest Capacity Insights for La Paz
- The most common guest capacity trend in La Paz vacation rentals is listings accommodating 8+ guests (31.6%). This suggests the primary traveler segment is likely larger groups.
- Properties designed for 8+ guests and 3 guests dominate the La Paz STR market, accounting for 47.4% of listings.
- 31.6% of properties accommodate 6+ guests, serving the market segment for larger families or group travel in La Paz.
- On average, properties in La Paz are equipped to host 3.4 guests.
La Paz Airbnb Booking Patterns (2026): Available vs. Booked Days
Available Days Distribution
Booked Days Distribution
Booking Pattern Insights for La Paz
- The most common availability pattern in La Paz falls within the 271-366 days range, representing 94.7% of listings. This suggests many properties have significant open periods on their calendars.
- Approximately 100.0% of listings show high availability (181+ days open annually), indicating potential for increased bookings or specific owner usage patterns.
- For booked days, the 31-90 days range is most frequent in La Paz (68.4%), reflecting common guest stay durations or potential owner blocking patterns.
La Paz Airbnb Minimum Stay Requirements Analysis
Distribution of Listings by Minimum Night Requirement
1 Night
19 listings
100% of total
Key Insights
- The most prevalent minimum stay requirement in La Paz is 1 Night, adopted by 100% of listings. This highlights the market's preference for shorter, flexible bookings.
- A strong majority (100.0%) of the La Paz Airbnb data shows acceptance of very short stays (1-2 nights), indicating a dynamic, high-turnover market.
Recommendations
- Align with the market by considering a 1 Night minimum stay, as 100% of La Paz hosts use this setting.
- Adjust minimum nights based on seasonality – potentially shorter during low season and longer during peak demand periods in La Paz.
La Paz Airbnb Cancellation Policy Trends Analysis (2026)
Flexible
4 listings
21.1% of total
Moderate
3 listings
15.8% of total
Firm
5 listings
26.3% of total
Strict
7 listings
36.8% of total
Cancellation Policy Insights for La Paz
- The prevailing Airbnb cancellation policy trend in La Paz is Strict, used by 36.8% of listings.
- A majority (63.1%) of hosts in La Paz utilize Firm or Strict policies, indicating a market where hosts prioritize booking security.
Recommendations for Hosts
- Consider adopting a Strict policy to align with the 36.8% market standard in La Paz.
- With 36.8% using Strict terms, this is a viable option in La Paz, particularly for high-value properties or during peak demand periods.
- Regularly review your cancellation policy against competitors and market demand shifts in La Paz.
La Paz STR Booking Lead Time Analysis (2026)
Average Booking Lead Time by Month
Booking Lead Time Insights for La Paz
- The overall average booking lead time for vacation rentals in La Paz is 30 days.
- Guests book furthest in advance for stays during October (average 128 days), likely coinciding with peak travel demand or local events.
- The shortest booking windows occur for stays in September (average 9 days), indicating more last-minute travel plans during this time.
- Seasonally, Fall (52 days avg.) sees the longest lead times, while Spring (21 days avg.) has the shortest, reflecting typical travel planning cycles.
Recommendations for Hosts
- Use the overall average lead time (30 days) as a baseline for your pricing and availability strategy in La Paz.
- For October stays, consider implementing length-of-stay discounts or slightly higher rates for bookings made less than 128 days out to capitalize on advance planning.
- During September, focus on last-minute booking availability and promotions, as guests book with very short notice (9 days avg.).
- Target marketing efforts for the Fall season well in advance (at least 52 days) to capture early planners.
- Monitor your own booking lead times against these La Paz averages to identify opportunities for dynamic pricing adjustments.
Popular & Essential Airbnb Amenities in La Paz (2026)
Amenity Prevalence
Amenity Insights for La Paz
- Essential amenities in La Paz that guests expect include: Air conditioning, Pets allowed. Lacking these (any) could significantly impact bookings.
- Popular amenities like Beach access, Wifi, Free parking on premises are common but not universal. Offering these can provide a competitive edge.
- Warning: Wifi is not universally provided but is considered essential globally. Ensure reliable Wifi is offered.
Recommendations for Hosts
- Ensure your listing includes all essential amenities for La Paz: Air conditioning, Pets allowed.
- Consider adding popular differentiators like Beach access or Wifi to increase appeal.
- Highlight unique or less common amenities you offer (e.g., hot tub, dedicated workspace, EV charger) in your listing description and photos.
- Regularly check competitor amenities in La Paz to stay competitive.
La Paz Airbnb Guest Demographics & Profile Analysis (2026)
Guest Profile Summary for La Paz
- The typical guest profile for Airbnb in La Paz consists of primarily domestic travelers (91%), often arriving from nearby Manila, typically belonging to the Post-2000s (Gen Z/Alpha) group (50%), primarily speaking English or Tagalog.
- Domestic travelers account for 91.4% of guests.
- Key international markets include Philippines (91.4%) and Australia (2.9%).
- Top languages spoken are English (50%) followed by Tagalog (25%).
- A significant demographic segment is the Post-2000s (Gen Z/Alpha) group, representing 50% of guests.
Recommendations for Hosts
- Target domestic marketing efforts towards travelers from Manila and Quezon City.
- Tailor amenities and listing descriptions to appeal to the dominant Post-2000s (Gen Z/Alpha) demographic (e.g., highlight fast WiFi, smart home features, local guides).
- Highlight unique local experiences or amenities relevant to the primary guest profile.
- Consider seasonal promotions aligned with peak travel times for key origin markets.
Nearby Short-Term Rental Market Comparison
How does the La Paz Airbnb market stack up against its neighbors? Compare key performance metrics like average monthly revenue, ADR, and occupancy rates in surrounding areas to understand the broader regional STR landscape.
| Market | Active Properties | Monthly Revenue | Daily Rate | Avg. Occupancy |
|---|---|---|---|---|
| Bustos | 10 | $1,728 | $216.86 | 28% |
| Cabangan | 44 | $1,529 | $200.94 | 26% |
| Jalajala | 19 | $1,489 | $234.86 | 21% |
| Laoag | 17 | $1,412 | $158.39 | 33% |
| Beneg | 13 | $1,304 | $267.34 | 22% |
| Arew | 11 | $1,288 | $193.81 | 22% |
| Cabuyao | 25 | $1,202 | $114.93 | 36% |
| Binangonan | 49 | $1,191 | $135.12 | 29% |
| Porac | 51 | $1,157 | $203.91 | 21% |
| Los Baños | 158 | $1,129 | $242.23 | 21% |