Subic Airbnb Market Analysis 2026: Short Term Rental Data & Vacation Rental Statistics in Zambales, Philippines
Is Airbnb profitable in Subic in 2026? Explore comprehensive Airbnb analytics for Subic, Zambales, Philippines to uncover income potential. This 2026 STR market report for Subic, based on AirROI data from February 2025 to January 2026, reveals key trends in the niche market of 21 active listings.
Whether you're considering an Airbnb investment in Subic, optimizing your existing vacation rental, or exploring rental arbitrage opportunities, understanding the Subic Airbnb data is crucial. Leveraging the low regulation environment is key to maximizing your short term rental income potential. Let's dive into the specifics.
Key Subic Airbnb Performance Metrics Overview
Monthly Airbnb Revenue Variations & Income Potential in Subic (2026)
Understanding the monthly revenue variations for Airbnb listings in Subic is key to maximizing your short term rental income potential. Seasonality significantly impacts earnings. Our analysis, based on data from the past 12 months, shows that the peak revenue month for STRs in Subic is typically December, while September often presents the lowest earnings, highlighting opportunities for strategic pricing adjustments during shoulder and low seasons. Explore the typical Airbnb income in Subic across different performance tiers:
- Best-in-class properties (Top 10%) achieve $712+ monthly, often utilizing dynamic pricing and superior guest experiences.
- Strong performing properties (Top 25%) earn $496 or more, indicating effective management and desirable locations/amenities.
- Typical properties (Median) generate around $212 per month, representing the average market performance.
- Entry-level properties (Bottom 25%) see earnings around $98, often with potential for optimization.
Average Monthly Airbnb Earnings Trend in Subic
Subic Airbnb Occupancy Rate Trends (2026)
Maximize your bookings by understanding the Subic STR occupancy trends. Seasonal demand shifts significantly influence how often properties are booked. Typically, Decembersees the highest demand (peak season occupancy), while September experiences the lowest (low season). Effective strategies, like adjusting minimum stays or offering promotions, can boost occupancy during slower periods. Here's how different property tiers perform in Subic:
- Best-in-class properties (Top 10%) achieve 40%+ occupancy, indicating high desirability and potentially optimized availability.
- Strong performing properties (Top 25%) maintain 27% or higher occupancy, suggesting good market fit and guest satisfaction.
- Typical properties (Median) have an occupancy rate around 15%.
- Entry-level properties (Bottom 25%) average 8% occupancy, potentially facing higher vacancy.
Average Monthly Occupancy Rate Trend in Subic
Average Daily Rate (ADR) Airbnb Trends in Subic (2026)
Effective short term rental pricing strategy in Subic involves understanding monthly ADR fluctuations. The Average Daily Rate (ADR) for Airbnb in Subic typically peaks in September and dips lowest during January. Leveraging Airbnb dynamic pricing tools or strategies based on this seasonality can significantly boost revenue. Here's a look at the typical nightly rates achieved:
- Best-in-class properties (Top 10%) command rates of $103+ per night, often due to premium features or locations.
- Strong performing properties (Top 25%) achieve nightly rates of $79 or more.
- Typical properties (Median) charge around $55 per night.
- Entry-level properties (Bottom 25%) earn around $31 per night.
Average Daily Rate (ADR) Trend by Month in Subic
Get Live Subic Market Intelligence 👇

Explore Real-time Analytics
Airbnb Seasonality Analysis & Trends in Subic (2026)
Peak Season (December, February, May)
- Revenue averages $494 per month
- Occupancy rates average 26.3%
- Daily rates average $67
Shoulder Season
- Revenue averages $367 per month
- Occupancy maintains around 19.0%
- Daily rates hold near $68
Low Season (January, September, October)
- Revenue drops to average $174 per month
- Occupancy decreases to average 13.2%
- Daily rates adjust to average $65
Seasonality Insights for Subic
- The Airbnb seasonality in Subic shows highly seasonal trends requiring careful strategy. While the sections above show seasonal averages, it's also insightful to look at the extremes:
- During the high season, the absolute peak month showcases Subic's highest earning potential, with monthly revenues capable of climbing to $512, occupancy reaching a high of 33.9%, and ADRs peaking at $71.
- Conversely, the slowest single month of the year, typically falling within the low season, marks the market's lowest point. In this month, revenue might dip to $130, occupancy could drop to 9.7%, and ADRs may adjust down to $61.
- Understanding both the seasonal averages and these monthly peaks and troughs in revenue, occupancy, and ADR is crucial for maximizing your Airbnb profit potential in Subic.
Seasonal Strategies for Maximizing Profit
- Peak Season: Maximize revenue through premium pricing and potentially longer minimum stays. Ensure high availability.
- Low Season: Offer competitive pricing, special promotions (e.g., extended stay discounts), and flexible cancellation policies. Target off-season travelers like remote workers or budget-conscious guests.
- Shoulder Seasons: Implement dynamic pricing that balances peak and low rates. Target weekend travelers or specific events. Offer slightly more flexible terms than peak season.
- Regularly analyze your own performance against these Subic seasonality benchmarks and adjust your pricing and availability strategy accordingly.
Best Areas for Airbnb Investment in Subic (2026)
Exploring the top neighborhoods for short-term rentals in Subic? This section highlights key areas, outlining why they are attractive for hosts and guests, along with notable local attractions. Consider these locations based on your target guest profile and investment strategy.
| Neighborhood / Area | Why Host Here? (Target Guests & Appeal) | Key Attractions & Landmarks |
|---|---|---|
| Baloy Beach | Popular beach destination known for its beautiful sunset views and vibrant nightlife. It’s the go-to spot for both locals and tourists seeking beach activities and relaxation. | Baloy Beach, Subic Bay Marine Exploratorium, Zoobic Safari, Subic Bay Freeport Zone, Ocean Adventure |
| Subic Bay Freeport Zone | A bustling freeport area that attracts business and tourism. Offers a mix of shopping, dining, and recreational activities which appeal to a wide range of visitors. | Royal duty-free shops, El Kabayo, Inflatable Island, Subic Bay Yacht Club, Treetop Adventure |
| Camayan Beach | A serene beach destination ideal for family vacations and outdoor activities. Known for a more tranquil experience compared to nearby areas and close to attractions like Ocean Adventure. | Camayan Beach Resort, Ocean Adventure, Subic Bay Freeport Zone, Zoobic Safari |
| Ilanin Forest | A unique area offering a blend of nature and adventure activities, popular among eco-tourists and families looking for outdoor fun and relaxation. | Eco-tours, Camping sites, Nature trails, Animal encounters |
| Forest Adventure | Adventure enthusiasts flock to this area for its thrilling outdoor activities such as zip lining and obstacle courses, perfect for group retreats and team-building. | Zipline rides, Obstacle course, Team building events, Nature trails |
| Sierra Beach | Known for its more secluded beaches and beautiful views, Sierra Beach attracts visitors looking for a peaceful getaway away from the crowds. | Sierra Beach, Scuba diving, Snorkeling spots, Hiking trails |
| Subic Bay Yacht Club | A luxurious area that caters to yacht enthusiasts and offers high-end dining and leisure activities, perfect for upscale travelers seeking a luxurious stay. | Yacht rentals, Luxury dining, Subic Bay marina, Water sports |
| The Lighthouse Marina Resort | A premium accommodation option known for its unique design and upscale amenities. It attracts both leisure and business travelers looking for comfort and modern design. | Lighthouse Tower, Swimming pool, Restaurant with a view, Spa services |
Understanding Airbnb License Requirements & STR Laws in Subic (2026)
While Subic, Zambales, Philippines currently shows low STR regulations, specific Airbnb license requirements might still exist or change. Always verify the latest short term rental regulations and Airbnb license requirements directly with local government authorities for Subic to ensure full compliance before hosting.
(Source: AirROI data, 2026, finding no licensed listings among those analyzed)
Top Performing Airbnb Properties in Subic (2026)
Benchmark your potential! Explore examples of top-performing Airbnb properties in Subicbased on Trailing Twelve Month (TTM) revenue. Analyze their characteristics, revenue, occupancy rate, and ADR to understand what drives success in this market.
Seaside Villa for 16 pax with Netflix and Wi-fi
Entire Place • 4 bedrooms
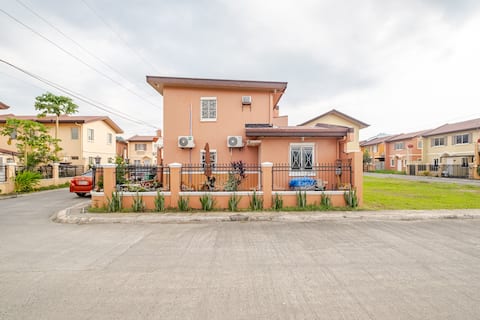
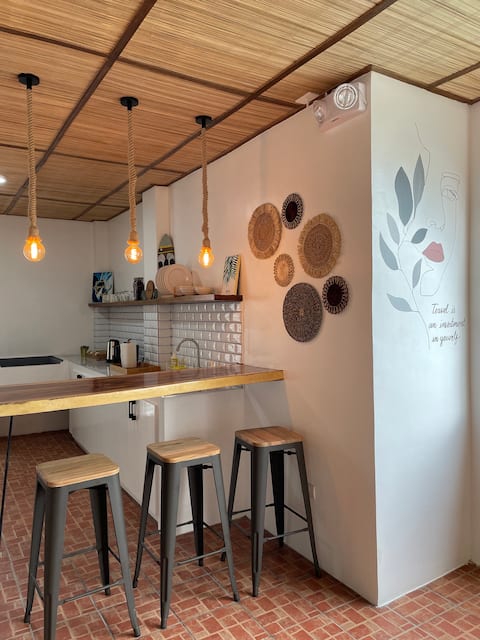
Cozy Corner Camella Subic| Perfect for Groups
Entire Place • 2 bedrooms
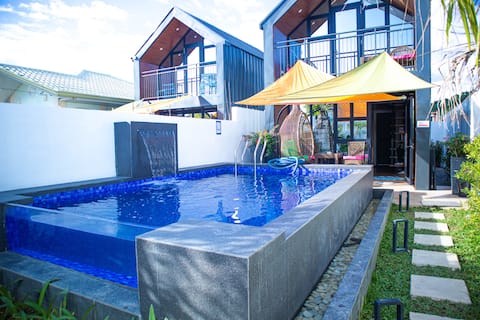
Hidden Haven Korean-Themed Villa Infinity Pool
Entire Place • 1 bedroom

Hidden Haven Subic Villa w/ Infinity Pool
Entire Place • 1 bedroom
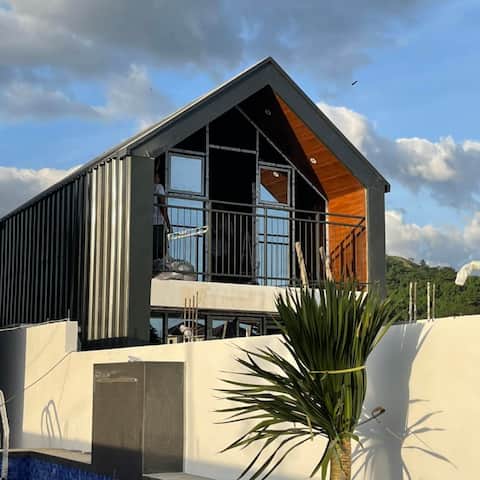
Hidden Haven Serene Mediterranean-Inspired Villa
Entire Place • 1 bedroom

Casa Brillantes
Entire Place • 1 bedroom
Note: Performance varies based on location, size, amenities, seasonality, and management quality. Data reflects the past 12 months.
Top Performing Airbnb Hosts in Subic (2026)
Learn from the best! This table showcases top-performing Airbnb hosts in Subic based on the number of properties managed and estimated total revenue over the past year. Analyze their scale and performance metrics.
| Host Name | Properties | Grossing Revenue | Stay Reviews | Avg Rating |
|---|---|---|---|---|
| Michelle | 3 | $15,335 | 14 | 4.44/5.0 |
| Camille | 8 | $13,836 | 388 | 4.63/5.0 |
| Karen Dale | 1 | $7,952 | 70 | 4.87/5.0 |
| Fei | 1 | $3,526 | 8 | 4.75/5.0 |
| Flora | 3 | $3,178 | 117 | 4.90/5.0 |
| Sally | 2 | $3,064 | 225 | 4.63/5.0 |
| Edwin | 1 | $2,364 | 34 | 4.91/5.0 |
| Christopher | 1 | $1,619 | 33 | 4.61/5.0 |
| Lyn | 1 | $247 | 2 | Not Rated |
Analyzing the strategies of top hosts, such as their property selection, pricing, and guest communication, can offer valuable lessons for optimizing your own Airbnb operations in Subic.
Dive Deeper: Advanced Subic STR Market Data (2026)
Ready to unlock more insights? AirROI provides access to advanced metrics and comprehensive Airbnb data for Subic. Explore detailed analytics beyond this report to refine your investment strategy, optimize pricing, and maximize your vacation rental profits.
Explore Advanced MetricsSubic Short-Term Rental Market Composition (2026): Property & Room Types
Room Type Distribution
Property Type Distribution
Market Composition Insights for Subic
- The Subic Airbnb market composition is heavily skewed towards Private Room listings, which make up 52.4% of the 21 active rentals. This indicates strong guest preference for privacy and space.
- Looking at the property type distribution in Subic, House properties are the most common (57.1%), reflecting the local real estate landscape.
- Houses represent a significant 57.1% portion, catering likely to families or larger groups.
- Smaller segments like hotel/boutique (combined 4.8%) offer potential for unique stay experiences.
Subic Airbnb Room Capacity Analysis (2026): Bedroom Distribution
Distribution of Listings by Number of Bedrooms
Room Capacity Insights for Subic
- The dominant room capacity in Subic is 1 bedroom listings, making up 23.8% of the market. This suggests a strong demand for properties suitable for couples or solo travelers.
- Together, 1 bedroom and 4 bedrooms properties represent 38.1% of the active Airbnb listings in Subic, indicating a high concentration in these sizes.
- A significant 38.1% of listings offer 3+ bedrooms, catering to larger groups and families seeking more space in Subic.
Subic Vacation Rental Guest Capacity Trends (2026)
Distribution of Listings by Guest Capacity
Guest Capacity Insights for Subic
- The most common guest capacity trend in Subic vacation rentals is listings accommodating 8+ guests (38.1%). This suggests the primary traveler segment is likely larger groups.
- Properties designed for 8+ guests and 2 guests dominate the Subic STR market, accounting for 66.7% of listings.
- 38.1% of properties accommodate 6+ guests, serving the market segment for larger families or group travel in Subic.
- On average, properties in Subic are equipped to host 3.8 guests.
Subic Airbnb Booking Patterns (2026): Available vs. Booked Days
Available Days Distribution
Booked Days Distribution
Booking Pattern Insights for Subic
- The most common availability pattern in Subic falls within the 271-366 days range, representing 95.2% of listings. This suggests many properties have significant open periods on their calendars.
- Approximately 100.0% of listings show high availability (181+ days open annually), indicating potential for increased bookings or specific owner usage patterns.
- For booked days, the 1-30 days range is most frequent in Subic (47.6%), reflecting common guest stay durations or potential owner blocking patterns.
Subic Airbnb Minimum Stay Requirements Analysis
Distribution of Listings by Minimum Night Requirement
1 Night
21 listings
100% of total
Key Insights
- The most prevalent minimum stay requirement in Subic is 1 Night, adopted by 100% of listings. This highlights the market's preference for shorter, flexible bookings.
- A strong majority (100.0%) of the Subic Airbnb data shows acceptance of very short stays (1-2 nights), indicating a dynamic, high-turnover market.
Recommendations
- Align with the market by considering a 1 Night minimum stay, as 100% of Subic hosts use this setting.
- Adjust minimum nights based on seasonality – potentially shorter during low season and longer during peak demand periods in Subic.
Subic Airbnb Cancellation Policy Trends Analysis (2026)
Flexible
13 listings
61.9% of total
Moderate
1 listings
4.8% of total
Firm
5 listings
23.8% of total
Strict
2 listings
9.5% of total
Cancellation Policy Insights for Subic
- The prevailing Airbnb cancellation policy trend in Subic is Flexible, used by 61.9% of listings.
- There's a relatively balanced mix between guest-friendly (66.7%) and stricter (33.3%) policies, offering choices for different guest needs.
- Strict cancellation policies are quite rare (9.5%), potentially making listings with this policy less competitive unless justified by high demand or property type.
Recommendations for Hosts
- Consider adopting a Flexible policy to align with the 61.9% market standard in Subic.
- Given the high prevalence of Flexible policies (61.9%), offering this can enhance booking appeal, especially during shoulder seasons.
- Using a Strict policy might deter some guests, as only 9.5% of listings use it. Evaluate if potential revenue protection outweighs possible lower booking rates.
- Regularly review your cancellation policy against competitors and market demand shifts in Subic.
Subic STR Booking Lead Time Analysis (2026)
Average Booking Lead Time by Month
Booking Lead Time Insights for Subic
- The overall average booking lead time for vacation rentals in Subic is 14 days.
- Guests book furthest in advance for stays during September (average 31 days), likely coinciding with peak travel demand or local events.
- The shortest booking windows occur for stays in October (average 7 days), indicating more last-minute travel plans during this time.
- Seasonally, Fall (22 days avg.) sees the longest lead times, while Spring (10 days avg.) has the shortest, reflecting typical travel planning cycles.
Recommendations for Hosts
- Use the overall average lead time (14 days) as a baseline for your pricing and availability strategy in Subic.
- For September stays, consider implementing length-of-stay discounts or slightly higher rates for bookings made less than 31 days out to capitalize on advance planning.
- Target marketing efforts for the Fall season well in advance (at least 22 days) to capture early planners.
- Monitor your own booking lead times against these Subic averages to identify opportunities for dynamic pricing adjustments.
Popular & Essential Airbnb Amenities in Subic (2026)
Amenity Prevalence
Amenity Insights for Subic
- Essential amenities in Subic that guests expect include: Air conditioning, Kitchen, Free parking on premises, Wifi, TV. Lacking these (any) could significantly impact bookings.
- Popular amenities like Cooking basics, Dedicated workspace, Dishes and silverware are common but not universal. Offering these can provide a competitive edge.
Recommendations for Hosts
- Ensure your listing includes all essential amenities for Subic: Air conditioning, Kitchen, Free parking on premises, Wifi, TV.
- Consider adding popular differentiators like Cooking basics or Dedicated workspace to increase appeal.
- Highlight unique or less common amenities you offer (e.g., hot tub, dedicated workspace, EV charger) in your listing description and photos.
- Regularly check competitor amenities in Subic to stay competitive.
Subic Airbnb Guest Demographics & Profile Analysis (2026)
Guest Profile Summary for Subic
- The typical guest profile for Airbnb in Subic consists of primarily domestic travelers (80%), often arriving from nearby Quezon City, typically belonging to the Post-2000s (Gen Z/Alpha) group (50%), primarily speaking English or Filipino.
- Domestic travelers account for 80.0% of guests.
- Key international markets include Philippines (80%) and United States (5.7%).
- Top languages spoken are English (54.8%) followed by Filipino (25.8%).
- A significant demographic segment is the Post-2000s (Gen Z/Alpha) group, representing 50% of guests.
Recommendations for Hosts
- Target domestic marketing efforts towards travelers from Quezon City and Valenzuela.
- Tailor amenities and listing descriptions to appeal to the dominant Post-2000s (Gen Z/Alpha) demographic (e.g., highlight fast WiFi, smart home features, local guides).
- Highlight unique local experiences or amenities relevant to the primary guest profile.
- Consider seasonal promotions aligned with peak travel times for key origin markets.
Nearby Short-Term Rental Market Comparison
How does the Subic Airbnb market stack up against its neighbors? Compare key performance metrics like average monthly revenue, ADR, and occupancy rates in surrounding areas to understand the broader regional STR landscape.
| Market | Active Properties | Monthly Revenue | Daily Rate | Avg. Occupancy |
|---|---|---|---|---|
| Bustos | 10 | $1,728 | $216.86 | 28% |
| Cabangan | 44 | $1,529 | $200.94 | 26% |
| Lian | 121 | $1,491 | $216.20 | 24% |
| Jalajala | 19 | $1,489 | $234.86 | 21% |
| Laoag | 17 | $1,412 | $158.39 | 33% |
| Beneg | 13 | $1,304 | $267.34 | 22% |
| Arew | 11 | $1,288 | $193.81 | 22% |
| Cabuyao | 25 | $1,202 | $114.93 | 36% |
| Binangonan | 49 | $1,191 | $135.12 | 29% |
| Porac | 51 | $1,157 | $203.91 | 21% |