Zamboanga City Airbnb Market Analysis 2026: Short Term Rental Data & Vacation Rental Statistics in Zamboanga Peninsula, Philippines
Is Airbnb profitable in Zamboanga City in 2026? Explore comprehensive Airbnb analytics for Zamboanga City, Zamboanga Peninsula, Philippines to uncover income potential. This 2026 STR market report for Zamboanga City, based on AirROI data from February 2025 to January 2026, reveals key trends in the niche market of 37 active listings.
Whether you're considering an Airbnb investment in Zamboanga City, optimizing your existing vacation rental, or exploring rental arbitrage opportunities, understanding the Zamboanga City Airbnb data is crucial. Leveraging the low regulation environment is key to maximizing your short term rental income potential. Let's dive into the specifics.
Key Zamboanga City Airbnb Performance Metrics Overview
Monthly Airbnb Revenue Variations & Income Potential in Zamboanga City (2026)
Understanding the monthly revenue variations for Airbnb listings in Zamboanga City is key to maximizing your short term rental income potential. Seasonality significantly impacts earnings. Our analysis, based on data from the past 12 months, shows that the peak revenue month for STRs in Zamboanga City is typically December, while January often presents the lowest earnings, highlighting opportunities for strategic pricing adjustments during shoulder and low seasons. Explore the typical Airbnb income in Zamboanga City across different performance tiers:
- Best-in-class properties (Top 10%) achieve $745+ monthly, often utilizing dynamic pricing and superior guest experiences.
- Strong performing properties (Top 25%) earn $437 or more, indicating effective management and desirable locations/amenities.
- Typical properties (Median) generate around $243 per month, representing the average market performance.
- Entry-level properties (Bottom 25%) see earnings around $129, often with potential for optimization.
Average Monthly Airbnb Earnings Trend in Zamboanga City
Zamboanga City Airbnb Occupancy Rate Trends (2026)
Maximize your bookings by understanding the Zamboanga City STR occupancy trends. Seasonal demand shifts significantly influence how often properties are booked. Typically, Maysees the highest demand (peak season occupancy), while January experiences the lowest (low season). Effective strategies, like adjusting minimum stays or offering promotions, can boost occupancy during slower periods. Here's how different property tiers perform in Zamboanga City:
- Best-in-class properties (Top 10%) achieve 55%+ occupancy, indicating high desirability and potentially optimized availability.
- Strong performing properties (Top 25%) maintain 40% or higher occupancy, suggesting good market fit and guest satisfaction.
- Typical properties (Median) have an occupancy rate around 20%.
- Entry-level properties (Bottom 25%) average 12% occupancy, potentially facing higher vacancy.
Average Monthly Occupancy Rate Trend in Zamboanga City
Average Daily Rate (ADR) Airbnb Trends in Zamboanga City (2026)
Effective short term rental pricing strategy in Zamboanga City involves understanding monthly ADR fluctuations. The Average Daily Rate (ADR) for Airbnb in Zamboanga City typically peaks in December and dips lowest during April. Leveraging Airbnb dynamic pricing tools or strategies based on this seasonality can significantly boost revenue. Here's a look at the typical nightly rates achieved:
- Best-in-class properties (Top 10%) command rates of $73+ per night, often due to premium features or locations.
- Strong performing properties (Top 25%) achieve nightly rates of $62 or more.
- Typical properties (Median) charge around $39 per night.
- Entry-level properties (Bottom 25%) earn around $22 per night.
Average Daily Rate (ADR) Trend by Month in Zamboanga City
Get Live Zamboanga City Market Intelligence 👇

Explore Real-time Analytics
Airbnb Seasonality Analysis & Trends in Zamboanga City (2026)
Peak Season (December, April, October)
- Revenue averages $408 per month
- Occupancy rates average 29.6%
- Daily rates average $46
Shoulder Season
- Revenue averages $350 per month
- Occupancy maintains around 27.5%
- Daily rates hold near $43
Low Season (January, July, September)
- Revenue drops to average $229 per month
- Occupancy decreases to average 21.2%
- Daily rates adjust to average $44
Seasonality Insights for Zamboanga City
- The Airbnb seasonality in Zamboanga City shows moderate seasonality with distinct peak and low periods. While the sections above show seasonal averages, it's also insightful to look at the extremes:
- During the high season, the absolute peak month showcases Zamboanga City's highest earning potential, with monthly revenues capable of climbing to $421, occupancy reaching a high of 31.7%, and ADRs peaking at $49.
- Conversely, the slowest single month of the year, typically falling within the low season, marks the market's lowest point. In this month, revenue might dip to $199, occupancy could drop to 18.3%, and ADRs may adjust down to $41.
- Understanding both the seasonal averages and these monthly peaks and troughs in revenue, occupancy, and ADR is crucial for maximizing your Airbnb profit potential in Zamboanga City.
Seasonal Strategies for Maximizing Profit
- Peak Season: Maximize revenue through premium pricing and potentially longer minimum stays. Ensure high availability.
- Low Season: Offer competitive pricing, special promotions (e.g., extended stay discounts), and flexible cancellation policies. Target off-season travelers like remote workers or budget-conscious guests.
- Shoulder Seasons: Implement dynamic pricing that balances peak and low rates. Target weekend travelers or specific events. Offer slightly more flexible terms than peak season.
- Regularly analyze your own performance against these Zamboanga City seasonality benchmarks and adjust your pricing and availability strategy accordingly.
Best Areas for Airbnb Investment in Zamboanga City (2026)
Exploring the top neighborhoods for short-term rentals in Zamboanga City? This section highlights key areas, outlining why they are attractive for hosts and guests, along with notable local attractions. Consider these locations based on your target guest profile and investment strategy.
| Neighborhood / Area | Why Host Here? (Target Guests & Appeal) | Key Attractions & Landmarks |
|---|---|---|
| Pasonanca | A serene neighborhood known for its natural beauty and Pasonanca Park, attracting eco-tourists and families looking for peaceful retreats. | Pasonanca Park, Zamboanga City Botanical Garden, Bamboo Park, Pasonanca Ancestral House, The Grandstand at Pasonanca Park |
| Downtown Zamboanga | The bustling center of the city, featuring a mix of cultural sites and commercial establishments. Ideal for travelers wanting to experience the local life and cuisine. | Fort Pilar, Casa Grande, Zamboanga City Hall, Mercado de Abastos, Bunggayan Festival |
| Zamboanga Ecozone | A developing area with a focus on business and tourism, perfect for guests looking for modern amenities and a more urban experience. | Zamboanga Ecozone Authority, Zamboanga International Airport, Mindanao State University - Zamboanga |
| Luyungan | Known for its beachfront properties and resorts. Attracts tourists wanting leisure and relaxation by the water. | Luyungan Beach Resort, Punta del Sol Beach Resort, Zambowood Beach |
| Recodo | A quiet residential area that's close to the beach; appealing for families and visitors seeking a calm environment with beach access. | Recodo Beach, Bongao Island, Sibugay River |
| Ayala | A growing commercial district with shopping malls and dining options, attractive for those looking for local flavor and convenience. | Ayala District Mall, Zamboanga City Coliseum, Local eateries and markets |
| Santa Cruz | A historical area with cultural significance and accessibility to various attractions, making it appealing for tourists. | Basilan Island views, Historical sites, Street markets |
| Cawit | A coastal village ideal for relaxing stays and seafood dining, appealing to tourists who enjoy fresh catches and local culture. | Cawit Beach, Local fish markets, Cultural performances |
Understanding Airbnb License Requirements & STR Laws in Zamboanga City (2026)
While Zamboanga City, Zamboanga Peninsula, Philippines currently shows low STR regulations, specific Airbnb license requirements might still exist or change. Always verify the latest short term rental regulations and Airbnb license requirements directly with local government authorities for Zamboanga City to ensure full compliance before hosting.
(Source: AirROI data, 2026, finding no licensed listings among those analyzed)
Top Performing Airbnb Properties in Zamboanga City (2026)
Benchmark your potential! Explore examples of top-performing Airbnb properties in Zamboanga Citybased on Trailing Twelve Month (TTM) revenue. Analyze their characteristics, revenue, occupancy rate, and ADR to understand what drives success in this market.
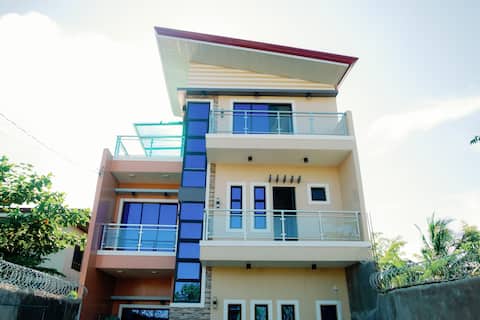
Rb's Three Storey House
Entire Place • 3 bedrooms

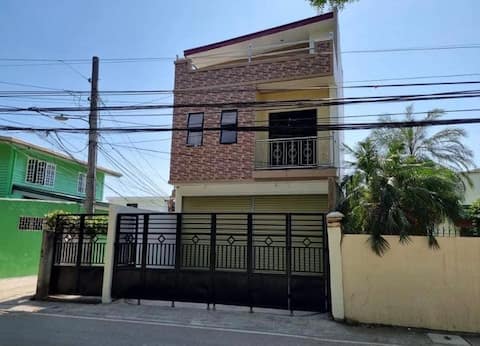
Chicco's Spacious & Private Two-Storey Home
Entire Place • 1 bedroom

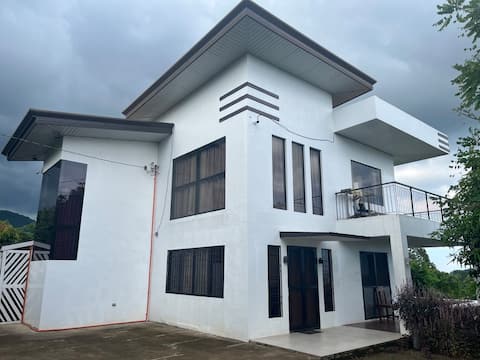
AGC Executive Studio - Rooftop Access
Entire Place • 2 bedrooms
A guesthouse like your house 3
Entire Place • 2 bedrooms
Beautiful 3 bedroom vacation home with view.
Entire Place • 3 bedrooms

Mercedes Luxury Airbnb + karaoke
Entire Place • 2 bedrooms
Note: Performance varies based on location, size, amenities, seasonality, and management quality. Data reflects the past 12 months.
Top Performing Airbnb Hosts in Zamboanga City (2026)
Learn from the best! This table showcases top-performing Airbnb hosts in Zamboanga City based on the number of properties managed and estimated total revenue over the past year. Analyze their scale and performance metrics.
| Host Name | Properties | Grossing Revenue | Stay Reviews | Avg Rating |
|---|---|---|---|---|
| Melba | 4 | $17,565 | 59 | 4.94/5.0 |
| Philippines Apartelle | 6 | $11,911 | 60 | 4.71/5.0 |
| Sam | 3 | $10,582 | 49 | 4.93/5.0 |
| Danna Joyce | 1 | $7,277 | 25 | 5.00/5.0 |
| Raul | 2 | $7,023 | 19 | 4.83/5.0 |
| Ryan | 1 | $5,539 | 22 | 4.73/5.0 |
| Nancy | 2 | $5,453 | 17 | 5.00/5.0 |
| Vincent Paul | 2 | $4,692 | 105 | 4.93/5.0 |
| Mk | 2 | $3,784 | 36 | 4.06/5.0 |
| Ahmad Habbisi | 2 | $2,385 | 27 | 4.34/5.0 |
Analyzing the strategies of top hosts, such as their property selection, pricing, and guest communication, can offer valuable lessons for optimizing your own Airbnb operations in Zamboanga City.
Dive Deeper: Advanced Zamboanga City STR Market Data (2026)
Ready to unlock more insights? AirROI provides access to advanced metrics and comprehensive Airbnb data for Zamboanga City. Explore detailed analytics beyond this report to refine your investment strategy, optimize pricing, and maximize your vacation rental profits.
Explore Advanced MetricsZamboanga City Short-Term Rental Market Composition (2026): Property & Room Types
Room Type Distribution
Property Type Distribution
Market Composition Insights for Zamboanga City
- The Zamboanga City Airbnb market composition is heavily skewed towards Entire Home/Apt listings, which make up 70.3% of the 37 active rentals. This indicates strong guest preference for privacy and space.
- Looking at the property type distribution in Zamboanga City, House properties are the most common (45.9%), reflecting the local real estate landscape.
- Houses represent a significant 45.9% portion, catering likely to families or larger groups.
- The presence of 16.2% Hotel/Boutique listings indicates integration with traditional hospitality.
- Smaller segments like others (combined 2.7%) offer potential for unique stay experiences.
Zamboanga City Airbnb Room Capacity Analysis (2026): Bedroom Distribution
Distribution of Listings by Number of Bedrooms
Room Capacity Insights for Zamboanga City
- The dominant room capacity in Zamboanga City is 2 bedrooms listings, making up 45.9% of the market. This suggests a strong demand for properties suitable for couples or solo travelers.
- Together, 2 bedrooms and 1 bedroom properties represent 75.6% of the active Airbnb listings in Zamboanga City, indicating a high concentration in these sizes.
Zamboanga City Vacation Rental Guest Capacity Trends (2026)
Distribution of Listings by Guest Capacity
Guest Capacity Insights for Zamboanga City
- The most common guest capacity trend in Zamboanga City vacation rentals is listings accommodating 4 guests (35.1%). This suggests the primary traveler segment is likely small families or groups.
- Properties designed for 4 guests and 8+ guests dominate the Zamboanga City STR market, accounting for 51.3% of listings.
- 29.7% of properties accommodate 6+ guests, serving the market segment for larger families or group travel in Zamboanga City.
- On average, properties in Zamboanga City are equipped to host 4.0 guests.
Zamboanga City Airbnb Booking Patterns (2026): Available vs. Booked Days
Available Days Distribution
Booked Days Distribution
Booking Pattern Insights for Zamboanga City
- The most common availability pattern in Zamboanga City falls within the 271-366 days range, representing 78.4% of listings. This suggests many properties have significant open periods on their calendars.
- Approximately 97.3% of listings show high availability (181+ days open annually), indicating potential for increased bookings or specific owner usage patterns.
- For booked days, the 1-30 days range is most frequent in Zamboanga City (40.5%), reflecting common guest stay durations or potential owner blocking patterns.
- A notable 2.7% of properties secure long booking periods (181+ days booked per year), highlighting successful long-term rental strategies or significant owner usage.
Zamboanga City Airbnb Minimum Stay Requirements Analysis
Distribution of Listings by Minimum Night Requirement
1 Night
24 listings
64.9% of total
2 Nights
8 listings
21.6% of total
30+ Nights
5 listings
13.5% of total
Key Insights
- The most prevalent minimum stay requirement in Zamboanga City is 1 Night, adopted by 64.9% of listings. This highlights the market's preference for shorter, flexible bookings.
- A strong majority (86.5%) of the Zamboanga City Airbnb data shows acceptance of very short stays (1-2 nights), indicating a dynamic, high-turnover market.
- A significant segment (13.5%) caters to monthly stays (30+ nights) in Zamboanga City, pointing to opportunities in the extended-stay market.
Recommendations
- Align with the market by considering a 1 Night minimum stay, as 64.9% of Zamboanga City hosts use this setting.
- Explore offering discounts for stays of 30+ nights to attract the 13.5% of the market seeking extended stays.
- Adjust minimum nights based on seasonality – potentially shorter during low season and longer during peak demand periods in Zamboanga City.
Zamboanga City Airbnb Cancellation Policy Trends Analysis (2026)
Flexible
14 listings
37.8% of total
Moderate
16 listings
43.2% of total
Firm
3 listings
8.1% of total
Strict
4 listings
10.8% of total
Cancellation Policy Insights for Zamboanga City
- The prevailing Airbnb cancellation policy trend in Zamboanga City is Moderate, used by 43.2% of listings.
- The market strongly favors guest-friendly terms, with 81.0% of listings offering Flexible or Moderate policies. This suggests guests in Zamboanga City may expect booking flexibility.
Recommendations for Hosts
- Consider adopting a Moderate policy to align with the 43.2% market standard in Zamboanga City.
- Using a Strict policy might deter some guests, as only 10.8% of listings use it. Evaluate if potential revenue protection outweighs possible lower booking rates.
- Regularly review your cancellation policy against competitors and market demand shifts in Zamboanga City.
Zamboanga City STR Booking Lead Time Analysis (2026)
Average Booking Lead Time by Month
Booking Lead Time Insights for Zamboanga City
- The overall average booking lead time for vacation rentals in Zamboanga City is 21 days.
- Guests book furthest in advance for stays during March (average 35 days), likely coinciding with peak travel demand or local events.
- The shortest booking windows occur for stays in November (average 10 days), indicating more last-minute travel plans during this time.
- Seasonally, Spring (22 days avg.) sees the longest lead times, while Fall (14 days avg.) has the shortest, reflecting typical travel planning cycles.
Recommendations for Hosts
- Use the overall average lead time (21 days) as a baseline for your pricing and availability strategy in Zamboanga City.
- For March stays, consider implementing length-of-stay discounts or slightly higher rates for bookings made less than 35 days out to capitalize on advance planning.
- During November, focus on last-minute booking availability and promotions, as guests book with very short notice (10 days avg.).
- Target marketing efforts for the Spring season well in advance (at least 22 days) to capture early planners.
- Monitor your own booking lead times against these Zamboanga City averages to identify opportunities for dynamic pricing adjustments.
Popular & Essential Airbnb Amenities in Zamboanga City (2026)
Amenity Prevalence
Amenity Insights for Zamboanga City
- Essential amenities in Zamboanga City that guests expect include: Air conditioning. Lacking these (this) could significantly impact bookings.
- Popular amenities like Free parking on premises, Wifi, Hangers are common but not universal. Offering these can provide a competitive edge.
- Warning: Wifi is not universally provided but is considered essential globally. Ensure reliable Wifi is offered.
Recommendations for Hosts
- Ensure your listing includes all essential amenities for Zamboanga City: Air conditioning.
- Prioritize adding missing essentials: Air conditioning.
- Consider adding popular differentiators like Free parking on premises or Wifi to increase appeal.
- Highlight unique or less common amenities you offer (e.g., hot tub, dedicated workspace, EV charger) in your listing description and photos.
- Regularly check competitor amenities in Zamboanga City to stay competitive.
Zamboanga City Airbnb Guest Demographics & Profile Analysis (2026)
Guest Profile Summary for Zamboanga City
- The typical guest profile for Airbnb in Zamboanga City consists of a mix of domestic (59%) and international guests, often arriving from nearby Davao City, typically belonging to the Post-2000s (Gen Z/Alpha) group (50%), primarily speaking English or Tagalog.
- Domestic travelers account for 58.6% of guests.
- Key international markets include Philippines (58.6%) and United States (19%).
- Top languages spoken are English (49.3%) followed by Tagalog (12.3%).
- A significant demographic segment is the Post-2000s (Gen Z/Alpha) group, representing 50% of guests.
Recommendations for Hosts
- Balance marketing efforts between domestic and international channels based on the guest mix.
- Tailor amenities and listing descriptions to appeal to the dominant Post-2000s (Gen Z/Alpha) demographic (e.g., highlight fast WiFi, smart home features, local guides).
- Highlight unique local experiences or amenities relevant to the primary guest profile.
- Consider seasonal promotions aligned with peak travel times for key origin markets.
Nearby Short-Term Rental Market Comparison
How does the Zamboanga City Airbnb market stack up against its neighbors? Compare key performance metrics like average monthly revenue, ADR, and occupancy rates in surrounding areas to understand the broader regional STR landscape.
| Market | Active Properties | Monthly Revenue | Daily Rate | Avg. Occupancy |
|---|---|---|---|---|
| Pagadian | 18 | $109 | $30.23 | 19% |