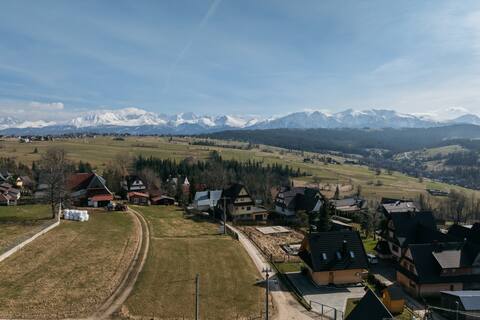
Ząb Airbnb Market Analysis 2026: Short Term Rental Data & Vacation Rental Statistics in Lesser Poland Voivodeship, Poland
Is Airbnb profitable in Ząb in 2026? Explore comprehensive Airbnb analytics for Ząb, Lesser Poland Voivodeship, Poland to uncover income potential. This 2026 STR market report for Ząb, based on AirROI data from February 2025 to January 2026, reveals key trends in the niche market of 50 active listings.
Whether you're considering an Airbnb investment in Ząb, optimizing your existing vacation rental, or exploring rental arbitrage opportunities, understanding the Ząb Airbnb data is crucial. Leveraging the low regulation environment is key to maximizing your short term rental income potential. Let's dive into the specifics.
Key Ząb Airbnb Performance Metrics Overview
Monthly Airbnb Revenue Variations & Income Potential in Ząb (2026)
Understanding the monthly revenue variations for Airbnb listings in Ząb is key to maximizing your short term rental income potential. Seasonality significantly impacts earnings. Our analysis, based on data from the past 12 months, shows that the peak revenue month for STRs in Ząb is typically December, while March often presents the lowest earnings, highlighting opportunities for strategic pricing adjustments during shoulder and low seasons. Explore the typical Airbnb income in Ząb across different performance tiers:
- Best-in-class properties (Top 10%) achieve $2,691+ monthly, often utilizing dynamic pricing and superior guest experiences.
- Strong performing properties (Top 25%) earn $1,438 or more, indicating effective management and desirable locations/amenities.
- Typical properties (Median) generate around $794 per month, representing the average market performance.
- Entry-level properties (Bottom 25%) see earnings around $413, often with potential for optimization.
Average Monthly Airbnb Earnings Trend in Ząb
Ząb Airbnb Occupancy Rate Trends (2026)
Maximize your bookings by understanding the Ząb STR occupancy trends. Seasonal demand shifts significantly influence how often properties are booked. Typically, Julysees the highest demand (peak season occupancy), while May experiences the lowest (low season). Effective strategies, like adjusting minimum stays or offering promotions, can boost occupancy during slower periods. Here's how different property tiers perform in Ząb:
- Best-in-class properties (Top 10%) achieve 68%+ occupancy, indicating high desirability and potentially optimized availability.
- Strong performing properties (Top 25%) maintain 45% or higher occupancy, suggesting good market fit and guest satisfaction.
- Typical properties (Median) have an occupancy rate around 25%.
- Entry-level properties (Bottom 25%) average 13% occupancy, potentially facing higher vacancy.
Average Monthly Occupancy Rate Trend in Ząb
Average Daily Rate (ADR) Airbnb Trends in Ząb (2026)
Effective short term rental pricing strategy in Ząb involves understanding monthly ADR fluctuations. The Average Daily Rate (ADR) for Airbnb in Ząb typically peaks in December and dips lowest during March. Leveraging Airbnb dynamic pricing tools or strategies based on this seasonality can significantly boost revenue. Here's a look at the typical nightly rates achieved:
- Best-in-class properties (Top 10%) command rates of $206+ per night, often due to premium features or locations.
- Strong performing properties (Top 25%) achieve nightly rates of $135 or more.
- Typical properties (Median) charge around $88 per night.
- Entry-level properties (Bottom 25%) earn around $64 per night.
Average Daily Rate (ADR) Trend by Month in Ząb
Get Live Ząb Market Intelligence 👇

Explore Real-time Analytics
Airbnb Seasonality Analysis & Trends in Ząb (2026)
Peak Season (December, July, August)
- Revenue averages $1,700 per month
- Occupancy rates average 40.5%
- Daily rates average $121
Shoulder Season
- Revenue averages $1,076 per month
- Occupancy maintains around 30.8%
- Daily rates hold near $118
Low Season (March, April, May)
- Revenue drops to average $742 per month
- Occupancy decreases to average 24.7%
- Daily rates adjust to average $104
Seasonality Insights for Ząb
- The Airbnb seasonality in Ząb shows highly seasonal trends requiring careful strategy. While the sections above show seasonal averages, it's also insightful to look at the extremes:
- During the high season, the absolute peak month showcases Ząb's highest earning potential, with monthly revenues capable of climbing to $1,728, occupancy reaching a high of 45.2%, and ADRs peaking at $136.
- Conversely, the slowest single month of the year, typically falling within the low season, marks the market's lowest point. In this month, revenue might dip to $701, occupancy could drop to 24.0%, and ADRs may adjust down to $103.
- Understanding both the seasonal averages and these monthly peaks and troughs in revenue, occupancy, and ADR is crucial for maximizing your Airbnb profit potential in Ząb.
Seasonal Strategies for Maximizing Profit
- Peak Season: Maximize revenue through premium pricing and potentially longer minimum stays. Ensure high availability.
- Low Season: Offer competitive pricing, special promotions (e.g., extended stay discounts), and flexible cancellation policies. Target off-season travelers like remote workers or budget-conscious guests.
- Shoulder Seasons: Implement dynamic pricing that balances peak and low rates. Target weekend travelers or specific events. Offer slightly more flexible terms than peak season.
- Regularly analyze your own performance against these Ząb seasonality benchmarks and adjust your pricing and availability strategy accordingly.
Best Areas for Airbnb Investment in Ząb (2026)
Exploring the top neighborhoods for short-term rentals in Ząb? This section highlights key areas, outlining why they are attractive for hosts and guests, along with notable local attractions. Consider these locations based on your target guest profile and investment strategy.
| Neighborhood / Area | Why Host Here? (Target Guests & Appeal) | Key Attractions & Landmarks |
|---|---|---|
| Tatra Mountains | Stunning mountain range ideal for outdoor enthusiasts. It's perfect for skiing, hiking, and enjoying nature, attracting tourists year-round. | Zakopane, Kasprowy Wierch, Morskie Oko, Giewont, Tatra National Park |
| Zakopane | Famous for its wooden architecture and vibrant culture. A must-visit for tourists looking for adventure and traditional Polish highlander culture. | Krupówki Street, Tatra Museum, Aqua Park Zakopane, Koscieliska Valley, Gubałówka |
| Chocholow | Known for its traditional wooden houses and thermal springs. A quieter spot for guests looking for a unique cultural experience. | Chocholowskie Termy, Traditional wooden architecture, Nearby hiking trails, Local markets |
| Kościelisko | A picturesque village near Zakopane, known for its stunning views and proximity to the Tatra mountains, attracting nature lovers. | Kościelisko Valley, Hiking trails, Skiing opportunities, Local folklore events |
| Białka Tatrzańska | Popular for its thermal baths and as a skiing destination, ideal for families and winter sports enthusiasts. | Białka Tatrzańska Ski Resort, Terma Bania, Raba River, Local eateries |
| Gliczarów Górny | A peaceful village known for breathtaking views and great hiking spots, perfect for a serene getaway. | Scenic viewpoints, Hiking trails, Winter sports, Local crafts |
| Szczawnica | Famous for its spa resorts and beautiful landscapes, it draws health tourists seeking wellness and relaxation. | Health resorts, Dunajec River rafting, Pieniny National Park, Local cuisine |
| Nowy Targ | An important hub for local culture and agriculture, it's great for those looking to explore the local domains and markets. | Nowy Targ Market, Cultural festivals, Surrounding nature, Local food |
Understanding Airbnb License Requirements & STR Laws in Ząb (2026)
While Ząb, Lesser Poland Voivodeship, Poland currently shows low STR regulations, specific Airbnb license requirements might still exist or change. Always verify the latest short term rental regulations and Airbnb license requirements directly with local government authorities for Ząb to ensure full compliance before hosting.
(Source: AirROI data, 2026, finding no licensed listings among those analyzed)
Top Performing Airbnb Properties in Ząb (2026)
Benchmark your potential! Explore examples of top-performing Airbnb properties in Ząbbased on Trailing Twelve Month (TTM) revenue. Analyze their characteristics, revenue, occupancy rate, and ADR to understand what drives success in this market.

Tatranska Zyngierka, Jacuzzi, Tatra mountains view
Entire Place • 2 bedrooms

Little House
Entire Place • 2 bedrooms

House in Ząb with a jacuzzi included in the price
Entire Place • 2 bedrooms

Villa under the Cut Lime Tree
Entire Place • 4 bedrooms

Cabin in Potoczki
Entire Place • 3 bedrooms
Comfortable cottage house with mountain views
Entire Place • 3 bedrooms
Note: Performance varies based on location, size, amenities, seasonality, and management quality. Data reflects the past 12 months.
Top Performing Airbnb Hosts in Ząb (2026)
Learn from the best! This table showcases top-performing Airbnb hosts in Ząb based on the number of properties managed and estimated total revenue over the past year. Analyze their scale and performance metrics.
| Host Name | Properties | Grossing Revenue | Stay Reviews | Avg Rating |
|---|---|---|---|---|
| Maria | 3 | $46,548 | 316 | 4.97/5.0 |
| Barbara I Andrzej Sikon | 1 | $38,357 | 121 | 4.93/5.0 |
| Anna | 7 | $34,803 | 22 | 4.58/5.0 |
| M J Jacek | 1 | $31,198 | 14 | 4.93/5.0 |
| Loft Affair | 2 | $30,268 | 25 | 4.79/5.0 |
| Marzena | 1 | $29,996 | 11 | 4.91/5.0 |
| Stefan | 1 | $24,721 | 8 | 5.00/5.0 |
| Artur | 1 | $20,457 | 21 | 4.86/5.0 |
| Anna | 1 | $19,467 | 100 | 4.96/5.0 |
| P.H.U. WALDEX Waldemar Pawliko | 3 | $17,991 | 11 | 4.81/5.0 |
Analyzing the strategies of top hosts, such as their property selection, pricing, and guest communication, can offer valuable lessons for optimizing your own Airbnb operations in Ząb.
Dive Deeper: Advanced Ząb STR Market Data (2026)
Ready to unlock more insights? AirROI provides access to advanced metrics and comprehensive Airbnb data for Ząb. Explore detailed analytics beyond this report to refine your investment strategy, optimize pricing, and maximize your vacation rental profits.
Explore Advanced MetricsZąb Short-Term Rental Market Composition (2026): Property & Room Types
Room Type Distribution
Property Type Distribution
Market Composition Insights for Ząb
- The Ząb Airbnb market composition is heavily skewed towards Entire Home/Apt listings, which make up 64% of the 50 active rentals. This indicates strong guest preference for privacy and space.
- However, a notable 36% share for Private Rooms suggests opportunities for budget-conscious travelers or hosts renting out spare rooms.
- Looking at the property type distribution in Ząb, House properties are the most common (40%), reflecting the local real estate landscape.
- Houses represent a significant 40% portion, catering likely to families or larger groups.
- The presence of 8% Hotel/Boutique listings indicates integration with traditional hospitality.
Ząb Airbnb Room Capacity Analysis (2026): Bedroom Distribution
Distribution of Listings by Number of Bedrooms
Room Capacity Insights for Ząb
- The dominant room capacity in Ząb is 1 bedroom listings, making up 30% of the market. This suggests a strong demand for properties suitable for couples or solo travelers.
- Together, 1 bedroom and 2 bedrooms properties represent 58.0% of the active Airbnb listings in Ząb, indicating a high concentration in these sizes.
Z�ąb Vacation Rental Guest Capacity Trends (2026)
Distribution of Listings by Guest Capacity
Guest Capacity Insights for Ząb
- The most common guest capacity trend in Ząb vacation rentals is listings accommodating 4 guests (20%). This suggests the primary traveler segment is likely small families or groups.
- Properties designed for 4 guests and 8+ guests dominate the Ząb STR market, accounting for 34.0% of listings.
- 30.0% of properties accommodate 6+ guests, serving the market segment for larger families or group travel in Ząb.
- On average, properties in Ząb are equipped to host 3.6 guests.
Ząb Airbnb Booking Patterns (2026): Available vs. Booked Days
Available Days Distribution
Booked Days Distribution
Booking Pattern Insights for Ząb
- The most common availability pattern in Ząb falls within the 271-366 days range, representing 80% of listings. This suggests many properties have significant open periods on their calendars.
- Approximately 92.0% of listings show high availability (181+ days open annually), indicating potential for increased bookings or specific owner usage patterns.
- For booked days, the 31-90 days range is most frequent in Ząb (56%), reflecting common guest stay durations or potential owner blocking patterns.
- A notable 8.0% of properties secure long booking periods (181+ days booked per year), highlighting successful long-term rental strategies or significant owner usage.
Ząb Airbnb Minimum Stay Requirements Analysis
Distribution of Listings by Minimum Night Requirement
1 Night
1 listings
2% of total
2 Nights
21 listings
42% of total
3 Nights
2 listings
4% of total
4-6 Nights
3 listings
6% of total
30+ Nights
23 listings
46% of total
Key Insights
- The most prevalent minimum stay requirement in Ząb is 30+ Nights, adopted by 46% of listings. This highlights the market's preference for longer commitments.
- A significant segment (46%) caters to monthly stays (30+ nights) in Ząb, pointing to opportunities in the extended-stay market.
Recommendations
- Align with the market by considering a 30+ Nights minimum stay, as 46% of Ząb hosts use this setting.
- If feasible, allowing 1-night stays, especially midweek or during low season, could capture last-minute bookings, as only 2% currently do.
- A 2-night minimum appears standard (42%). Consider this for weekends or peak periods.
- Explore offering discounts for stays of 30+ nights to attract the 46% of the market seeking extended stays.
- Adjust minimum nights based on seasonality – potentially shorter during low season and longer during peak demand periods in Ząb.
Ząb Airbnb Cancellation Policy Trends Analysis (2026)
Super Strict 30 Days
1 listings
2% of total
Refundable
4 listings
8% of total
Non-refundable
2 listings
4% of total
Flexible
3 listings
6% of total
Moderate
5 listings
10% of total
Firm
27 listings
54% of total
Strict
8 listings
16% of total
Cancellation Policy Insights for Ząb
- The prevailing Airbnb cancellation policy trend in Ząb is Firm, used by 54% of listings.
- A majority (70.0%) of hosts in Ząb utilize Firm or Strict policies, indicating a market where hosts prioritize booking security.
Recommendations for Hosts
- Consider adopting a Firm policy to align with the 54% market standard in Ząb.
- Regularly review your cancellation policy against competitors and market demand shifts in Ząb.
Ząb STR Booking Lead Time Analysis (2026)
Average Booking Lead Time by Month
Booking Lead Time Insights for Ząb
- The overall average booking lead time for vacation rentals in Ząb is 39 days.
- Guests book furthest in advance for stays during January (average 66 days), likely coinciding with peak travel demand or local events.
- The shortest booking windows occur for stays in February (average 34 days), indicating more last-minute travel plans during this time.
- Seasonally, Winter (47 days avg.) sees the longest lead times, while Fall (40 days avg.) has the shortest, reflecting typical travel planning cycles.
Recommendations for Hosts
- Use the overall average lead time (39 days) as a baseline for your pricing and availability strategy in Ząb.
- For January stays, consider implementing length-of-stay discounts or slightly higher rates for bookings made less than 66 days out to capitalize on advance planning.
- Target marketing efforts for the Winter season well in advance (at least 47 days) to capture early planners.
- Monitor your own booking lead times against these Ząb averages to identify opportunities for dynamic pricing adjustments.
Popular & Essential Airbnb Amenities in Ząb (2026)
Amenity Prevalence
Amenity Insights for Ząb
- Essential amenities in Ząb that guests expect include: Wifi, TV, Free parking on premises, Heating. Lacking these (any) could significantly impact bookings.
- Popular amenities like Hot water, Dishes and silverware, Refrigerator are common but not universal. Offering these can provide a competitive edge.
Recommendations for Hosts
- Ensure your listing includes all essential amenities for Ząb: Wifi, TV, Free parking on premises, Heating.
- Prioritize adding missing essentials: Wifi, TV, Free parking on premises, Heating.
- Consider adding popular differentiators like Hot water or Dishes and silverware to increase appeal.
- Highlight unique or less common amenities you offer (e.g., hot tub, dedicated workspace, EV charger) in your listing description and photos.
- Regularly check competitor amenities in Ząb to stay competitive.
Ząb Airbnb Guest Demographics & Profile Analysis (2026)
Guest Profile Summary for Ząb
- The typical guest profile for Airbnb in Ząb consists of predominantly international visitors (70%), with top international origins including France, typically belonging to the Post-2000s (Gen Z/Alpha) group (50%), primarily speaking English or Polish.
- Domestic travelers account for 29.7% of guests.
- Key international markets include Poland (29.7%) and France (9.3%).
- Top languages spoken are English (39.4%) followed by Polish (15%).
- A significant demographic segment is the Post-2000s (Gen Z/Alpha) group, representing 50% of guests.
Recommendations for Hosts
- Focus marketing internationally, particularly towards travelers from France.
- Tailor amenities and listing descriptions to appeal to the dominant Post-2000s (Gen Z/Alpha) demographic (e.g., highlight fast WiFi, smart home features, local guides).
- Highlight unique local experiences or amenities relevant to the primary guest profile.
- Consider seasonal promotions aligned with peak travel times for key origin markets.
Nearby Short-Term Rental Market Comparison
How does the Ząb Airbnb market stack up against its neighbors? Compare key performance metrics like average monthly revenue, ADR, and occupancy rates in surrounding areas to understand the broader regional STR landscape.
| Market | Active Properties | Monthly Revenue | Daily Rate | Avg. Occupancy |
|---|---|---|---|---|
| Brenna | 29 | $2,549 | $334.28 | 28% |
| Pribylina | 12 | $2,041 | $233.47 | 37% |
| Skawica | 10 | $1,960 | $196.94 | 34% |
| Istebna | 11 | $1,862 | $225.92 | 34% |
| Zawoja | 40 | $1,857 | $215.79 | 31% |
| Dzianisz | 14 | $1,810 | $259.90 | 32% |
| Czarna Góra | 18 | $1,644 | $423.32 | 22% |
| Kluszkowce | 26 | $1,594 | $200.63 | 31% |
| Tylmanowa | 11 | $1,568 | $183.05 | 42% |
| Sidzina | 15 | $1,531 | $182.66 | 37% |