Tychy Airbnb Market Analysis 2026: Short Term Rental Data & Vacation Rental Statistics in Silesian Voivodeship, Poland
Is Airbnb profitable in Tychy in 2026? Explore comprehensive Airbnb analytics for Tychy, Silesian Voivodeship, Poland to uncover income potential. This 2026 STR market report for Tychy, based on AirROI data from February 2025 to January 2026, reveals key trends in the niche market of 29 active listings.
Whether you're considering an Airbnb investment in Tychy, optimizing your existing vacation rental, or exploring rental arbitrage opportunities, understanding the Tychy Airbnb data is crucial. Leveraging the low regulation environment is key to maximizing your short term rental income potential. Let's dive into the specifics.
Key Tychy Airbnb Performance Metrics Overview
Monthly Airbnb Revenue Variations & Income Potential in Tychy (2026)
Understanding the monthly revenue variations for Airbnb listings in Tychy is key to maximizing your short term rental income potential. Seasonality significantly impacts earnings. Our analysis, based on data from the past 12 months, shows that the peak revenue month for STRs in Tychy is typically August, while January often presents the lowest earnings, highlighting opportunities for strategic pricing adjustments during shoulder and low seasons. Explore the typical Airbnb income in Tychy across different performance tiers:
- Best-in-class properties (Top 10%) achieve $1,413+ monthly, often utilizing dynamic pricing and superior guest experiences.
- Strong performing properties (Top 25%) earn $1,004 or more, indicating effective management and desirable locations/amenities.
- Typical properties (Median) generate around $570 per month, representing the average market performance.
- Entry-level properties (Bottom 25%) see earnings around $323, often with potential for optimization.
Average Monthly Airbnb Earnings Trend in Tychy
Tychy Airbnb Occupancy Rate Trends (2026)
Maximize your bookings by understanding the Tychy STR occupancy trends. Seasonal demand shifts significantly influence how often properties are booked. Typically, Augustsees the highest demand (peak season occupancy), while January experiences the lowest (low season). Effective strategies, like adjusting minimum stays or offering promotions, can boost occupancy during slower periods. Here's how different property tiers perform in Tychy:
- Best-in-class properties (Top 10%) achieve 67%+ occupancy, indicating high desirability and potentially optimized availability.
- Strong performing properties (Top 25%) maintain 43% or higher occupancy, suggesting good market fit and guest satisfaction.
- Typical properties (Median) have an occupancy rate around 24%.
- Entry-level properties (Bottom 25%) average 14% occupancy, potentially facing higher vacancy.
Average Monthly Occupancy Rate Trend in Tychy
Average Daily Rate (ADR) Airbnb Trends in Tychy (2026)
Effective short term rental pricing strategy in Tychy involves understanding monthly ADR fluctuations. The Average Daily Rate (ADR) for Airbnb in Tychy typically peaks in December and dips lowest during March. Leveraging Airbnb dynamic pricing tools or strategies based on this seasonality can significantly boost revenue. Here's a look at the typical nightly rates achieved:
- Best-in-class properties (Top 10%) command rates of $124+ per night, often due to premium features or locations.
- Strong performing properties (Top 25%) achieve nightly rates of $103 or more.
- Typical properties (Median) charge around $78 per night.
- Entry-level properties (Bottom 25%) earn around $57 per night.
Average Daily Rate (ADR) Trend by Month in Tychy
Get Live Tychy Market Intelligence 👇
Explore Real-time Analytics
Airbnb Seasonality Analysis & Trends in Tychy (2026)
Peak Season (August, July, December)
- Revenue averages $931 per month
- Occupancy rates average 36.3%
- Daily rates average $86
Shoulder Season
- Revenue averages $687 per month
- Occupancy maintains around 30.6%
- Daily rates hold near $82
Low Season (January, February, September)
- Revenue drops to average $538 per month
- Occupancy decreases to average 26.5%
- Daily rates adjust to average $83
Seasonality Insights for Tychy
- The Airbnb seasonality in Tychy shows highly seasonal trends requiring careful strategy. While the sections above show seasonal averages, it's also insightful to look at the extremes:
- During the high season, the absolute peak month showcases Tychy's highest earning potential, with monthly revenues capable of climbing to $972, occupancy reaching a high of 40.1%, and ADRs peaking at $86.
- Conversely, the slowest single month of the year, typically falling within the low season, marks the market's lowest point. In this month, revenue might dip to $440, occupancy could drop to 20.7%, and ADRs may adjust down to $80.
- Understanding both the seasonal averages and these monthly peaks and troughs in revenue, occupancy, and ADR is crucial for maximizing your Airbnb profit potential in Tychy.
Seasonal Strategies for Maximizing Profit
- Peak Season: Maximize revenue through premium pricing and potentially longer minimum stays. Ensure high availability.
- Low Season: Offer competitive pricing, special promotions (e.g., extended stay discounts), and flexible cancellation policies. Target off-season travelers like remote workers or budget-conscious guests.
- Shoulder Seasons: Implement dynamic pricing that balances peak and low rates. Target weekend travelers or specific events. Offer slightly more flexible terms than peak season.
- Regularly analyze your own performance against these Tychy seasonality benchmarks and adjust your pricing and availability strategy accordingly.
Best Areas for Airbnb Investment in Tychy (2026)
Exploring the top neighborhoods for short-term rentals in Tychy? This section highlights key areas, outlining why they are attractive for hosts and guests, along with notable local attractions. Consider these locations based on your target guest profile and investment strategy.
| Neighborhood / Area | Why Host Here? (Target Guests & Appeal) | Key Attractions & Landmarks |
|---|---|---|
| Tychy City Center | The vibrant hub of Tychy with shops, restaurants, and easy access to public transport. Attracts both business travelers and tourists. | Tychy Market Square, Tychy Theatre, City Park, Tychy Brewery, St. Mary Magdalene Church |
| Paprocany | A beautiful lakeside area perfect for leisure and outdoor activities. Ideal for families and nature lovers, with access to recreational facilities. | Paprocany Lake, Beach, Walking and biking trails, Water sports, Cafes by the lake |
| TW Tychy | An innovative district with a modern business atmosphere. Great for business visitors and professionals attending conferences or meetings. | TW Tychy Park, Business centers, Cafes and restaurants, Cultural events |
| Tychy Piast | Nestled within quiet neighborhoods, this area offers a family-oriented atmosphere and close proximity to schools and parks. | Sports fields, Playgrounds, Parks and gardens, Residential charm |
| Tychy Factory District | An area reflective of Tychy's industrial history, now evolving with new ventures and revitalization, attracting a diverse crowd. | Old factories, Cultural and artistic events, Local breweries, Renovated warehouses |
| Borki | A suburb known for its peaceful environment and proximity to nature, appealing to those looking for a quiet retreat. | Nature reserves, Walking paths, Local markets, Community parks |
| Czarna | A romantic, picturesque area near the river, perfect for couples and those seeking a tranquil getaway. | River paths, Scenic views, Charming cafes, Wildlife watching |
| Tychy Zoo | Ideal for families, this area combines leisure with educational opportunities at the local zoo, attracting visitors year-round. | Tychy Zoo, Family-friendly attractions, Nature walks, Educational programs |
Understanding Airbnb License Requirements & STR Laws in Tychy (2026)
While Tychy, Silesian Voivodeship, Poland currently shows low STR regulations, specific Airbnb license requirements might still exist or change. Always verify the latest short term rental regulations and Airbnb license requirements directly with local government authorities for Tychy to ensure full compliance before hosting.
(Source: AirROI data, 2026, finding no licensed listings among those analyzed)
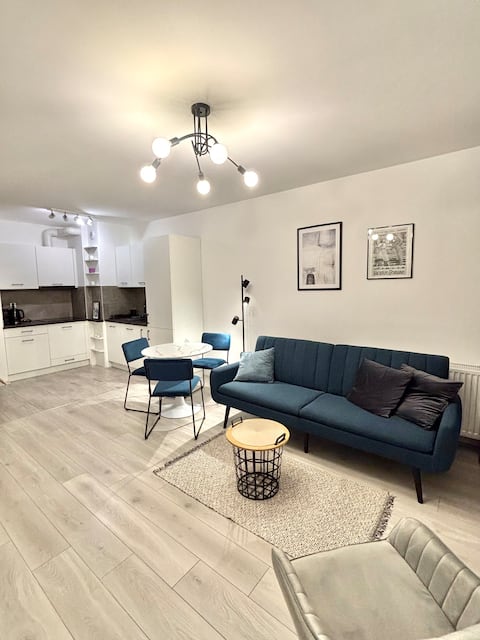
Top Performing Airbnb Properties in Tychy (2026)
Benchmark your potential! Explore examples of top-performing Airbnb properties in Tychybased on Trailing Twelve Month (TTM) revenue. Analyze their characteristics, revenue, occupancy rate, and ADR to understand what drives success in this market.

Superior Apartment
Entire Place • 3 bedrooms

Tyskie Apartments with garden 1
Entire Place • 1 bedroom
Apartment 8
Entire Place • 1 bedroom

Nice place
Entire Place • 1 bedroom

Tyskie Apartments with garden 2
Entire Place • 1 bedroom

Lovely 38 sqm apartment - Tychy Śląskie Ogrody
Entire Place • 1 bedroom
Note: Performance varies based on location, size, amenities, seasonality, and management quality. Data reflects the past 12 months.
Top Performing Airbnb Hosts in Tychy (2026)
Learn from the best! This table showcases top-performing Airbnb hosts in Tychy based on the number of properties managed and estimated total revenue over the past year. Analyze their scale and performance metrics.
| Host Name | Properties | Grossing Revenue | Stay Reviews | Avg Rating |
|---|---|---|---|---|
| Silesia Apartments | 6 | $28,888 | 25 | 4.05/5.0 |
| Przemek | 2 | $24,266 | 93 | 4.95/5.0 |
| Patrycja | 2 | $18,401 | 2 | Not Rated |
| Paulina | 2 | $15,581 | 8 | 4.90/5.0 |
| Piotr | 1 | $10,227 | 14 | 4.93/5.0 |
| Beata | 1 | $7,733 | 18 | 4.89/5.0 |
| Wojciech | 1 | $7,249 | 45 | 4.62/5.0 |
| Patrycja | 1 | $7,100 | 3 | 5.00/5.0 |
| Dariusz | 2 | $6,642 | 11 | 4.61/5.0 |
| Aleksandra | 2 | $6,285 | 54 | 4.88/5.0 |
Analyzing the strategies of top hosts, such as their property selection, pricing, and guest communication, can offer valuable lessons for optimizing your own Airbnb operations in Tychy.
Dive Deeper: Advanced Tychy STR Market Data (2026)
Ready to unlock more insights? AirROI provides access to advanced metrics and comprehensive Airbnb data for Tychy. Explore detailed analytics beyond this report to refine your investment strategy, optimize pricing, and maximize your vacation rental profits.
Explore Advanced MetricsTychy Short-Term Rental Market Composition (2026): Property & Room Types
Room Type Distribution
Property Type Distribution
Market Composition Insights for Tychy
- The Tychy Airbnb market composition is heavily skewed towards Entire Home/Apt listings, which make up 89.7% of the 29 active rentals. This indicates strong guest preference for privacy and space.
- Looking at the property type distribution in Tychy, Apartment/Condo properties are the most common (96.6%), reflecting the local real estate landscape.
- Smaller segments like house (combined 3.4%) offer potential for unique stay experiences.
Tychy Airbnb Room Capacity Analysis (2026): Bedroom Distribution
Distribution of Listings by Number of Bedrooms
Room Capacity Insights for Tychy
- The dominant room capacity in Tychy is 1 bedroom listings, making up 72.4% of the market. This suggests a strong demand for properties suitable for couples or solo travelers.
- Together, 1 bedroom and 2 bedrooms properties represent 89.6% of the active Airbnb listings in Tychy, indicating a high concentration in these sizes.
- With over half the market (72.4%) consisting of studios or 1-bedroom units, Tychy is particularly well-suited for individuals or couples.
Tychy Vacation Rental Guest Capacity Trends (2026)
Distribution of Listings by Guest Capacity
Guest Capacity Insights for Tychy
- The most common guest capacity trend in Tychy vacation rentals is listings accommodating 4 guests (51.7%). This suggests the primary traveler segment is likely small families or groups.
- Properties designed for 4 guests and 6 guests dominate the Tychy STR market, accounting for 72.4% of listings.
- 20.7% of properties accommodate 6+ guests, serving the market segment for larger families or group travel in Tychy.
- On average, properties in Tychy are equipped to host 4.0 guests.
Tychy Airbnb Booking Patterns (2026): Available vs. Booked Days
Available Days Distribution
Booked Days Distribution
Booking Pattern Insights for Tychy
- The most common availability pattern in Tychy falls within the 271-366 days range, representing 75.9% of listings. This suggests many properties have significant open periods on their calendars.
- Approximately 93.1% of listings show high availability (181+ days open annually), indicating potential for increased bookings or specific owner usage patterns.
- For booked days, the 31-90 days range is most frequent in Tychy (58.6%), reflecting common guest stay durations or potential owner blocking patterns.
- A notable 13.8% of properties secure long booking periods (181+ days booked per year), highlighting successful long-term rental strategies or significant owner usage.
Tychy Airbnb Minimum Stay Requirements Analysis
Distribution of Listings by Minimum Night Requirement
1 Night
20 listings
69% of total
2 Nights
5 listings
17.2% of total
4-6 Nights
1 listings
3.4% of total
30+ Nights
3 listings
10.3% of total
Key Insights
- The most prevalent minimum stay requirement in Tychy is 1 Night, adopted by 69% of listings. This highlights the market's preference for shorter, flexible bookings.
- A strong majority (86.2%) of the Tychy Airbnb data shows acceptance of very short stays (1-2 nights), indicating a dynamic, high-turnover market.
- A significant segment (10.3%) caters to monthly stays (30+ nights) in Tychy, pointing to opportunities in the extended-stay market.
Recommendations
- Align with the market by considering a 1 Night minimum stay, as 69% of Tychy hosts use this setting.
- Explore offering discounts for stays of 30+ nights to attract the 10.3% of the market seeking extended stays.
- Adjust minimum nights based on seasonality – potentially shorter during low season and longer during peak demand periods in Tychy.
Tychy Airbnb Cancellation Policy Trends Analysis (2026)
Limited
2 listings
6.9% of total
Flexible
12 listings
41.4% of total
Moderate
8 listings
27.6% of total
Firm
7 listings
24.1% of total
Cancellation Policy Insights for Tychy
- The prevailing Airbnb cancellation policy trend in Tychy is Flexible, used by 41.4% of listings.
- There's a relatively balanced mix between guest-friendly (69.0%) and stricter (24.1%) policies, offering choices for different guest needs.
Recommendations for Hosts
- Consider adopting a Flexible policy to align with the 41.4% market standard in Tychy.
- Regularly review your cancellation policy against competitors and market demand shifts in Tychy.
Tychy STR Booking Lead Time Analysis (2026)
Average Booking Lead Time by Month
Booking Lead Time Insights for Tychy
- The overall average booking lead time for vacation rentals in Tychy is 31 days.
- Guests book furthest in advance for stays during August (average 53 days), likely coinciding with peak travel demand or local events.
- The shortest booking windows occur for stays in March (average 9 days), indicating more last-minute travel plans during this time.
- Seasonally, Summer (43 days avg.) sees the longest lead times, while Spring (20 days avg.) has the shortest, reflecting typical travel planning cycles.
Recommendations for Hosts
- Use the overall average lead time (31 days) as a baseline for your pricing and availability strategy in Tychy.
- For August stays, consider implementing length-of-stay discounts or slightly higher rates for bookings made less than 53 days out to capitalize on advance planning.
- During March, focus on last-minute booking availability and promotions, as guests book with very short notice (9 days avg.).
- Target marketing efforts for the Summer season well in advance (at least 43 days) to capture early planners.
- Monitor your own booking lead times against these Tychy averages to identify opportunities for dynamic pricing adjustments.
Popular & Essential Airbnb Amenities in Tychy (2026)
Amenity Prevalence
Amenity Insights for Tychy
- Essential amenities in Tychy that guests expect include: Kitchen, Heating, Wifi, TV, Hangers, Hair dryer, Iron. Lacking these (any) could significantly impact bookings.
- Popular amenities like Washer, Cooking basics, Refrigerator are common but not universal. Offering these can provide a competitive edge.
Recommendations for Hosts
- Ensure your listing includes all essential amenities for Tychy: Kitchen, Heating, Wifi, TV, Hangers, Hair dryer, Iron.
- Prioritize adding missing essentials: Hangers, Hair dryer, Iron.
- Consider adding popular differentiators like Washer or Cooking basics to increase appeal.
- Highlight unique or less common amenities you offer (e.g., hot tub, dedicated workspace, EV charger) in your listing description and photos.
- Regularly check competitor amenities in Tychy to stay competitive.
Tychy Airbnb Guest Demographics & Profile Analysis (2026)
Guest Profile Summary for Tychy
- The typical guest profile for Airbnb in Tychy consists of predominantly international visitors (75%), with top international origins including Germany, typically belonging to the Post-2000s (Gen Z/Alpha) group (50%), primarily speaking English or Polish.
- Domestic travelers account for 25.0% of guests.
- Key international markets include Poland (25%) and Germany (15%).
- Top languages spoken are English (38%) followed by Polish (22%).
- A significant demographic segment is the Post-2000s (Gen Z/Alpha) group, representing 50% of guests.
Recommendations for Hosts
- Focus marketing internationally, particularly towards travelers from Germany.
- Tailor amenities and listing descriptions to appeal to the dominant Post-2000s (Gen Z/Alpha) demographic (e.g., highlight fast WiFi, smart home features, local guides).
- Highlight unique local experiences or amenities relevant to the primary guest profile.
- Consider seasonal promotions aligned with peak travel times for key origin markets.
Nearby Short-Term Rental Market Comparison
How does the Tychy Airbnb market stack up against its neighbors? Compare key performance metrics like average monthly revenue, ADR, and occupancy rates in surrounding areas to understand the broader regional STR landscape.
| Market | Active Properties | Monthly Revenue | Daily Rate | Avg. Occupancy |
|---|---|---|---|---|
| Brenna | 29 | $2,549 | $334.28 | 28% |
| Pribylina | 12 | $2,041 | $233.47 | 37% |
| Skawica | 10 | $1,960 | $196.94 | 34% |
| Istebna | 11 | $1,862 | $225.92 | 34% |
| Zawoja | 40 | $1,857 | $215.79 | 31% |
| Dzianisz | 14 | $1,810 | $259.90 | 32% |
| Sidzina | 15 | $1,531 | $182.66 | 37% |
| Frýdlant nad Ostravicí | 12 | $1,523 | $222.28 | 35% |
| Cholerzyn | 17 | $1,520 | $139.04 | 41% |
| Krakow | 5,888 | $1,405 | $120.12 | 46% |