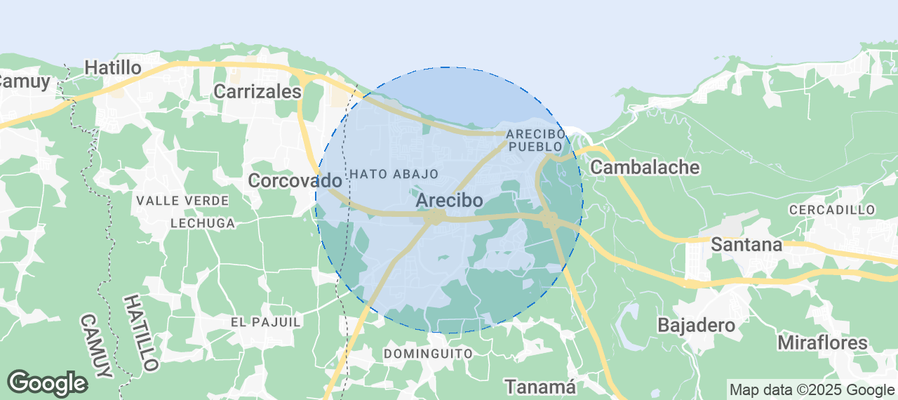
Arecibo Airbnb Market Analysis 2026: Short Term Rental Data & Vacation Rental Statistics in Arecibo, Puerto Rico
Is Airbnb profitable in Arecibo in 2026? Explore comprehensive Airbnb analytics for Arecibo, Arecibo, Puerto Rico to uncover income potential. This 2026 STR market report for Arecibo, based on AirROI data from February 2025 to January 2026, reveals key trends in the niche market of 32 active listings.
Whether you're considering an Airbnb investment in Arecibo, optimizing your existing vacation rental, or exploring rental arbitrage opportunities, understanding the Arecibo Airbnb data is crucial. Leveraging the low regulation environment is key to maximizing your short term rental income potential. Let's dive into the specifics.
Key Arecibo Airbnb Performance Metrics Overview
Monthly Airbnb Revenue Variations & Income Potential in Arecibo (2026)
Understanding the monthly revenue variations for Airbnb listings in Arecibo is key to maximizing your short term rental income potential. Seasonality significantly impacts earnings. Our analysis, based on data from the past 12 months, shows that the peak revenue month for STRs in Arecibo is typically December, while May often presents the lowest earnings, highlighting opportunities for strategic pricing adjustments during shoulder and low seasons. Explore the typical Airbnb income in Arecibo across different performance tiers:
- Best-in-class properties (Top 10%) achieve $2,247+ monthly, often utilizing dynamic pricing and superior guest experiences.
- Strong performing properties (Top 25%) earn $1,471 or more, indicating effective management and desirable locations/amenities.
- Typical properties (Median) generate around $829 per month, representing the average market performance.
- Entry-level properties (Bottom 25%) see earnings around $526, often with potential for optimization.
Average Monthly Airbnb Earnings Trend in Arecibo
Arecibo Airbnb Occupancy Rate Trends (2026)
Maximize your bookings by understanding the Arecibo STR occupancy trends. Seasonal demand shifts significantly influence how often properties are booked. Typically, Junesees the highest demand (peak season occupancy), while April experiences the lowest (low season). Effective strategies, like adjusting minimum stays or offering promotions, can boost occupancy during slower periods. Here's how different property tiers perform in Arecibo:
- Best-in-class properties (Top 10%) achieve 50%+ occupancy, indicating high desirability and potentially optimized availability.
- Strong performing properties (Top 25%) maintain 37% or higher occupancy, suggesting good market fit and guest satisfaction.
- Typical properties (Median) have an occupancy rate around 25%.
- Entry-level properties (Bottom 25%) average 14% occupancy, potentially facing higher vacancy.
Average Monthly Occupancy Rate Trend in Arecibo
Average Daily Rate (ADR) Airbnb Trends in Arecibo (2026)
Effective short term rental pricing strategy in Arecibo involves understanding monthly ADR fluctuations. The Average Daily Rate (ADR) for Airbnb in Arecibo typically peaks in November and dips lowest during September. Leveraging Airbnb dynamic pricing tools or strategies based on this seasonality can significantly boost revenue. Here's a look at the typical nightly rates achieved:
- Best-in-class properties (Top 10%) command rates of $257+ per night, often due to premium features or locations.
- Strong performing properties (Top 25%) achieve nightly rates of $163 or more.
- Typical properties (Median) charge around $101 per night.
- Entry-level properties (Bottom 25%) earn around $77 per night.
Average Daily Rate (ADR) Trend by Month in Arecibo
Get Live Arecibo Market Intelligence 👇
Explore Real-time Analytics
Airbnb Seasonality Analysis & Trends in Arecibo (2026)
Peak Season (December, October, March)
- Revenue averages $1,520 per month
- Occupancy rates average 31.0%
- Daily rates average $142
Shoulder Season
- Revenue averages $1,199 per month
- Occupancy maintains around 31.9%
- Daily rates hold near $135
Low Season (April, May, September)
- Revenue drops to average $628 per month
- Occupancy decreases to average 14.9%
- Daily rates adjust to average $127
Seasonality Insights for Arecibo
- The Airbnb seasonality in Arecibo shows highly seasonal trends requiring careful strategy. While the sections above show seasonal averages, it's also insightful to look at the extremes:
- During the high season, the absolute peak month showcases Arecibo's highest earning potential, with monthly revenues capable of climbing to $1,644, occupancy reaching a high of 42.0%, and ADRs peaking at $150.
- Conversely, the slowest single month of the year, typically falling within the low season, marks the market's lowest point. In this month, revenue might dip to $431, occupancy could drop to 10.0%, and ADRs may adjust down to $122.
- Understanding both the seasonal averages and these monthly peaks and troughs in revenue, occupancy, and ADR is crucial for maximizing your Airbnb profit potential in Arecibo.
Seasonal Strategies for Maximizing Profit
- Peak Season: Maximize revenue through premium pricing and potentially longer minimum stays. Ensure high availability.
- Low Season: Offer competitive pricing, special promotions (e.g., extended stay discounts), and flexible cancellation policies. Target off-season travelers like remote workers or budget-conscious guests.
- Shoulder Seasons: Implement dynamic pricing that balances peak and low rates. Target weekend travelers or specific events. Offer slightly more flexible terms than peak season.
- Regularly analyze your own performance against these Arecibo seasonality benchmarks and adjust your pricing and availability strategy accordingly.
Best Areas for Airbnb Investment in Arecibo (2026)
Exploring the top neighborhoods for short-term rentals in Arecibo? This section highlights key areas, outlining why they are attractive for hosts and guests, along with notable local attractions. Consider these locations based on your target guest profile and investment strategy.
| Neighborhood / Area | Why Host Here? (Target Guests & Appeal) | Key Attractions & Landmarks |
|---|---|---|
| Cueva del Indio | A stunning natural attraction with breathtaking views and unique geological formations. Draws tourists interested in adventure and natural beauty. | Cueva del Indio, Arecibo Lighthouse, Natural Pool, Cueva del Indio Park |
| Arecibo Observatory | The iconic radio telescope and observatory that attracts science enthusiasts and tourists. A perfect spot for education and outdoor activities around astronomy. | Arecibo Observatory, Observatory Visitor Center, Cultural Center of Arecibo |
| Paseo Real Marina | A scenic marina area ideal for water sports and relaxation by the sea, attracting families and beach lovers. | Paseo Real Marina, Marina Water Sports, Restaurants by the Marina |
| Jobos Beach | One of the best beaches in the area, known for surfing and its lively atmosphere. Perfect for beachgoers and water sports enthusiasts. | Jobos Beach, Surfing spots, Local Restaurants |
| La Poza del Obispo | A beautiful coastal area with great swimming spots and scenic views, perfect for family outings and relaxation. | La Poza del Obispo, Local kiosks, Swimming areas |
| Las Cavernas del Río Camuy | A natural park featuring impressive caves and a river, offering tours and outdoor activities, popular with tourists and nature lovers. | Las Cavernas del Río Camuy, Nature walks, Guided tours |
| Ojo del Buey | An ideal spot for eco-tourism and nature exploration with hiking trails and beautiful scenery, attracting nature enthusiasts. | Ojo del Buey, Hiking trails, Wildlife observation |
| Playa Puerto Nuevo | A picturesque beach known for its calm waters and beauty, it is a favorite for locals and tourists alike, ideal for relaxation and activities. | Playa Puerto Nuevo, Beach activities, Nearby restaurants |
Understanding Airbnb License Requirements & STR Laws in Arecibo (2026)
While Arecibo, Arecibo, Puerto Rico currently shows low STR regulations, specific Airbnb license requirements might still exist or change. Always verify the latest short term rental regulations and Airbnb license requirements directly with local government authorities for Arecibo to ensure full compliance before hosting.
(Source: AirROI data, 2026, finding no licensed listings among those analyzed)
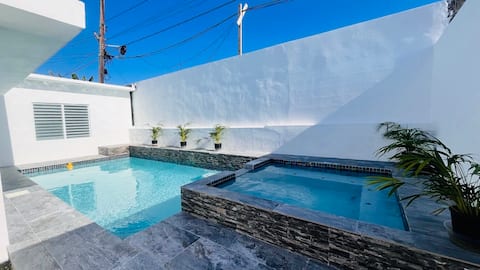
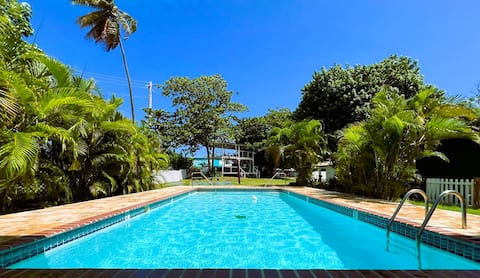
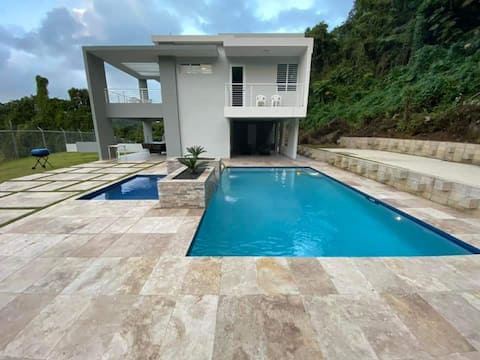
Top Performing Airbnb Properties in Arecibo (2026)
Benchmark your potential! Explore examples of top-performing Airbnb properties in Arecibobased on Trailing Twelve Month (TTM) revenue. Analyze their characteristics, revenue, occupancy rate, and ADR to understand what drives success in this market.
Casa Mar & Sor
Entire Place • 5 bedrooms
Beachfront Casita Koru East by Scenic Route 681
Entire Place • 3 bedrooms
The sweeping corner
Entire Place • 3 bedrooms
Relaxing, Solar Power, Billard Table,Swimming Pool
Entire Place • 3 bedrooms
Modern apartment/ w Ocean view
Entire Place • 1 bedroom
Casa Luna
Entire Place • 2 bedrooms
Note: Performance varies based on location, size, amenities, seasonality, and management quality. Data reflects the past 12 months.
Top Performing Airbnb Hosts in Arecibo (2026)
Learn from the best! This table showcases top-performing Airbnb hosts in Arecibo based on the number of properties managed and estimated total revenue over the past year. Analyze their scale and performance metrics.
| Host Name | Properties | Grossing Revenue | Stay Reviews | Avg Rating |
|---|---|---|---|---|
| Hiram | 1 | $29,295 | 16 | 4.69/5.0 |
| Josean | 6 | $28,159 | 204 | 4.73/5.0 |
| Joe | 1 | $21,361 | 29 | 4.90/5.0 |
| DoradaProperties | 2 | $20,191 | 23 | 4.71/5.0 |
| Armando | 4 | $19,919 | 16 | 4.75/5.0 |
| Tina | 3 | $19,008 | 21 | 5.00/5.0 |
| Tropical Management | 1 | $18,306 | 6 | 4.83/5.0 |
| Sonny | 1 | $16,457 | 20 | 4.80/5.0 |
| Lynn | 1 | $8,606 | 12 | 4.67/5.0 |
| Maritza | 1 | $7,867 | 9 | 5.00/5.0 |
Analyzing the strategies of top hosts, such as their property selection, pricing, and guest communication, can offer valuable lessons for optimizing your own Airbnb operations in Arecibo.
Dive Deeper: Advanced Arecibo STR Market Data (2026)
Ready to unlock more insights? AirROI provides access to advanced metrics and comprehensive Airbnb data for Arecibo. Explore detailed analytics beyond this report to refine your investment strategy, optimize pricing, and maximize your vacation rental profits.
Explore Advanced MetricsArecibo Short-Term Rental Market Composition (2026): Property & Room Types
Room Type Distribution
Property Type Distribution
Market Composition Insights for Arecibo
- The Arecibo Airbnb market composition is heavily skewed towards Entire Home/Apt listings, which make up 84.4% of the 32 active rentals. This indicates strong guest preference for privacy and space.
- Looking at the property type distribution in Arecibo, Apartment/Condo properties are the most common (43.8%), reflecting the local real estate landscape.
- Houses represent a significant 25% portion, catering likely to families or larger groups.
- The presence of 18.8% Hotel/Boutique listings indicates integration with traditional hospitality.
Arecibo Airbnb Room Capacity Analysis (2026): Bedroom Distribution
Distribution of Listings by Number of Bedrooms
Room Capacity Insights for Arecibo
- The dominant room capacity in Arecibo is 1 bedroom listings, making up 53.1% of the market. This suggests a strong demand for properties suitable for couples or solo travelers.
- Together, 1 bedroom and 2 bedrooms properties represent 81.2% of the active Airbnb listings in Arecibo, indicating a high concentration in these sizes.
- With over half the market (53.1%) consisting of studios or 1-bedroom units, Arecibo is particularly well-suited for individuals or couples.
Arecibo Vacation Rental Guest Capacity Trends (2026)
Distribution of Listings by Guest Capacity
Guest Capacity Insights for Arecibo
- The most common guest capacity trend in Arecibo vacation rentals is listings accommodating 3 guests (21.9%). This suggests the primary traveler segment is likely small families or groups.
- Properties designed for 3 guests and 2 guests dominate the Arecibo STR market, accounting for 40.7% of listings.
- 31.2% of properties accommodate 6+ guests, serving the market segment for larger families or group travel in Arecibo.
- On average, properties in Arecibo are equipped to host 4.2 guests.
Arecibo Airbnb Booking Patterns (2026): Available vs. Booked Days
Available Days Distribution
Booked Days Distribution
Booking Pattern Insights for Arecibo
- The most common availability pattern in Arecibo falls within the 271-366 days range, representing 87.5% of listings. This suggests many properties have significant open periods on their calendars.
- Approximately 100.0% of listings show high availability (181+ days open annually), indicating potential for increased bookings or specific owner usage patterns.
- For booked days, the 31-90 days range is most frequent in Arecibo (68.8%), reflecting common guest stay durations or potential owner blocking patterns.
Arecibo Airbnb Minimum Stay Requirements Analysis
Distribution of Listings by Minimum Night Requirement
1 Night
20 listings
62.5% of total
2 Nights
6 listings
18.8% of total
7-29 Nights
2 listings
6.3% of total
30+ Nights
4 listings
12.5% of total
Key Insights
- The most prevalent minimum stay requirement in Arecibo is 1 Night, adopted by 62.5% of listings. This highlights the market's preference for shorter, flexible bookings.
- A strong majority (81.3%) of the Arecibo Airbnb data shows acceptance of very short stays (1-2 nights), indicating a dynamic, high-turnover market.
- A significant segment (12.5%) caters to monthly stays (30+ nights) in Arecibo, pointing to opportunities in the extended-stay market.
Recommendations
- Align with the market by considering a 1 Night minimum stay, as 62.5% of Arecibo hosts use this setting.
- Explore offering discounts for stays of 30+ nights to attract the 12.5% of the market seeking extended stays.
- Adjust minimum nights based on seasonality – potentially shorter during low season and longer during peak demand periods in Arecibo.
Arecibo Airbnb Cancellation Policy Trends Analysis (2026)
Flexible
11 listings
34.4% of total
Moderate
10 listings
31.3% of total
Firm
9 listings
28.1% of total
Strict
2 listings
6.3% of total
Cancellation Policy Insights for Arecibo
- The prevailing Airbnb cancellation policy trend in Arecibo is Flexible, used by 34.4% of listings.
- There's a relatively balanced mix between guest-friendly (65.7%) and stricter (34.4%) policies, offering choices for different guest needs.
- Strict cancellation policies are quite rare (6.3%), potentially making listings with this policy less competitive unless justified by high demand or property type.
Recommendations for Hosts
- Consider adopting a Flexible policy to align with the 34.4% market standard in Arecibo.
- Using a Strict policy might deter some guests, as only 6.3% of listings use it. Evaluate if potential revenue protection outweighs possible lower booking rates.
- Regularly review your cancellation policy against competitors and market demand shifts in Arecibo.
Arecibo STR Booking Lead Time Analysis (2026)
Average Booking Lead Time by Month
Booking Lead Time Insights for Arecibo
- The overall average booking lead time for vacation rentals in Arecibo is 23 days.
- Guests book furthest in advance for stays during November (average 38 days), likely coinciding with peak travel demand or local events.
- The shortest booking windows occur for stays in May (average 4 days), indicating more last-minute travel plans during this time.
- Seasonally, Fall (32 days avg.) sees the longest lead times, while Summer (15 days avg.) has the shortest, reflecting typical travel planning cycles.
Recommendations for Hosts
- Use the overall average lead time (23 days) as a baseline for your pricing and availability strategy in Arecibo.
- For November stays, consider implementing length-of-stay discounts or slightly higher rates for bookings made less than 38 days out to capitalize on advance planning.
- During May, focus on last-minute booking availability and promotions, as guests book with very short notice (4 days avg.).
- Target marketing efforts for the Fall season well in advance (at least 32 days) to capture early planners.
- Monitor your own booking lead times against these Arecibo averages to identify opportunities for dynamic pricing adjustments.
Popular & Essential Airbnb Amenities in Arecibo (2026)
Amenity Prevalence
Amenity Insights for Arecibo
- Popular amenities like Free parking on premises, Air conditioning, TV are common but not universal. Offering these can provide a competitive edge.
- Warning: Wifi is not universally provided but is considered essential globally. Ensure reliable Wifi is offered.
Recommendations for Hosts
- Consider adding popular differentiators like Free parking on premises or Air conditioning to increase appeal.
- Highlight unique or less common amenities you offer (e.g., hot tub, dedicated workspace, EV charger) in your listing description and photos.
- Regularly check competitor amenities in Arecibo to stay competitive.
Arecibo Airbnb Guest Demographics & Profile Analysis (2026)
Guest Profile Summary for Arecibo
- The typical guest profile for Airbnb in Arecibo consists of a mix of domestic (44%) and international guests, with top international origins including Puerto Rico, typically belonging to the Post-2000s (Gen Z/Alpha) group (50%), primarily speaking Spanish or English.
- Domestic travelers account for 43.5% of guests.
- Key international markets include United States (51.6%) and Puerto Rico (43.5%).
- Top languages spoken are Spanish (46.1%) followed by English (44.3%).
- A significant demographic segment is the Post-2000s (Gen Z/Alpha) group, representing 50% of guests.
Recommendations for Hosts
- Balance marketing efforts between domestic and international channels based on the guest mix.
- Tailor amenities and listing descriptions to appeal to the dominant Post-2000s (Gen Z/Alpha) demographic (e.g., highlight fast WiFi, smart home features, local guides).
- Highlight unique local experiences or amenities relevant to the primary guest profile.
- Consider seasonal promotions aligned with peak travel times for key origin markets.
Nearby Short-Term Rental Market Comparison
How does the Arecibo Airbnb market stack up against its neighbors? Compare key performance metrics like average monthly revenue, ADR, and occupancy rates in surrounding areas to understand the broader regional STR landscape.
| Market | Active Properties | Monthly Revenue | Daily Rate | Avg. Occupancy |
|---|---|---|---|---|
| Guánica | 16 | $6,050 | $468.80 | 33% |
| Sabana | 16 | $5,847 | $454.72 | 44% |
| Fortuna | 14 | $5,521 | $311.09 | 50% |
| Mameyes II | 17 | $4,242 | $349.18 | 48% |
| Vega Alta | 78 | $4,082 | $336.12 | 46% |
| Río Grande | 100 | $4,068 | $457.29 | 44% |
| Río Grande | 609 | $4,033 | $368.55 | 43% |
| Dorado | 270 | $4,019 | $431.44 | 44% |
| Playa Fortuna | 14 | $3,994 | $256.75 | 49% |
| Cayey | 40 | $3,836 | $255.45 | 49% |