Kagarama Airbnb Market Analysis 2026: Short Term Rental Data & Vacation Rental Statistics in Kigali City, Rwanda
Is Airbnb profitable in Kagarama in 2026? Explore comprehensive Airbnb analytics for Kagarama, Kigali City, Rwanda to uncover income potential. This 2026 STR market report for Kagarama, based on AirROI data from February 2025 to January 2026, reveals key trends in the niche market of 19 active listings.
Whether you're considering an Airbnb investment in Kagarama, optimizing your existing vacation rental, or exploring rental arbitrage opportunities, understanding the Kagarama Airbnb data is crucial. Leveraging the low regulation environment is key to maximizing your short term rental income potential. Let's dive into the specifics.
Key Kagarama Airbnb Performance Metrics Overview
Monthly Airbnb Revenue Variations & Income Potential in Kagarama (2026)
Understanding the monthly revenue variations for Airbnb listings in Kagarama is key to maximizing your short term rental income potential. Seasonality significantly impacts earnings. Our analysis, based on data from the past 12 months, shows that the peak revenue month for STRs in Kagarama is typically November, while December often presents the lowest earnings, highlighting opportunities for strategic pricing adjustments during shoulder and low seasons. Explore the typical Airbnb income in Kagarama across different performance tiers:
- Best-in-class properties (Top 10%) achieve $1,165+ monthly, often utilizing dynamic pricing and superior guest experiences.
- Strong performing properties (Top 25%) earn $777 or more, indicating effective management and desirable locations/amenities.
- Typical properties (Median) generate around $338 per month, representing the average market performance.
- Entry-level properties (Bottom 25%) see earnings around $208, often with potential for optimization.
Average Monthly Airbnb Earnings Trend in Kagarama
Kagarama Airbnb Occupancy Rate Trends (2026)
Maximize your bookings by understanding the Kagarama STR occupancy trends. Seasonal demand shifts significantly influence how often properties are booked. Typically, Novembersees the highest demand (peak season occupancy), while December experiences the lowest (low season). Effective strategies, like adjusting minimum stays or offering promotions, can boost occupancy during slower periods. Here's how different property tiers perform in Kagarama:
- Best-in-class properties (Top 10%) achieve 54%+ occupancy, indicating high desirability and potentially optimized availability.
- Strong performing properties (Top 25%) maintain 44% or higher occupancy, suggesting good market fit and guest satisfaction.
- Typical properties (Median) have an occupancy rate around 29%.
- Entry-level properties (Bottom 25%) average 14% occupancy, potentially facing higher vacancy.
Average Monthly Occupancy Rate Trend in Kagarama
Average Daily Rate (ADR) Airbnb Trends in Kagarama (2026)
Effective short term rental pricing strategy in Kagarama involves understanding monthly ADR fluctuations. The Average Daily Rate (ADR) for Airbnb in Kagarama typically peaks in July and dips lowest during October. Leveraging Airbnb dynamic pricing tools or strategies based on this seasonality can significantly boost revenue. Here's a look at the typical nightly rates achieved:
- Best-in-class properties (Top 10%) command rates of $88+ per night, often due to premium features or locations.
- Strong performing properties (Top 25%) achieve nightly rates of $68 or more.
- Typical properties (Median) charge around $44 per night.
- Entry-level properties (Bottom 25%) earn around $24 per night.
Average Daily Rate (ADR) Trend by Month in Kagarama
Get Live Kagarama Market Intelligence 👇

Explore Real-time Analytics
Airbnb Seasonality Analysis & Trends in Kagarama (2026)
Peak Season (November, May, April)
- Revenue averages $752 per month
- Occupancy rates average 36.1%
- Daily rates average $50
Shoulder Season
- Revenue averages $542 per month
- Occupancy maintains around 34.9%
- Daily rates hold near $51
Low Season (January, October, December)
- Revenue drops to average $287 per month
- Occupancy decreases to average 16.3%
- Daily rates adjust to average $49
Seasonality Insights for Kagarama
- The Airbnb seasonality in Kagarama shows highly seasonal trends requiring careful strategy. While the sections above show seasonal averages, it's also insightful to look at the extremes:
- During the high season, the absolute peak month showcases Kagarama's highest earning potential, with monthly revenues capable of climbing to $931, occupancy reaching a high of 46.6%, and ADRs peaking at $53.
- Conversely, the slowest single month of the year, typically falling within the low season, marks the market's lowest point. In this month, revenue might dip to $258, occupancy could drop to 11.3%, and ADRs may adjust down to $47.
- Understanding both the seasonal averages and these monthly peaks and troughs in revenue, occupancy, and ADR is crucial for maximizing your Airbnb profit potential in Kagarama.
Seasonal Strategies for Maximizing Profit
- Peak Season: Maximize revenue through premium pricing and potentially longer minimum stays. Ensure high availability.
- Low Season: Offer competitive pricing, special promotions (e.g., extended stay discounts), and flexible cancellation policies. Target off-season travelers like remote workers or budget-conscious guests.
- Shoulder Seasons: Implement dynamic pricing that balances peak and low rates. Target weekend travelers or specific events. Offer slightly more flexible terms than peak season.
- Regularly analyze your own performance against these Kagarama seasonality benchmarks and adjust your pricing and availability strategy accordingly.
Best Areas for Airbnb Investment in Kagarama (2026)
Exploring the top neighborhoods for short-term rentals in Kagarama? This section highlights key areas, outlining why they are attractive for hosts and guests, along with notable local attractions. Consider these locations based on your target guest profile and investment strategy.
| Neighborhood / Area | Why Host Here? (Target Guests & Appeal) | Key Attractions & Landmarks |
|---|---|---|
| Kagugu | A growing neighborhood known for its scenic views and proximity to the city center. Ideal for families and tourists looking for a peaceful environment with easy access to urban amenities. | Kigali Genocide Memorial, Kigali Convention Centre, Local markets, Restaurants, Cafés |
| Nyarutarama | An upscale residential area popular with expatriates and wealthy locals. Offers modern homes and a quiet atmosphere, making it perfect for longer stays. | Nyarutarama Lake, Golf courses, Luxury restaurants, Shopping malls, Cultural centers |
| Kimironko | A vibrant area known for its markets and local culture, appealing to tourists wanting to experience the daily life of Kigali. | Kimironko Market, Local eateries, Cultural performances, Art studios |
| Remera | A lively area with a mix of residential and commercial spaces, close to the airport and popular with travelers. | Kigali International Airport, Amahoro Stadium, Relaxation parks, Shopping centers |
| Biryogo | A developing neighborhood that showcases local life and hospitality, with an authentic Rwandan experience. | Local shops, Community events, Artisan crafts |
| Gikondo | Known for its blend of residential and commercial development, Gikondo is an emerging area worth considering for investment. | Trade and exhibitions, Accessibility to major roads, Local restaurants |
| Nyamirambo | A multicultural district that attracts a lot of visitors looking for vibrant culture and local experiences, great for thematic stays. | Street art, Cultural tours, Local food markets, Historical sites |
| Kigali City Centre | The heart of Kigali with a vibrant atmosphere, full of restaurants, shops, and nightlife, making it ideal for tourists seeking the urban experience. | City parks, Museums, Shopping districts, Night clubs, Cafés |
Understanding Airbnb License Requirements & STR Laws in Kagarama (2026)
While Kagarama, Kigali City, Rwanda currently shows low STR regulations, specific Airbnb license requirements might still exist or change. Always verify the latest short term rental regulations and Airbnb license requirements directly with local government authorities for Kagarama to ensure full compliance before hosting.
(Source: AirROI data, 2026, finding no licensed listings among those analyzed)
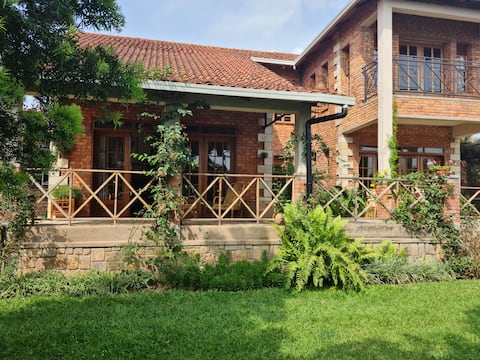
Top Performing Airbnb Properties in Kagarama (2026)
Benchmark your potential! Explore examples of top-performing Airbnb properties in Kagaramabased on Trailing Twelve Month (TTM) revenue. Analyze their characteristics, revenue, occupancy rate, and ADR to understand what drives success in this market.
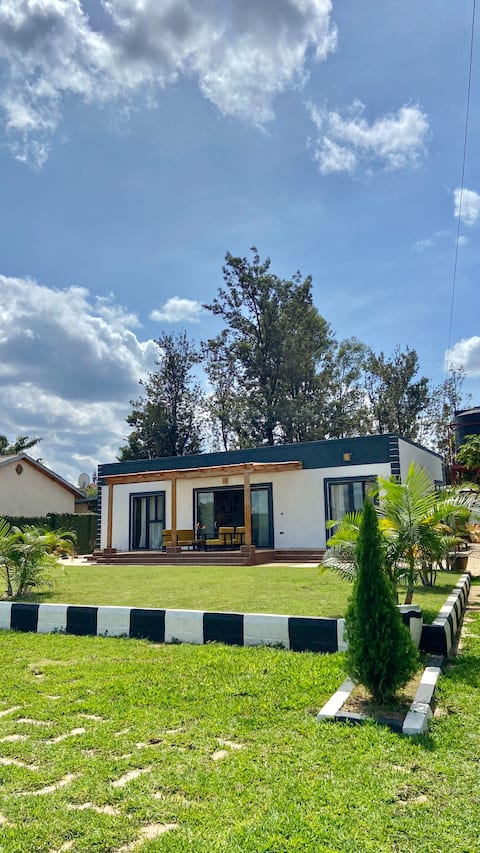
Kicukiro Niboye Family house w/ big garden
Entire Place • 3 bedrooms

A Home in Kigali -Spacious and Beautiful @ Home32
Entire Place • 4 bedrooms
ITOTO Loft, a cozy place.
Entire Place • 1 bedroom
Shades View Apartment
Entire Place • 2 bedrooms

LEXOR APARTMENTS
Entire Place • 1 bedroom

Private Artisan Home:Garden, Breakfast&Local Tours
Entire Place • 4 bedrooms
Note: Performance varies based on location, size, amenities, seasonality, and management quality. Data reflects the past 12 months.
Top Performing Airbnb Hosts in Kagarama (2026)
Learn from the best! This table showcases top-performing Airbnb hosts in Kagarama based on the number of properties managed and estimated total revenue over the past year. Analyze their scale and performance metrics.
| Host Name | Properties | Grossing Revenue | Stay Reviews | Avg Rating |
|---|---|---|---|---|
| Ivan | 1 | $8,962 | 27 | 4.93/5.0 |
| Judy | 1 | $7,354 | 24 | 4.92/5.0 |
| Arlette | 1 | $6,443 | 34 | 4.97/5.0 |
| Niyibizi | 1 | $4,235 | 3 | 3.67/5.0 |
| Martin | 1 | $3,773 | 36 | 4.78/5.0 |
| Tanguy | 1 | $2,066 | 15 | 4.73/5.0 |
| Delphin | 1 | $1,905 | 2 | Not Rated |
| Sonia | 1 | $1,809 | 14 | 4.93/5.0 |
| Natacha | 1 | $1,349 | 8 | 5.00/5.0 |
| Alun Huw | 1 | $1,281 | 58 | 4.67/5.0 |
Analyzing the strategies of top hosts, such as their property selection, pricing, and guest communication, can offer valuable lessons for optimizing your own Airbnb operations in Kagarama.
Dive Deeper: Advanced Kagarama STR Market Data (2026)
Ready to unlock more insights? AirROI provides access to advanced metrics and comprehensive Airbnb data for Kagarama. Explore detailed analytics beyond this report to refine your investment strategy, optimize pricing, and maximize your vacation rental profits.
Explore Advanced MetricsKagarama Short-Term Rental Market Composition (2026): Property & Room Types
Room Type Distribution
Property Type Distribution
Market Composition Insights for Kagarama
- The Kagarama Airbnb market composition is heavily skewed towards Entire Home/Apt listings, which make up 78.9% of the 19 active rentals. This indicates strong guest preference for privacy and space.
- Looking at the property type distribution in Kagarama, Apartment/Condo properties are the most common (47.4%), reflecting the local real estate landscape.
- Houses represent a significant 36.8% portion, catering likely to families or larger groups.
- The presence of 5.3% Hotel/Boutique listings indicates integration with traditional hospitality.
Kagarama Airbnb Room Capacity Analysis (2026): Bedroom Distribution
Distribution of Listings by Number of Bedrooms
Room Capacity Insights for Kagarama
- The dominant room capacity in Kagarama is 2 bedrooms listings, making up 31.6% of the market. This suggests a strong demand for properties suitable for couples or solo travelers.
- Together, 2 bedrooms and 1 bedroom properties represent 57.9% of the active Airbnb listings in Kagarama, indicating a high concentration in these sizes.
- A significant 36.9% of listings offer 3+ bedrooms, catering to larger groups and families seeking more space in Kagarama.
Kagarama Vacation Rental Guest Capacity Trends (2026)
Distribution of Listings by Guest Capacity
Guest Capacity Insights for Kagarama
- The most common guest capacity trend in Kagarama vacation rentals is listings accommodating 2 guests (26.3%). This suggests the primary traveler segment is likely couples or solo travelers.
- Properties designed for 2 guests and 4 guests dominate the Kagarama STR market, accounting for 52.6% of listings.
- 26.3% of properties accommodate 6+ guests, serving the market segment for larger families or group travel in Kagarama.
- On average, properties in Kagarama are equipped to host 3.6 guests.
Kagarama Airbnb Booking Patterns (2026): Available vs. Booked Days
Available Days Distribution
Booked Days Distribution
Booking Pattern Insights for Kagarama
- The most common availability pattern in Kagarama falls within the 271-366 days range, representing 84.2% of listings. This suggests many properties have significant open periods on their calendars.
- Approximately 100.0% of listings show high availability (181+ days open annually), indicating potential for increased bookings or specific owner usage patterns.
- For booked days, the 1-30 days range is most frequent in Kagarama (52.6%), reflecting common guest stay durations or potential owner blocking patterns.
Kagarama Airbnb Minimum Stay Requirements Analysis
Distribution of Listings by Minimum Night Requirement
1 Night
7 listings
36.8% of total
3 Nights
3 listings
15.8% of total
4-6 Nights
1 listings
5.3% of total
7-29 Nights
2 listings
10.5% of total
30+ Nights
6 listings
31.6% of total
Key Insights
- The most prevalent minimum stay requirement in Kagarama is 1 Night, adopted by 36.8% of listings. This highlights the market's preference for shorter, flexible bookings.
- A significant segment (31.6%) caters to monthly stays (30+ nights) in Kagarama, pointing to opportunities in the extended-stay market.
Recommendations
- Align with the market by considering a 1 Night minimum stay, as 36.8% of Kagarama hosts use this setting.
- Explore offering discounts for stays of 30+ nights to attract the 31.6% of the market seeking extended stays.
- Adjust minimum nights based on seasonality – potentially shorter during low season and longer during peak demand periods in Kagarama.
Kagarama Airbnb Cancellation Policy Trends Analysis (2026)
Flexible
15 listings
78.9% of total
Moderate
2 listings
10.5% of total
Firm
2 listings
10.5% of total
Cancellation Policy Insights for Kagarama
- The prevailing Airbnb cancellation policy trend in Kagarama is Flexible, used by 78.9% of listings.
- The market strongly favors guest-friendly terms, with 89.4% of listings offering Flexible or Moderate policies. This suggests guests in Kagarama may expect booking flexibility.
Recommendations for Hosts
- Consider adopting a Flexible policy to align with the 78.9% market standard in Kagarama.
- Given the high prevalence of Flexible policies (78.9%), offering this can enhance booking appeal, especially during shoulder seasons.
- Regularly review your cancellation policy against competitors and market demand shifts in Kagarama.
Kagarama STR Booking Lead Time Analysis (2026)
Average Booking Lead Time by Month
Booking Lead Time Insights for Kagarama
- The overall average booking lead time for vacation rentals in Kagarama is 26 days.
- Guests book furthest in advance for stays during December (average 102 days), likely coinciding with peak travel demand or local events.
- The shortest booking windows occur for stays in August (average 2 days), indicating more last-minute travel plans during this time.
- Seasonally, Spring (44 days avg.) sees the longest lead times, while Summer (20 days avg.) has the shortest, reflecting typical travel planning cycles.
Recommendations for Hosts
- Use the overall average lead time (26 days) as a baseline for your pricing and availability strategy in Kagarama.
- For December stays, consider implementing length-of-stay discounts or slightly higher rates for bookings made less than 102 days out to capitalize on advance planning.
- During August, focus on last-minute booking availability and promotions, as guests book with very short notice (2 days avg.).
- Target marketing efforts for the Spring season well in advance (at least 44 days) to capture early planners.
- Monitor your own booking lead times against these Kagarama averages to identify opportunities for dynamic pricing adjustments.
Popular & Essential Airbnb Amenities in Kagarama (2026)
Amenity Prevalence
Amenity Insights for Kagarama
- Essential amenities in Kagarama that guests expect include: Kitchen. Lacking these (this) could significantly impact bookings.
- Popular amenities like Free parking on premises, Wifi, Iron are common but not universal. Offering these can provide a competitive edge.
- Warning: Wifi is not universally provided but is considered essential globally. Ensure reliable Wifi is offered.
Recommendations for Hosts
- Ensure your listing includes all essential amenities for Kagarama: Kitchen.
- Consider adding popular differentiators like Free parking on premises or Wifi to increase appeal.
- Highlight unique or less common amenities you offer (e.g., hot tub, dedicated workspace, EV charger) in your listing description and photos.
- Regularly check competitor amenities in Kagarama to stay competitive.
Kagarama Airbnb Guest Demographics & Profile Analysis (2026)
Guest Profile Summary for Kagarama
- The typical guest profile for Airbnb in Kagarama consists of predominantly international visitors (83%), with top international origins including Rwanda, typically belonging to the Post-2000s (Gen Z/Alpha) group (50%), primarily speaking English or French.
- Domestic travelers account for 16.7% of guests.
- Key international markets include United States (33.3%) and Rwanda (16.7%).
- Top languages spoken are English (48.1%) followed by French (29.6%).
- A significant demographic segment is the Post-2000s (Gen Z/Alpha) group, representing 50% of guests.
Recommendations for Hosts
- Focus marketing internationally, particularly towards travelers from Rwanda.
- Tailor amenities and listing descriptions to appeal to the dominant Post-2000s (Gen Z/Alpha) demographic (e.g., highlight fast WiFi, smart home features, local guides).
- Highlight unique local experiences or amenities relevant to the primary guest profile.
- Consider seasonal promotions aligned with peak travel times for key origin markets.
Nearby Short-Term Rental Market Comparison
How does the Kagarama Airbnb market stack up against its neighbors? Compare key performance metrics like average monthly revenue, ADR, and occupancy rates in surrounding areas to understand the broader regional STR landscape.
| Market | Active Properties | Monthly Revenue | Daily Rate | Avg. Occupancy |
|---|---|---|---|---|
| Musanze | 10 | $793 | $84.53 | 24% |
| Kimihurura | 104 | $481 | $66.25 | 34% |
| Gisozi | 52 | $334 | $63.71 | 29% |
| Kigali | 381 | $328 | $64.18 | 32% |
| Kinyinya | 26 | $309 | $80.39 | 29% |
| Gisenyi | 10 | $229 | $97.28 | 16% |
| Gatsata / Karuruma | 15 | $227 | $48.41 | 35% |
| Muhoza | 13 | $198 | $53.73 | 21% |
| Kicukiro | 17 | $194 | $54.77 | 31% |