Westbrook Airbnb Market Analysis 2026: Short Term Rental Data & Vacation Rental Statistics in KwaZulu-Natal, South Africa
Is Airbnb profitable in Westbrook in 2026? Explore comprehensive Airbnb analytics for Westbrook, KwaZulu-Natal, South Africa to uncover income potential. This 2026 STR market report for Westbrook, based on AirROI data from February 2025 to January 2026, reveals key trends in the niche market of 39 active listings.
Whether you're considering an Airbnb investment in Westbrook, optimizing your existing vacation rental, or exploring rental arbitrage opportunities, understanding the Westbrook Airbnb data is crucial. Leveraging the low regulation environment is key to maximizing your short term rental income potential. Let's dive into the specifics.
Key Westbrook Airbnb Performance Metrics Overview
Monthly Airbnb Revenue Variations & Income Potential in Westbrook (2026)
Understanding the monthly revenue variations for Airbnb listings in Westbrook is key to maximizing your short term rental income potential. Seasonality significantly impacts earnings. Our analysis, based on data from the past 12 months, shows that the peak revenue month for STRs in Westbrook is typically December, while May often presents the lowest earnings, highlighting opportunities for strategic pricing adjustments during shoulder and low seasons. Explore the typical Airbnb income in Westbrook across different performance tiers:
- Best-in-class properties (Top 10%) achieve $7,938+ monthly, often utilizing dynamic pricing and superior guest experiences.
- Strong performing properties (Top 25%) earn $2,490 or more, indicating effective management and desirable locations/amenities.
- Typical properties (Median) generate around $991 per month, representing the average market performance.
- Entry-level properties (Bottom 25%) see earnings around $491, often with potential for optimization.
Average Monthly Airbnb Earnings Trend in Westbrook
Westbrook Airbnb Occupancy Rate Trends (2026)
Maximize your bookings by understanding the Westbrook STR occupancy trends. Seasonal demand shifts significantly influence how often properties are booked. Typically, Decembersees the highest demand (peak season occupancy), while January experiences the lowest (low season). Effective strategies, like adjusting minimum stays or offering promotions, can boost occupancy during slower periods. Here's how different property tiers perform in Westbrook:
- Best-in-class properties (Top 10%) achieve 68%+ occupancy, indicating high desirability and potentially optimized availability.
- Strong performing properties (Top 25%) maintain 51% or higher occupancy, suggesting good market fit and guest satisfaction.
- Typical properties (Median) have an occupancy rate around 33%.
- Entry-level properties (Bottom 25%) average 15% occupancy, potentially facing higher vacancy.
Average Monthly Occupancy Rate Trend in Westbrook
Average Daily Rate (ADR) Airbnb Trends in Westbrook (2026)
Effective short term rental pricing strategy in Westbrook involves understanding monthly ADR fluctuations. The Average Daily Rate (ADR) for Airbnb in Westbrook typically peaks in December and dips lowest during November. Leveraging Airbnb dynamic pricing tools or strategies based on this seasonality can significantly boost revenue. Here's a look at the typical nightly rates achieved:
- Best-in-class properties (Top 10%) command rates of $421+ per night, often due to premium features or locations.
- Strong performing properties (Top 25%) achieve nightly rates of $230 or more.
- Typical properties (Median) charge around $119 per night.
- Entry-level properties (Bottom 25%) earn around $76 per night.
Average Daily Rate (ADR) Trend by Month in Westbrook
Get Live Westbrook Market Intelligence 👇

Explore Real-time Analytics
Airbnb Seasonality Analysis & Trends in Westbrook (2026)
Peak Season (December, November, October)
- Revenue averages $3,359 per month
- Occupancy rates average 43.9%
- Daily rates average $188
Shoulder Season
- Revenue averages $2,519 per month
- Occupancy maintains around 35.1%
- Daily rates hold near $187
Low Season (January, February, May)
- Revenue drops to average $2,030 per month
- Occupancy decreases to average 28.7%
- Daily rates adjust to average $187
Seasonality Insights for Westbrook
- The Airbnb seasonality in Westbrook shows highly seasonal trends requiring careful strategy. While the sections above show seasonal averages, it's also insightful to look at the extremes:
- During the high season, the absolute peak month showcases Westbrook's highest earning potential, with monthly revenues capable of climbing to $3,769, occupancy reaching a high of 48.8%, and ADRs peaking at $204.
- Conversely, the slowest single month of the year, typically falling within the low season, marks the market's lowest point. In this month, revenue might dip to $1,938, occupancy could drop to 26.7%, and ADRs may adjust down to $179.
- Understanding both the seasonal averages and these monthly peaks and troughs in revenue, occupancy, and ADR is crucial for maximizing your Airbnb profit potential in Westbrook.
Seasonal Strategies for Maximizing Profit
- Peak Season: Maximize revenue through premium pricing and potentially longer minimum stays. Ensure high availability.
- Low Season: Offer competitive pricing, special promotions (e.g., extended stay discounts), and flexible cancellation policies. Target off-season travelers like remote workers or budget-conscious guests.
- Shoulder Seasons: Implement dynamic pricing that balances peak and low rates. Target weekend travelers or specific events. Offer slightly more flexible terms than peak season.
- Regularly analyze your own performance against these Westbrook seasonality benchmarks and adjust your pricing and availability strategy accordingly.
Best Areas for Airbnb Investment in Westbrook (2026)
Exploring the top neighborhoods for short-term rentals in Westbrook? This section highlights key areas, outlining why they are attractive for hosts and guests, along with notable local attractions. Consider these locations based on your target guest profile and investment strategy.
| Neighborhood / Area | Why Host Here? (Target Guests & Appeal) | Key Attractions & Landmarks |
|---|---|---|
| Westbrook Beach | Beautiful beach with stunning views and warm waters, popular among families and beachgoers. Ideal for relaxing holiday getaways. | Westbrook Beach, Beachfront Restaurants, Surfing and Water Sports, Mlalazi Nature Reserve, Rock Pools |
| Balito | A vibrant coastal town known for its shopping, dining, and beautiful beaches. Attracts tourists seeking luxury and convenience. | Balito Junction, Thompson's Bay Beach, The Promenade, Zimbali Coastal Resort, Willard Beach |
| Salt Rock | Quieter beach area known for its scenic beauty and family-friendly environment. Great for a peaceful retreat. | Salt Rock Beach, Granny's Pool, Salmon Bay, Tidal Pool, Shopping and Dining near Beach |
| Umhlanga | Trendy tourist destination known for its beachfront luxury and vibrant nightlife. Hosts numerous attractions and activities year-round. | Umhlanga Rocks Beach, Gateway Theatre of Shopping, Umhlanga Lighthouse, Umhlanga Promenade, Restaurants and Nightlife |
| La Lucia | Upscale residential area with beautiful beaches and a serene atmosphere. Perfect for higher-end Airbnb guests. | La Lucia Mall, Hawaan Forest, Umhlanga Lagoon Nature Reserve, La Lucia Beach, Fine Dining Restaurants |
| Tongaat | A diverse and culturally-rich area with welcoming communities. Provides a unique experience for those seeking a local feel. | Tongaat Mall, Local Markets, Cultural Heritage Sites, Beaches nearby, Community Events |
| Kwadukuza (Stanger) | A historical town with rich Zulu heritage, offering unique cultural experiences and nearby attractions. | King Shaka Memorial, Historic Sites, Local Craft Markets, Near Beaches, Cultural Tours |
| Ballito | Sought-after holiday hotspot with a mix of beach life and modern conveniences. Attracts both local and international travelers. | Ballito Beach, Ballito Village, Beachfront Markets, Water Sports, Nature Reserves |
Understanding Airbnb License Requirements & STR Laws in Westbrook (2026)
While Westbrook, KwaZulu-Natal, South Africa currently shows low STR regulations, specific Airbnb license requirements might still exist or change. Always verify the latest short term rental regulations and Airbnb license requirements directly with local government authorities for Westbrook to ensure full compliance before hosting.
(Source: AirROI data, 2026, finding no licensed listings among those analyzed)
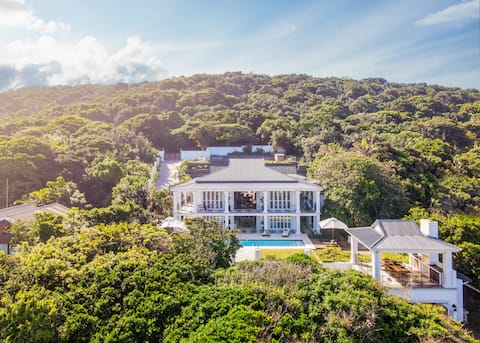
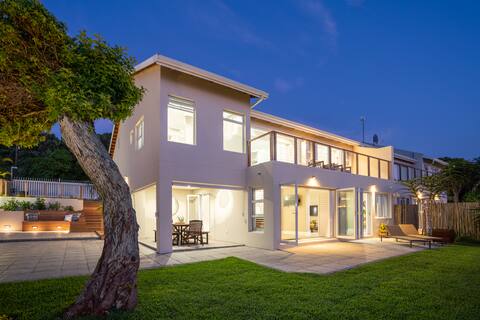
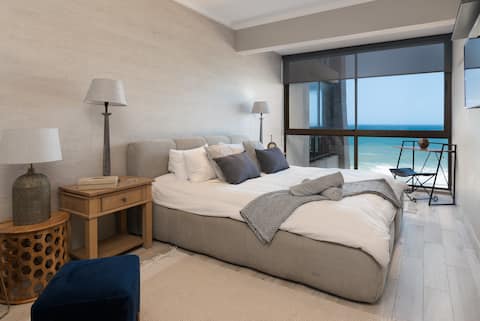
Top Performing Airbnb Properties in Westbrook (2026)
Benchmark your potential! Explore examples of top-performing Airbnb properties in Westbrookbased on Trailing Twelve Month (TTM) revenue. Analyze their characteristics, revenue, occupancy rate, and ADR to understand what drives success in this market.
Ocean Retreat. Luxury on the beach.
Entire Place • 8 bedrooms

Luxury Private Beach Villa between Umdloti Ballito
Entire Place • 6 bedrooms

Whitefoord Beach House
Entire Place • 7 bedrooms
Sun Sea Sky
Entire Place • 4 bedrooms

Beach House, Westbrook Beach KZN North Coast
Entire Place • 6 bedrooms
201 Bali Hai, Sea Facing Apartment- Westbrook
Entire Place • 3 bedrooms
Note: Performance varies based on location, size, amenities, seasonality, and management quality. Data reflects the past 12 months.
Top Performing Airbnb Hosts in Westbrook (2026)
Learn from the best! This table showcases top-performing Airbnb hosts in Westbrook based on the number of properties managed and estimated total revenue over the past year. Analyze their scale and performance metrics.
| Host Name | Properties | Grossing Revenue | Stay Reviews | Avg Rating |
|---|---|---|---|---|
| Michele | 3 | $309,101 | 94 | 4.99/5.0 |
| Luxury Coastal Escapes | 1 | $99,926 | 5 | 5.00/5.0 |
| Amanda | 1 | $69,851 | 59 | 4.90/5.0 |
| Janina | 1 | $45,258 | 59 | 4.83/5.0 |
| Leo And Kerry | 1 | $33,637 | 43 | 4.93/5.0 |
| Debra | 1 | $33,611 | 33 | 4.79/5.0 |
| Cathy | 6 | $29,142 | 61 | 4.38/5.0 |
| Sally | 1 | $20,353 | 18 | 4.50/5.0 |
| Carryn | 1 | $16,693 | 3 | 5.00/5.0 |
| Samantha | 1 | $15,392 | 16 | 4.75/5.0 |
Analyzing the strategies of top hosts, such as their property selection, pricing, and guest communication, can offer valuable lessons for optimizing your own Airbnb operations in Westbrook.
Dive Deeper: Advanced Westbrook STR Market Data (2026)
Ready to unlock more insights? AirROI provides access to advanced metrics and comprehensive Airbnb data for Westbrook. Explore detailed analytics beyond this report to refine your investment strategy, optimize pricing, and maximize your vacation rental profits.
Explore Advanced MetricsWestbrook Short-Term Rental Market Composition (2026): Property & Room Types
Room Type Distribution
Property Type Distribution
Market Composition Insights for Westbrook
- The Westbrook Airbnb market composition is heavily skewed towards Entire Home/Apt listings, which make up 94.9% of the 39 active rentals. This indicates strong guest preference for privacy and space.
- Looking at the property type distribution in Westbrook, Apartment/Condo properties are the most common (53.8%), reflecting the local real estate landscape.
- Houses represent a significant 46.2% portion, catering likely to families or larger groups.
Westbrook Airbnb Room Capacity Analysis (2026): Bedroom Distribution
Distribution of Listings by Number of Bedrooms
Room Capacity Insights for Westbrook
- The dominant room capacity in Westbrook is 3 bedrooms listings, making up 43.6% of the market. This suggests a strong demand for properties suitable for families or small groups.
- Together, 3 bedrooms and 5+ bedrooms properties represent 61.5% of the active Airbnb listings in Westbrook, indicating a high concentration in these sizes.
- A significant 69.2% of listings offer 3+ bedrooms, catering to larger groups and families seeking more space in Westbrook.
Westbrook Vacation Rental Guest Capacity Trends (2026)
Distribution of Listings by Guest Capacity
Guest Capacity Insights for Westbrook
- The most common guest capacity trend in Westbrook vacation rentals is listings accommodating 6 guests (38.5%). This suggests the primary traveler segment is likely larger groups.
- Properties designed for 6 guests and 8+ guests dominate the Westbrook STR market, accounting for 56.4% of listings.
- 64.1% of properties accommodate 6+ guests, serving the market segment for larger families or group travel in Westbrook.
- On average, properties in Westbrook are equipped to host 5.3 guests.
Westbrook Airbnb Booking Patterns (2026): Available vs. Booked Days
Available Days Distribution
Booked Days Distribution
Booking Pattern Insights for Westbrook
- The most common availability pattern in Westbrook falls within the 271-366 days range, representing 59% of listings. This suggests many properties have significant open periods on their calendars.
- Approximately 84.6% of listings show high availability (181+ days open annually), indicating potential for increased bookings or specific owner usage patterns.
- For booked days, the 31-90 days range is most frequent in Westbrook (30.8%), reflecting common guest stay durations or potential owner blocking patterns.
- A notable 15.4% of properties secure long booking periods (181+ days booked per year), highlighting successful long-term rental strategies or significant owner usage.
Westbrook Airbnb Minimum Stay Requirements Analysis
Distribution of Listings by Minimum Night Requirement
1 Night
6 listings
15.4% of total
2 Nights
5 listings
12.8% of total
3 Nights
2 listings
5.1% of total
4-6 Nights
4 listings
10.3% of total
7-29 Nights
1 listings
2.6% of total
30+ Nights
21 listings
53.8% of total
Key Insights
- The most prevalent minimum stay requirement in Westbrook is 30+ Nights, adopted by 53.8% of listings. This highlights the market's preference for longer commitments.
- A significant segment (53.8%) caters to monthly stays (30+ nights) in Westbrook, pointing to opportunities in the extended-stay market.
Recommendations
- Align with the market by considering a 30+ Nights minimum stay, as 53.8% of Westbrook hosts use this setting.
- If feasible, allowing 1-night stays, especially midweek or during low season, could capture last-minute bookings, as only 15.4% currently do.
- Explore offering discounts for stays of 30+ nights to attract the 53.8% of the market seeking extended stays.
- Adjust minimum nights based on seasonality – potentially shorter during low season and longer during peak demand periods in Westbrook.
Westbrook Airbnb Cancellation Policy Trends Analysis (2026)
Super Strict 30 Days
1 listings
2.6% of total
Flexible
7 listings
17.9% of total
Moderate
6 listings
15.4% of total
Firm
17 listings
43.6% of total
Strict
8 listings
20.5% of total
Cancellation Policy Insights for Westbrook
- The prevailing Airbnb cancellation policy trend in Westbrook is Firm, used by 43.6% of listings.
- A majority (64.1%) of hosts in Westbrook utilize Firm or Strict policies, indicating a market where hosts prioritize booking security.
Recommendations for Hosts
- Consider adopting a Firm policy to align with the 43.6% market standard in Westbrook.
- Regularly review your cancellation policy against competitors and market demand shifts in Westbrook.
Westbrook STR Booking Lead Time Analysis (2026)
Average Booking Lead Time by Month
Booking Lead Time Insights for Westbrook
- The overall average booking lead time for vacation rentals in Westbrook is 44 days.
- Guests book furthest in advance for stays during December (average 75 days), likely coinciding with peak travel demand or local events.
- The shortest booking windows occur for stays in June (average 21 days), indicating more last-minute travel plans during this time.
- Seasonally, Winter (57 days avg.) sees the longest lead times, while Summer (32 days avg.) has the shortest, reflecting typical travel planning cycles.
Recommendations for Hosts
- Use the overall average lead time (44 days) as a baseline for your pricing and availability strategy in Westbrook.
- For December stays, consider implementing length-of-stay discounts or slightly higher rates for bookings made less than 75 days out to capitalize on advance planning.
- Target marketing efforts for the Winter season well in advance (at least 57 days) to capture early planners.
- Monitor your own booking lead times against these Westbrook averages to identify opportunities for dynamic pricing adjustments.
Popular & Essential Airbnb Amenities in Westbrook (2026)
Amenity Prevalence
Amenity Insights for Westbrook
- Essential amenities in Westbrook that guests expect include: TV, Dishes and silverware, Free parking on premises. Lacking these (any) could significantly impact bookings.
- Popular amenities like Kitchen, Wifi, Beach access are common but not universal. Offering these can provide a competitive edge.
- Warning: Wifi is not universally provided but is considered essential globally. Ensure reliable Wifi is offered.
Recommendations for Hosts
- Ensure your listing includes all essential amenities for Westbrook: TV, Dishes and silverware, Free parking on premises.
- Prioritize adding missing essentials: TV, Dishes and silverware, Free parking on premises.
- Consider adding popular differentiators like Kitchen or Wifi to increase appeal.
- Highlight unique or less common amenities you offer (e.g., hot tub, dedicated workspace, EV charger) in your listing description and photos.
- Regularly check competitor amenities in Westbrook to stay competitive.
Westbrook Airbnb Guest Demographics & Profile Analysis (2026)
Guest Profile Summary for Westbrook
- The typical guest profile for Airbnb in Westbrook consists of primarily domestic travelers (78%), often arriving from nearby Johannesburg, typically belonging to the Post-2000s (Gen Z/Alpha) group (50%), primarily speaking English or Afrikaans.
- Domestic travelers account for 77.6% of guests.
- Key international markets include South Africa (77.6%) and United Kingdom (4.3%).
- Top languages spoken are English (56.5%) followed by Afrikaans (17.7%).
- A significant demographic segment is the Post-2000s (Gen Z/Alpha) group, representing 50% of guests.
Recommendations for Hosts
- Target domestic marketing efforts towards travelers from Johannesburg and Pretoria.
- Tailor amenities and listing descriptions to appeal to the dominant Post-2000s (Gen Z/Alpha) demographic (e.g., highlight fast WiFi, smart home features, local guides).
- Highlight unique local experiences or amenities relevant to the primary guest profile.
- Consider seasonal promotions aligned with peak travel times for key origin markets.
Nearby Short-Term Rental Market Comparison
How does the Westbrook Airbnb market stack up against its neighbors? Compare key performance metrics like average monthly revenue, ADR, and occupancy rates in surrounding areas to understand the broader regional STR landscape.
| Market | Active Properties | Monthly Revenue | Daily Rate | Avg. Occupancy |
|---|---|---|---|---|
| KwaDukuza Local Municipality | 1,500 | $1,246 | $190.76 | 30% |
| Umhlanga Rocks | 745 | $1,058 | $143.97 | 32% |
| Ballito | 122 | $1,000 | $158.21 | 31% |
| Umdloti / eMdloti | 325 | $997 | $128.71 | 34% |
| uMgeni Local Municipality | 387 | $949 | $108.51 | 33% |
| Umkomaas | 13 | $901 | $90.76 | 34% |
| eMdloti | 14 | $829 | $125.74 | 32% |
| La Mercy | 25 | $771 | $112.39 | 26% |
| uMdoni Local Municipality | 152 | $752 | $124.79 | 26% |
| uMhlanga | 49 | $726 | $115.45 | 30% |