Hartbeespoort Airbnb Market Analysis 2026: Short Term Rental Data & Vacation Rental Statistics in North West, South Africa
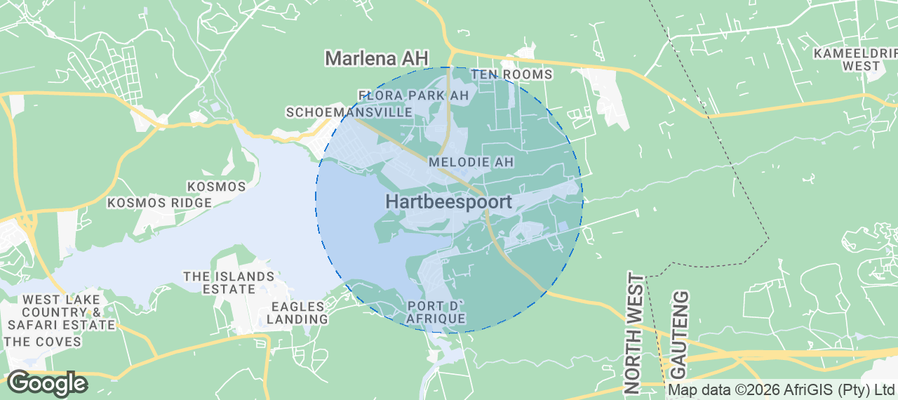
Is Airbnb profitable in Hartbeespoort in 2026? Explore comprehensive Airbnb analytics for Hartbeespoort, North West, South Africa to uncover income potential. This 2026 STR market report for Hartbeespoort, based on AirROI data from February 2025 to January 2026, reveals key trends in the niche market of 23 active listings.
Whether you're considering an Airbnb investment in Hartbeespoort, optimizing your existing vacation rental, or exploring rental arbitrage opportunities, understanding the Hartbeespoort Airbnb data is crucial. Leveraging the low regulation environment is key to maximizing your short term rental income potential. Let's dive into the specifics.
Key Hartbeespoort Airbnb Performance Metrics Overview
Monthly Airbnb Revenue Variations & Income Potential in Hartbeespoort (2026)
Understanding the monthly revenue variations for Airbnb listings in Hartbeespoort is key to maximizing your short term rental income potential. Seasonality significantly impacts earnings. Our analysis, based on data from the past 12 months, shows that the peak revenue month for STRs in Hartbeespoort is typically December, while May often presents the lowest earnings, highlighting opportunities for strategic pricing adjustments during shoulder and low seasons. Explore the typical Airbnb income in Hartbeespoort across different performance tiers:
- Best-in-class properties (Top 10%) achieve $1,928+ monthly, often utilizing dynamic pricing and superior guest experiences.
- Strong performing properties (Top 25%) earn $1,086 or more, indicating effective management and desirable locations/amenities.
- Typical properties (Median) generate around $574 per month, representing the average market performance.
- Entry-level properties (Bottom 25%) see earnings around $415, often with potential for optimization.
Average Monthly Airbnb Earnings Trend in Hartbeespoort
Hartbeespoort Airbnb Occupancy Rate Trends (2026)
Maximize your bookings by understanding the Hartbeespoort STR occupancy trends. Seasonal demand shifts significantly influence how often properties are booked. Typically, Decembersees the highest demand (peak season occupancy), while May experiences the lowest (low season). Effective strategies, like adjusting minimum stays or offering promotions, can boost occupancy during slower periods. Here's how different property tiers perform in Hartbeespoort:
- Best-in-class properties (Top 10%) achieve 39%+ occupancy, indicating high desirability and potentially optimized availability.
- Strong performing properties (Top 25%) maintain 31% or higher occupancy, suggesting good market fit and guest satisfaction.
- Typical properties (Median) have an occupancy rate around 23%.
- Entry-level properties (Bottom 25%) average 18% occupancy, potentially facing higher vacancy.
Average Monthly Occupancy Rate Trend in Hartbeespoort
Average Daily Rate (ADR) Airbnb Trends in Hartbeespoort (2026)
Effective short term rental pricing strategy in Hartbeespoort involves understanding monthly ADR fluctuations. The Average Daily Rate (ADR) for Airbnb in Hartbeespoort typically peaks in December and dips lowest during August. Leveraging Airbnb dynamic pricing tools or strategies based on this seasonality can significantly boost revenue. Here's a look at the typical nightly rates achieved:
- Best-in-class properties (Top 10%) command rates of $274+ per night, often due to premium features or locations.
- Strong performing properties (Top 25%) achieve nightly rates of $217 or more.
- Typical properties (Median) charge around $97 per night.
- Entry-level properties (Bottom 25%) earn around $54 per night.
Average Daily Rate (ADR) Trend by Month in Hartbeespoort
Get Live Hartbeespoort Market Intelligence 👇
Explore Real-time Analytics
Airbnb Seasonality Analysis & Trends in Hartbeespoort (2026)
Peak Season (December, October, July)
- Revenue averages $1,314 per month
- Occupancy rates average 29.3%
- Daily rates average $147
Shoulder Season
- Revenue averages $797 per month
- Occupancy maintains around 24.1%
- Daily rates hold near $133
Low Season (March, April, May)
- Revenue drops to average $482 per month
- Occupancy decreases to average 24.9%
- Daily rates adjust to average $122
Seasonality Insights for Hartbeespoort
- The Airbnb seasonality in Hartbeespoort shows highly seasonal trends requiring careful strategy. While the sections above show seasonal averages, it's also insightful to look at the extremes:
- During the high season, the absolute peak month showcases Hartbeespoort's highest earning potential, with monthly revenues capable of climbing to $1,847, occupancy reaching a high of 38.3%, and ADRs peaking at $169.
- Conversely, the slowest single month of the year, typically falling within the low season, marks the market's lowest point. In this month, revenue might dip to $287, occupancy could drop to 9.1%, and ADRs may adjust down to $113.
- Understanding both the seasonal averages and these monthly peaks and troughs in revenue, occupancy, and ADR is crucial for maximizing your Airbnb profit potential in Hartbeespoort.
Seasonal Strategies for Maximizing Profit
- Peak Season: Maximize revenue through premium pricing and potentially longer minimum stays. Ensure high availability.
- Low Season: Offer competitive pricing, special promotions (e.g., extended stay discounts), and flexible cancellation policies. Target off-season travelers like remote workers or budget-conscious guests.
- Shoulder Seasons: Implement dynamic pricing that balances peak and low rates. Target weekend travelers or specific events. Offer slightly more flexible terms than peak season.
- Regularly analyze your own performance against these Hartbeespoort seasonality benchmarks and adjust your pricing and availability strategy accordingly.
Best Areas for Airbnb Investment in Hartbeespoort (2026)
Exploring the top neighborhoods for short-term rentals in Hartbeespoort? This section highlights key areas, outlining why they are attractive for hosts and guests, along with notable local attractions. Consider these locations based on your target guest profile and investment strategy.
| Neighborhood / Area | Why Host Here? (Target Guests & Appeal) | Key Attractions & Landmarks |
|---|---|---|
| Harties Waterfront | A popular destination at the water's edge, offering water sports, restaurants, and picturesque views. Ideal for tourists looking for a lakeside retreat and adventure activities. | Hartbeespoort Dam, Aerial Cableway, Old Stone Bridge, Margaret Roberts Herbal Centre |
| The Cradle of Humankind | A UNESCO World Heritage Site known for its rich history and archaeological significance. Great for cultural travelers and families interested in education and nature. | Maropeng Visitor Centre, Sterkfontein Caves, The Lion & Safari Park |
| Pecanwood Estate | An upscale residential estate with stunning views and a golf course. Attractive for guests looking for luxury accommodations in a serene environment. | Pecanwood Golf Course, Hartbeespoort Dam views, Clubhouse facilities |
| Schoemansville | Close to the dam and filled with charming lodges and eateries. Appeals to families and couples looking for a relaxed getaway. | Margaret Roberts Herbal Centre, Schoemansville Oewer Club, Klapperkop, The Elephant Sanctuary |
| Kosmos | A picturesque village located on the banks of Hartbeespoort Dam, known for its stunning sunsets and waterfront properties. Perfect for romantic getaways and nature lovers. | Kosmos Marina, Sunset Cruises, Bird watching |
| Brits | Nearby town with a growing number of attractions and facilities, offering a more local experience. Great for budget-conscious travelers and those looking for authentic experiences. | The Brits Mall, Jubilee Mall, Game Viewing |
| Zandfontein | A quiet area known for its peace and tranquility, ideal for those wanting to escape the busyness of city life. Attracts nature lovers and people looking for relaxation. | Nature Reserves, Hiking Trails, Bird Watching |
| Mabula | A bit further out, but offers a unique safari experience. Great for guests who want to explore wildlife and enjoy outdoor activities. | Mabula Game Lodge, Wildlife Safaris, Horseback Riding |
Understanding Airbnb License Requirements & STR Laws in Hartbeespoort (2026)
While Hartbeespoort, North West, South Africa currently shows low STR regulations, specific Airbnb license requirements might still exist or change. Always verify the latest short term rental regulations and Airbnb license requirements directly with local government authorities for Hartbeespoort to ensure full compliance before hosting.
(Source: AirROI data, 2026, finding no licensed listings among those analyzed)
Top Performing Airbnb Properties in Hartbeespoort (2026)
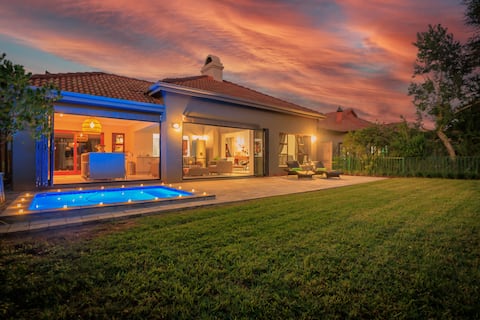
Benchmark your potential! Explore examples of top-performing Airbnb properties in Hartbeespoortbased on Trailing Twelve Month (TTM) revenue. Analyze their characteristics, revenue, occupancy rate, and ADR to understand what drives success in this market.

Pecanwood Villa with golf course & lake view
Entire Place • 5 bedrooms
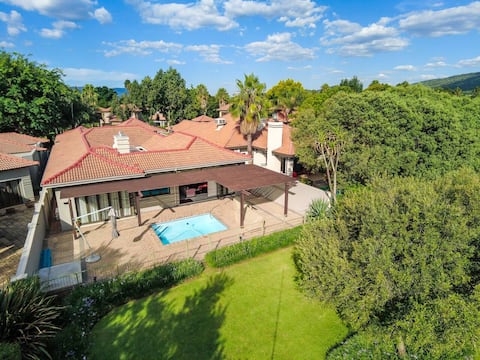
Bunkers Paradise at Pecanwood
Entire Place • 4 bedrooms
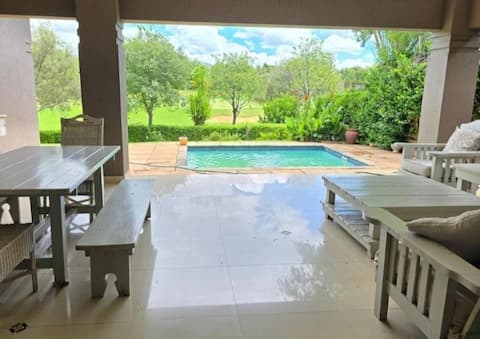
1 on Cormorant - Pecanwood Hartbeespoort
Entire Place • 3 bedrooms
Pecanwood Dream Home • Hartbeesport Dam
Entire Place • 4 bedrooms
Pecanwood 5 Bed's 10 Fairview Dr
Entire Place • 5 bedrooms
Olives by Agnes 33
Entire Place • 3 bedrooms
Note: Performance varies based on location, size, amenities, seasonality, and management quality. Data reflects the past 12 months.
Top Performing Airbnb Hosts in Hartbeespoort (2026)
Learn from the best! This table showcases top-performing Airbnb hosts in Hartbeespoort based on the number of properties managed and estimated total revenue over the past year. Analyze their scale and performance metrics.
| Host Name | Properties | Grossing Revenue | Stay Reviews | Avg Rating |
|---|---|---|---|---|
| Cherne | 2 | $30,260 | 15 | 4.79/5.0 |
| Samantha | 2 | $18,416 | 6 | 5.00/5.0 |
| Antonette | 1 | $15,855 | 7 | 4.14/5.0 |
| Dirk | 4 | $14,500 | 39 | 4.06/5.0 |
| Len | 2 | $13,050 | 50 | 4.81/5.0 |
| RnR Holidays | 1 | $11,629 | 2 | Not Rated |
| Mmaphuthi | 1 | $11,227 | 1 | Not Rated |
| Grace | 2 | $8,494 | 8 | 4.29/5.0 |
| Janine | 1 | $7,039 | 11 | 4.91/5.0 |
| Carl | 2 | $5,240 | 4 | Not Rated |
Analyzing the strategies of top hosts, such as their property selection, pricing, and guest communication, can offer valuable lessons for optimizing your own Airbnb operations in Hartbeespoort.
Dive Deeper: Advanced Hartbeespoort STR Market Data (2026)
Ready to unlock more insights? AirROI provides access to advanced metrics and comprehensive Airbnb data for Hartbeespoort. Explore detailed analytics beyond this report to refine your investment strategy, optimize pricing, and maximize your vacation rental profits.
Explore Advanced MetricsHartbeespoort Short-Term Rental Market Composition (2026): Property & Room Types
Room Type Distribution
Property Type Distribution
Market Composition Insights for Hartbeespoort
- The Hartbeespoort Airbnb market composition is heavily skewed towards Entire Home/Apt listings, which make up 73.9% of the 23 active rentals. This indicates strong guest preference for privacy and space.
- Looking at the property type distribution in Hartbeespoort, House properties are the most common (52.2%), reflecting the local real estate landscape.
- Houses represent a significant 52.2% portion, catering likely to families or larger groups.
- The presence of 17.4% Hotel/Boutique listings indicates integration with traditional hospitality.
Hartbeespoort Airbnb Room Capacity Analysis (2026): Bedroom Distribution
Distribution of Listings by Number of Bedrooms
Room Capacity Insights for Hartbeespoort
- The dominant room capacity in Hartbeespoort is 1 bedroom listings, making up 39.1% of the market. This suggests a strong demand for properties suitable for couples or solo travelers.
- Together, 1 bedroom and 3 bedrooms properties represent 60.8% of the active Airbnb listings in Hartbeespoort, indicating a high concentration in these sizes.
- A significant 47.8% of listings offer 3+ bedrooms, catering to larger groups and families seeking more space in Hartbeespoort.
Hartbeespoort Vacation Rental Guest Capacity Trends (2026)
Distribution of Listings by Guest Capacity
Guest Capacity Insights for Hartbeespoort
- The most common guest capacity trend in Hartbeespoort vacation rentals is listings accommodating 2 guests (39.1%). This suggests the primary traveler segment is likely couples or solo travelers.
- Properties designed for 2 guests and 8+ guests dominate the Hartbeespoort STR market, accounting for 65.2% of listings.
- 47.8% of properties accommodate 6+ guests, serving the market segment for larger families or group travel in Hartbeespoort.
- On average, properties in Hartbeespoort are equipped to host 4.3 guests.
Hartbeespoort Airbnb Booking Patterns (2026): Available vs. Booked Days
Available Days Distribution
Booked Days Distribution
Booking Pattern Insights for Hartbeespoort
- The most common availability pattern in Hartbeespoort falls within the 271-366 days range, representing 95.7% of listings. This suggests many properties have significant open periods on their calendars.
- Approximately 100.0% of listings show high availability (181+ days open annually), indicating potential for increased bookings or specific owner usage patterns.
- For booked days, the 31-90 days range is most frequent in Hartbeespoort (69.6%), reflecting common guest stay durations or potential owner blocking patterns.
Hartbeespoort Airbnb Minimum Stay Requirements Analysis
Distribution of Listings by Minimum Night Requirement
1 Night
14 listings
60.9% of total
2 Nights
4 listings
17.4% of total
30+ Nights
5 listings
21.7% of total
Key Insights
- The most prevalent minimum stay requirement in Hartbeespoort is 1 Night, adopted by 60.9% of listings. This highlights the market's preference for shorter, flexible bookings.
- A strong majority (78.3%) of the Hartbeespoort Airbnb data shows acceptance of very short stays (1-2 nights), indicating a dynamic, high-turnover market.
- A significant segment (21.7%) caters to monthly stays (30+ nights) in Hartbeespoort, pointing to opportunities in the extended-stay market.
Recommendations
- Align with the market by considering a 1 Night minimum stay, as 60.9% of Hartbeespoort hosts use this setting.
- Explore offering discounts for stays of 30+ nights to attract the 21.7% of the market seeking extended stays.
- Adjust minimum nights based on seasonality – potentially shorter during low season and longer during peak demand periods in Hartbeespoort.
Hartbeespoort Airbnb Cancellation Policy Trends Analysis (2026)
Super Strict 30 Days
1 listings
4.3% of total
Limited
2 listings
8.7% of total
Refundable
3 listings
13% of total
Flexible
10 listings
43.5% of total
Moderate
2 listings
8.7% of total
Firm
5 listings
21.7% of total
Cancellation Policy Insights for Hartbeespoort
- The prevailing Airbnb cancellation policy trend in Hartbeespoort is Flexible, used by 43.5% of listings.
- There's a relatively balanced mix between guest-friendly (52.2%) and stricter (21.7%) policies, offering choices for different guest needs.
Recommendations for Hosts
- Consider adopting a Flexible policy to align with the 43.5% market standard in Hartbeespoort.
- Regularly review your cancellation policy against competitors and market demand shifts in Hartbeespoort.
Hartbeespoort STR Booking Lead Time Analysis (2026)
Average Booking Lead Time by Month
Booking Lead Time Insights for Hartbeespoort
- The overall average booking lead time for vacation rentals in Hartbeespoort is 32 days.
- Guests book furthest in advance for stays during March (average 120 days), likely coinciding with peak travel demand or local events.
- The shortest booking windows occur for stays in May (average 11 days), indicating more last-minute travel plans during this time.
- Seasonally, Spring (79 days avg.) sees the longest lead times, while Summer (17 days avg.) has the shortest, reflecting typical travel planning cycles.
Recommendations for Hosts
- Use the overall average lead time (32 days) as a baseline for your pricing and availability strategy in Hartbeespoort.
- For March stays, consider implementing length-of-stay discounts or slightly higher rates for bookings made less than 120 days out to capitalize on advance planning.
- During May, focus on last-minute booking availability and promotions, as guests book with very short notice (11 days avg.).
- Target marketing efforts for the Spring season well in advance (at least 79 days) to capture early planners.
- Monitor your own booking lead times against these Hartbeespoort averages to identify opportunities for dynamic pricing adjustments.
Popular & Essential Airbnb Amenities in Hartbeespoort (2026)
Amenity Prevalence
Amenity Insights for Hartbeespoort
- Essential amenities in Hartbeespoort that guests expect include: Free parking on premises, Wifi. Lacking these (any) could significantly impact bookings.
- Popular amenities like TV, Pool, Kitchen are common but not universal. Offering these can provide a competitive edge.
- A pool is a highly desired but not standard amenity, making it a key feature for attracting guests seeking leisure in Hartbeespoort.
Recommendations for Hosts
- Ensure your listing includes all essential amenities for Hartbeespoort: Free parking on premises, Wifi.
- Prioritize adding missing essentials: Wifi.
- Consider adding popular differentiators like TV or Pool to increase appeal.
- Highlight unique or less common amenities you offer (e.g., hot tub, dedicated workspace, EV charger) in your listing description and photos.
- Regularly check competitor amenities in Hartbeespoort to stay competitive.
Hartbeespoort Airbnb Guest Demographics & Profile Analysis (2026)
Guest Profile Summary for Hartbeespoort
- The typical guest profile for Airbnb in Hartbeespoort consists of primarily domestic travelers (85%), often arriving from nearby Johannesburg, typically belonging to the Post-2000s (Gen Z/Alpha) group (50%), primarily speaking English or Afrikaans.
- Domestic travelers account for 85.0% of guests.
- Key international markets include South Africa (85%) and United Kingdom (3.3%).
- Top languages spoken are English (65.7%) followed by Afrikaans (11.4%).
- A significant demographic segment is the Post-2000s (Gen Z/Alpha) group, representing 50% of guests.
Recommendations for Hosts
- Target domestic marketing efforts towards travelers from Johannesburg and Midrand.
- Tailor amenities and listing descriptions to appeal to the dominant Post-2000s (Gen Z/Alpha) demographic (e.g., highlight fast WiFi, smart home features, local guides).
- Highlight unique local experiences or amenities relevant to the primary guest profile.
- Consider seasonal promotions aligned with peak travel times for key origin markets.
Nearby Short-Term Rental Market Comparison
How does the Hartbeespoort Airbnb market stack up against its neighbors? Compare key performance metrics like average monthly revenue, ADR, and occupancy rates in surrounding areas to understand the broader regional STR landscape.
| Market | Active Properties | Monthly Revenue | Daily Rate | Avg. Occupancy |
|---|---|---|---|---|
| Moses Kotane Local Municipality | 55 | $1,717 | $266.95 | 31% |
| Bela Bela Local Municipality | 256 | $1,699 | $274.35 | 25% |
| Bela-Bela | 23 | $1,330 | $300.72 | 26% |
| Metsimaholo Local Municipality | 44 | $1,245 | $153.66 | 24% |
| Madibeng Local Municipality | 295 | $902 | $144.17 | 24% |
| Hammanskraal | 11 | $841 | $123.29 | 26% |
| Mookgopong Local Municipality | 33 | $796 | $216.06 | 22% |
| Ngwathe Local Municipality | 102 | $760 | $115.68 | 25% |
| Rosebank | 612 | $692 | $78.11 | 38% |
| Emfuleni Local Municipality | 101 | $640 | $134.88 | 19% |