ǁKhara Hais Local Municipality Airbnb Market Analysis 2026: Short Term Rental Data & Vacation Rental Statistics in Northern Cape, South Africa
Is Airbnb profitable in ǁKhara Hais Local Municipality in 2026? Explore comprehensive Airbnb analytics for ǁKhara Hais Local Municipality, Northern Cape, South Africa to uncover income potential. This 2026 STR market report for ǁKhara Hais Local Municipality, based on AirROI data from February 2025 to January 2026, reveals key trends in the niche market of 43 active listings.
Whether you're considering an Airbnb investment in ǁKhara Hais Local Municipality, optimizing your existing vacation rental, or exploring rental arbitrage opportunities, understanding the ǁKhara Hais Local Municipality Airbnb data is crucial. Leveraging the low regulation environment is key to maximizing your short term rental income potential. Let's dive into the specifics.
Key ǁKhara Hais Local Municipality Airbnb Performance Metrics Overview
Monthly Airbnb Revenue Variations & Income Potential in ǁKhara Hais Local Municipality (2026)
Understanding the monthly revenue variations for Airbnb listings in ǁKhara Hais Local Municipality is key to maximizing your short term rental income potential. Seasonality significantly impacts earnings. Our analysis, based on data from the past 12 months, shows that the peak revenue month for STRs in ǁKhara Hais Local Municipality is typically February, while January often presents the lowest earnings, highlighting opportunities for strategic pricing adjustments during shoulder and low seasons. Explore the typical Airbnb income in ǁKhara Hais Local Municipality across different performance tiers:
- Best-in-class properties (Top 10%) achieve $820+ monthly, often utilizing dynamic pricing and superior guest experiences.
- Strong performing properties (Top 25%) earn $504 or more, indicating effective management and desirable locations/amenities.
- Typical properties (Median) generate around $310 per month, representing the average market performance.
- Entry-level properties (Bottom 25%) see earnings around $174, often with potential for optimization.
Average Monthly Airbnb Earnings Trend in ǁKhara Hais Local Municipality
ǁKhara Hais Local Municipality Airbnb Occupancy Rate Trends (2026)
Maximize your bookings by understanding the ǁKhara Hais Local Municipality STR occupancy trends. Seasonal demand shifts significantly influence how often properties are booked. Typically, Marchsees the highest demand (peak season occupancy), while June experiences the lowest (low season). Effective strategies, like adjusting minimum stays or offering promotions, can boost occupancy during slower periods. Here's how different property tiers perform in ǁKhara Hais Local Municipality:
- Best-in-class properties (Top 10%) achieve 54%+ occupancy, indicating high desirability and potentially optimized availability.
- Strong performing properties (Top 25%) maintain 35% or higher occupancy, suggesting good market fit and guest satisfaction.
- Typical properties (Median) have an occupancy rate around 22%.
- Entry-level properties (Bottom 25%) average 10% occupancy, potentially facing higher vacancy.
Average Monthly Occupancy Rate Trend in ǁKhara Hais Local Municipality
Average Daily Rate (ADR) Airbnb Trends in ǁKhara Hais Local Municipality (2026)
Effective short term rental pricing strategy in ǁKhara Hais Local Municipality involves understanding monthly ADR fluctuations. The Average Daily Rate (ADR) for Airbnb in ǁKhara Hais Local Municipality typically peaks in August and dips lowest during September. Leveraging Airbnb dynamic pricing tools or strategies based on this seasonality can significantly boost revenue. Here's a look at the typical nightly rates achieved:
- Best-in-class properties (Top 10%) command rates of $89+ per night, often due to premium features or locations.
- Strong performing properties (Top 25%) achieve nightly rates of $64 or more.
- Typical properties (Median) charge around $51 per night.
- Entry-level properties (Bottom 25%) earn around $43 per night.
Average Daily Rate (ADR) Trend by Month in ǁKhara Hais Local Municipality
Get Live ǁKhara Hais Local Municipality Market Intelligence 👇

Explore Real-time Analytics
Airbnb Seasonality Analysis & Trends in ǁKhara Hais Local Municipality (2026)
Peak Season (February, December, March)
- Revenue averages $469 per month
- Occupancy rates average 32.0%
- Daily rates average $59
Shoulder Season
- Revenue averages $390 per month
- Occupancy maintains around 26.1%
- Daily rates hold near $58
Low Season (January, June, September)
- Revenue drops to average $287 per month
- Occupancy decreases to average 18.7%
- Daily rates adjust to average $58
Seasonality Insights for ǁKhara Hais Local Municipality
- The Airbnb seasonality in ǁKhara Hais Local Municipality shows moderate seasonality with distinct peak and low periods. While the sections above show seasonal averages, it's also insightful to look at the extremes:
- During the high season, the absolute peak month showcases ǁKhara Hais Local Municipality's highest earning potential, with monthly revenues capable of climbing to $474, occupancy reaching a high of 34.3%, and ADRs peaking at $60.
- Conversely, the slowest single month of the year, typically falling within the low season, marks the market's lowest point. In this month, revenue might dip to $279, occupancy could drop to 17.6%, and ADRs may adjust down to $55.
- Understanding both the seasonal averages and these monthly peaks and troughs in revenue, occupancy, and ADR is crucial for maximizing your Airbnb profit potential in ǁKhara Hais Local Municipality.
Seasonal Strategies for Maximizing Profit
- Peak Season: Maximize revenue through premium pricing and potentially longer minimum stays. Ensure high availability.
- Low Season: Offer competitive pricing, special promotions (e.g., extended stay discounts), and flexible cancellation policies. Target off-season travelers like remote workers or budget-conscious guests.
- Shoulder Seasons: Implement dynamic pricing that balances peak and low rates. Target weekend travelers or specific events. Offer slightly more flexible terms than peak season.
- Regularly analyze your own performance against these ǁKhara Hais Local Municipality seasonality benchmarks and adjust your pricing and availability strategy accordingly.
Best Areas for Airbnb Investment in ǁKhara Hais Local Municipality (2026)
Exploring the top neighborhoods for short-term rentals in ǁKhara Hais Local Municipality? This section highlights key areas, outlining why they are attractive for hosts and guests, along with notable local attractions. Consider these locations based on your target guest profile and investment strategy.
| Neighborhood / Area | Why Host Here? (Target Guests & Appeal) | Key Attractions & Landmarks |
|---|---|---|
| Kuruman | Known as the 'Gateway to the Kalahari', Kuruman is an important town with a rich history and cultural significance. It attracts tourists interested in exploring the Kalahari Desert and historical sites. | The Eye of Kuruman, Mokala National Park, Kuruman Historical Village, Kalahari Meerkat Project, Tswalu Kalahari Reserve |
| Laxey | Laxey provides a tranquil rural setting popular with nature lovers and those looking for a peaceful retreat. It's suitable for guests who appreciate starry skies and beautiful landscapes. | Scenic Hiking Trails, Local Farmlands, Nature Reserves, Rural Experiences |
| Mokala National Park | This national park is a major draw for wildlife enthusiasts. Offering safari experiences and game viewing, it caters to travelers seeking outdoor adventures. | Wildlife Safaris, Birdwatching, Game Drives, Stargazing |
| Prieska | A small town with a rich diamond mining history, Prieska attracts visitors looking for a glimpse of the mining culture and offers a gateway to the surrounding Kalahari. | Prieska Diamond Mine, Historical Sites, Kalahari Trails, Cultural Experiences |
| Postmasburg | Known for its mining activities, Postmasburg serves as an access point to beautiful landscapes and offers a unique glimpse into local mining culture. | Postmasburg Mines, Historical Landmarks, Cultural Tours |
| Namies | A small, quiet village ideal for guests looking for solitude and natural beauty, great for retreats and reconnecting with nature. | Natural Reserves, Cultural Exploration, Quiet Retreats |
| Kathu | Home to the renowned Kumba Iron Ore mine, Kathu is a hub for laborers and professionals, often visited for business and workforce accommodations. | Kumba Iron Ore Mine, Kathu Glof Club, Historical Mining Tours |
| Siyanda District | This district offers a mix of cultural diversity and natural beauty, popular for those looking to engage with the local culture while exploring the area. | Cultural Festivals, Natural Landscapes, Local Craft Markets |
Understanding Airbnb License Requirements & STR Laws in ǁKhara Hais Local Municipality (2026)
While ǁKhara Hais Local Municipality, Northern Cape, South Africa currently shows low STR regulations, specific Airbnb license requirements might still exist or change. Always verify the latest short term rental regulations and Airbnb license requirements directly with local government authorities for ǁKhara Hais Local Municipality to ensure full compliance before hosting.
(Source: AirROI data, 2026, based on 2% licensed listings)
Top Performing Airbnb Properties in ǁKhara Hais Local Municipality (2026)
Benchmark your potential! Explore examples of top-performing Airbnb properties in ǁKhara Hais Local Municipalitybased on Trailing Twelve Month (TTM) revenue. Analyze their characteristics, revenue, occupancy rate, and ADR to understand what drives success in this market.

Channel cage
Entire Place • 2 bedrooms
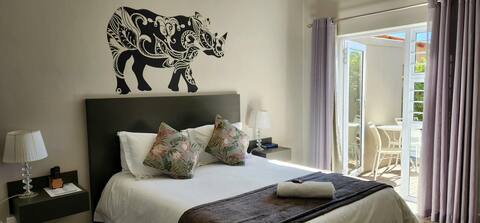
Rhino | Deluxe Double – Spacious & Modern
Private Room • 1 bedroom

Modern Executive Stay
Entire Place • 3 bedrooms

Leopard | Deluxe Double with Elegant Décor
Private Room • 1 bedroom

Be My Guest | Grateful
Private Room • 1 bedroom

Steenbok self catering accommodation
Entire Place • 1 bedroom
Note: Performance varies based on location, size, amenities, seasonality, and management quality. Data reflects the past 12 months.
Top Performing Airbnb Hosts in ǁKhara Hais Local Municipality (2026)
Learn from the best! This table showcases top-performing Airbnb hosts in ǁKhara Hais Local Municipality based on the number of properties managed and estimated total revenue over the past year. Analyze their scale and performance metrics.
| Host Name | Properties | Grossing Revenue | Stay Reviews | Avg Rating |
|---|---|---|---|---|
| Green Kalahari Guesthouse | 5 | $28,646 | 43 | 4.92/5.0 |
| Lèzel | 5 | $23,583 | 35 | 4.66/5.0 |
| Anneke | 1 | $10,799 | 65 | 4.82/5.0 |
| Alta | 3 | $10,376 | 9 | 4.67/5.0 |
| Nontanda | 1 | $9,990 | 30 | 4.50/5.0 |
| The Cape Lodge | 2 | $9,464 | 11 | 4.33/5.0 |
| Sonelle | 2 | $5,783 | 129 | 4.77/5.0 |
| Jana | 1 | $5,573 | 50 | 4.80/5.0 |
| Vanessa Viola | 2 | $5,317 | 42 | 4.58/5.0 |
| Sandra | 1 | $3,718 | 27 | 4.96/5.0 |
Analyzing the strategies of top hosts, such as their property selection, pricing, and guest communication, can offer valuable lessons for optimizing your own Airbnb operations in ǁKhara Hais Local Municipality.
Dive Deeper: Advanced ǁKhara Hais Local Municipality STR Market Data (2026)
Ready to unlock more insights? AirROI provides access to advanced metrics and comprehensive Airbnb data for ǁKhara Hais Local Municipality. Explore detailed analytics beyond this report to refine your investment strategy, optimize pricing, and maximize your vacation rental profits.
Explore Advanced MetricsǁKhara Hais Local Municipality Short-Term Rental Market Composition (2026): Property & Room Types
Room Type Distribution
Property Type Distribution
Market Composition Insights for ǁKhara Hais Local Municipality
- The ǁKhara Hais Local Municipality Airbnb market composition is heavily skewed towards Private Room listings, which make up 55.8% of the 43 active rentals. This indicates strong guest preference for privacy and space.
- Looking at the property type distribution in ǁKhara Hais Local Municipality, Hotel/Boutique properties are the most common (55.8%), reflecting the local real estate landscape.
- The presence of 55.8% Hotel/Boutique listings indicates integration with traditional hospitality.
- Smaller segments like outdoor/unique (combined 2.3%) offer potential for unique stay experiences.
ǁKhara Hais Local Municipality Airbnb Room Capacity Analysis (2026): Bedroom Distribution
Distribution of Listings by Number of Bedrooms
Room Capacity Insights for ǁKhara Hais Local Municipality
- The dominant room capacity in ǁKhara Hais Local Municipality is 1 bedroom listings, making up 67.4% of the market. This suggests a strong demand for properties suitable for couples or solo travelers.
- Together, 1 bedroom and 2 bedrooms properties represent 86.0% of the active Airbnb listings in ǁKhara Hais Local Municipality, indicating a high concentration in these sizes.
- With over half the market (67.4%) consisting of studios or 1-bedroom units, ǁKhara Hais Local Municipality is particularly well-suited for individuals or couples.
- Listings with 3+ bedrooms (7.0%) represent a smaller niche, potentially indicating an underserved market for larger group accommodations in ǁKhara Hais Local Municipality.
ǁKhara Hais Local Municipality Vacation Rental Guest Capacity Trends (2026)
Distribution of Listings by Guest Capacity
Guest Capacity Insights for ǁKhara Hais Local Municipality
- The most common guest capacity trend in ǁKhara Hais Local Municipality vacation rentals is listings accommodating 2 guests (44.2%). This suggests the primary traveler segment is likely couples or solo travelers.
- Properties designed for 2 guests and 4 guests dominate the ǁKhara Hais Local Municipality STR market, accounting for 74.4% of listings.
- A significant 46.5% of listings cater specifically to 1-2 guests, highlighting strong demand from couples and solo travelers in ǁKhara Hais Local Municipality.
- Listings for large groups (6+ guests) are relatively rare (4.6%), potentially indicating an opportunity for hosts targeting this segment in ǁKhara Hais Local Municipality.
- On average, properties in ǁKhara Hais Local Municipality are equipped to host 3.1 guests.
ǁKhara Hais Local Municipality Airbnb Booking Patterns (2026): Available vs. Booked Days
Available Days Distribution
Booked Days Distribution
Booking Pattern Insights for ǁKhara Hais Local Municipality
- The most common availability pattern in ǁKhara Hais Local Municipality falls within the 271-366 days range, representing 65.1% of listings. This suggests many properties have significant open periods on their calendars.
- Approximately 95.3% of listings show high availability (181+ days open annually), indicating potential for increased bookings or specific owner usage patterns.
- For booked days, the 91-180 days range is most frequent in ǁKhara Hais Local Municipality (34.9%), reflecting common guest stay durations or potential owner blocking patterns.
- A notable 4.7% of properties secure long booking periods (181+ days booked per year), highlighting successful long-term rental strategies or significant owner usage.
ǁKhara Hais Local Municipality Airbnb Minimum Stay Requirements Analysis
Distribution of Listings by Minimum Night Requirement
1 Night
42 listings
97.7% of total
30+ Nights
1 listings
2.3% of total
Key Insights
- The most prevalent minimum stay requirement in ǁKhara Hais Local Municipality is 1 Night, adopted by 97.7% of listings. This highlights the market's preference for shorter, flexible bookings.
- A strong majority (97.7%) of the ǁKhara Hais Local Municipality Airbnb data shows acceptance of very short stays (1-2 nights), indicating a dynamic, high-turnover market.
- Dedicated monthly rentals (30+ nights) represent a small niche (2.3%), possibly an untapped area for hosts.
Recommendations
- Align with the market by considering a 1 Night minimum stay, as 97.7% of ǁKhara Hais Local Municipality hosts use this setting.
- Adjust minimum nights based on seasonality – potentially shorter during low season and longer during peak demand periods in ǁKhara Hais Local Municipality.
ǁKhara Hais Local Municipality Airbnb Cancellation Policy Trends Analysis (2026)
Refundable
3 listings
7% of total
Limited
1 listings
2.3% of total
Non-refundable
2 listings
4.7% of total
Flexible
14 listings
32.6% of total
Moderate
9 listings
20.9% of total
Firm
8 listings
18.6% of total
Strict
6 listings
14% of total
Cancellation Policy Insights for ǁKhara Hais Local Municipality
- The prevailing Airbnb cancellation policy trend in ǁKhara Hais Local Municipality is Flexible, used by 32.6% of listings.
- There's a relatively balanced mix between guest-friendly (53.5%) and stricter (32.6%) policies, offering choices for different guest needs.
Recommendations for Hosts
- Consider adopting a Flexible policy to align with the 32.6% market standard in ǁKhara Hais Local Municipality.
- Using a Strict policy might deter some guests, as only 14% of listings use it. Evaluate if potential revenue protection outweighs possible lower booking rates.
- Regularly review your cancellation policy against competitors and market demand shifts in ǁKhara Hais Local Municipality.
ǁKhara Hais Local Municipality STR Booking Lead Time Analysis (2026)
Average Booking Lead Time by Month
Booking Lead Time Insights for ǁKhara Hais Local Municipality
- The overall average booking lead time for vacation rentals in ǁKhara Hais Local Municipality is 38 days.
- Guests book furthest in advance for stays during December (average 67 days), likely coinciding with peak travel demand or local events.
- The shortest booking windows occur for stays in February (average 11 days), indicating more last-minute travel plans during this time.
- Seasonally, Fall (43 days avg.) sees the longest lead times, while Spring (25 days avg.) has the shortest, reflecting typical travel planning cycles.
Recommendations for Hosts
- Use the overall average lead time (38 days) as a baseline for your pricing and availability strategy in ǁKhara Hais Local Municipality.
- For December stays, consider implementing length-of-stay discounts or slightly higher rates for bookings made less than 67 days out to capitalize on advance planning.
- During February, focus on last-minute booking availability and promotions, as guests book with very short notice (11 days avg.).
- Target marketing efforts for the Fall season well in advance (at least 43 days) to capture early planners.
- Monitor your own booking lead times against these ǁKhara Hais Local Municipality averages to identify opportunities for dynamic pricing adjustments.
Popular & Essential Airbnb Amenities in ǁKhara Hais Local Municipality (2026)
Amenity Prevalence
Amenity Insights for ǁKhara Hais Local Municipality
- Essential amenities in ǁKhara Hais Local Municipality that guests expect include: Air conditioning. Lacking these (this) could significantly impact bookings.
- Popular amenities like Wifi, TV, Essentials are common but not universal. Offering these can provide a competitive edge.
- Warning: Wifi is not universally provided but is considered essential globally. Ensure reliable Wifi is offered.
Recommendations for Hosts
- Ensure your listing includes all essential amenities for ǁKhara Hais Local Municipality: Air conditioning.
- Prioritize adding missing essentials: Air conditioning.
- Consider adding popular differentiators like Wifi or TV to increase appeal.
- Highlight unique or less common amenities you offer (e.g., hot tub, dedicated workspace, EV charger) in your listing description and photos.
- Regularly check competitor amenities in ǁKhara Hais Local Municipality to stay competitive.
ǁKhara Hais Local Municipality Airbnb Guest Demographics & Profile Analysis (2026)
Guest Profile Summary for ǁKhara Hais Local Municipality
- The typical guest profile for Airbnb in ǁKhara Hais Local Municipality consists of a mix of domestic (62%) and international guests, often arriving from nearby Cape Town, typically belonging to the Post-2000s (Gen Z/Alpha) group (50%), primarily speaking English or Afrikaans.
- Domestic travelers account for 61.8% of guests.
- Key international markets include South Africa (61.8%) and Namibia (13.5%).
- Top languages spoken are English (56%) followed by Afrikaans (34.7%).
- A significant demographic segment is the Post-2000s (Gen Z/Alpha) group, representing 50% of guests.
Recommendations for Hosts
- Target domestic marketing efforts towards travelers from Cape Town and Windhoek.
- Tailor amenities and listing descriptions to appeal to the dominant Post-2000s (Gen Z/Alpha) demographic (e.g., highlight fast WiFi, smart home features, local guides).
- Highlight unique local experiences or amenities relevant to the primary guest profile.
- Consider seasonal promotions aligned with peak travel times for key origin markets.
Nearby Short-Term Rental Market Comparison
How does the ǁKhara Hais Local Municipality Airbnb market stack up against its neighbors? Compare key performance metrics like average monthly revenue, ADR, and occupancy rates in surrounding areas to understand the broader regional STR landscape.
| Market | Active Properties | Monthly Revenue | Daily Rate | Avg. Occupancy |
|---|---|---|---|---|
| Kai !Garib Local Municipality | 41 | $253 | $60.31 | 19% |
| Gamagara Local Municipality | 11 | $251 | $56.57 | 22% |