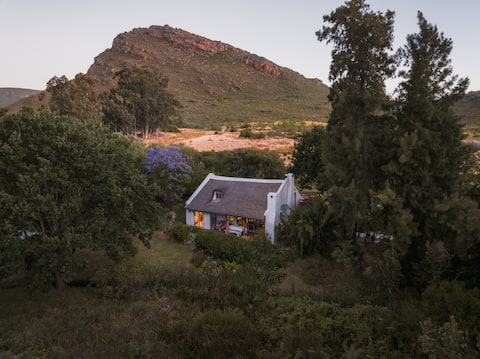
Bergrivier Local Municipality Airbnb Market Analysis 2026: Short Term Rental Data & Vacation Rental Statistics in Western Cape, South Africa
Is Airbnb profitable in Bergrivier Local Municipality in 2026? Explore comprehensive Airbnb analytics for Bergrivier Local Municipality, Western Cape, South Africa to uncover income potential. This 2026 STR market report for Bergrivier Local Municipality, based on AirROI data from February 2025 to January 2026, reveals key trends in the niche market of 130 active listings.
Whether you're considering an Airbnb investment in Bergrivier Local Municipality, optimizing your existing vacation rental, or exploring rental arbitrage opportunities, understanding the Bergrivier Local Municipality Airbnb data is crucial. Leveraging the low regulation environment is key to maximizing your short term rental income potential. Let's dive into the specifics.
Key Bergrivier Local Municipality Airbnb Performance Metrics Overview
Monthly Airbnb Revenue Variations & Income Potential in Bergrivier Local Municipality (2026)
Understanding the monthly revenue variations for Airbnb listings in Bergrivier Local Municipality is key to maximizing your short term rental income potential. Seasonality significantly impacts earnings. Our analysis, based on data from the past 12 months, shows that the peak revenue month for STRs in Bergrivier Local Municipality is typically December, while June often presents the lowest earnings, highlighting opportunities for strategic pricing adjustments during shoulder and low seasons. Explore the typical Airbnb income in Bergrivier Local Municipality across different performance tiers:
- Best-in-class properties (Top 10%) achieve $3,147+ monthly, often utilizing dynamic pricing and superior guest experiences.
- Strong performing properties (Top 25%) earn $1,661 or more, indicating effective management and desirable locations/amenities.
- Typical properties (Median) generate around $903 per month, representing the average market performance.
- Entry-level properties (Bottom 25%) see earnings around $387, often with potential for optimization.
Average Monthly Airbnb Earnings Trend in Bergrivier Local Municipality
Bergrivier Local Municipality Airbnb Occupancy Rate Trends (2026)
Maximize your bookings by understanding the Bergrivier Local Municipality STR occupancy trends. Seasonal demand shifts significantly influence how often properties are booked. Typically, Decembersees the highest demand (peak season occupancy), while June experiences the lowest (low season). Effective strategies, like adjusting minimum stays or offering promotions, can boost occupancy during slower periods. Here's how different property tiers perform in Bergrivier Local Municipality:
- Best-in-class properties (Top 10%) achieve 63%+ occupancy, indicating high desirability and potentially optimized availability.
- Strong performing properties (Top 25%) maintain 45% or higher occupancy, suggesting good market fit and guest satisfaction.
- Typical properties (Median) have an occupancy rate around 25%.
- Entry-level properties (Bottom 25%) average 13% occupancy, potentially facing higher vacancy.
Average Monthly Occupancy Rate Trend in Bergrivier Local Municipality
Average Daily Rate (ADR) Airbnb Trends in Bergrivier Local Municipality (2026)
Effective short term rental pricing strategy in Bergrivier Local Municipality involves understanding monthly ADR fluctuations. The Average Daily Rate (ADR) for Airbnb in Bergrivier Local Municipality typically peaks in December and dips lowest during June. Leveraging Airbnb dynamic pricing tools or strategies based on this seasonality can significantly boost revenue. Here's a look at the typical nightly rates achieved:
- Best-in-class properties (Top 10%) command rates of $269+ per night, often due to premium features or locations.
- Strong performing properties (Top 25%) achieve nightly rates of $178 or more.
- Typical properties (Median) charge around $98 per night.
- Entry-level properties (Bottom 25%) earn around $72 per night.
Average Daily Rate (ADR) Trend by Month in Bergrivier Local Municipality
Get Live Bergrivier Local Municipality Market Intelligence 👇

Explore Real-time Analytics
Airbnb Seasonality Analysis & Trends in Bergrivier Local Municipality (2026)
Peak Season (December, April, March)
- Revenue averages $1,814 per month
- Occupancy rates average 40.5%
- Daily rates average $138
Shoulder Season
- Revenue averages $1,251 per month
- Occupancy maintains around 28.7%
- Daily rates hold near $139
Low Season (May, June, September)
- Revenue drops to average $988 per month
- Occupancy decreases to average 24.4%
- Daily rates adjust to average $133
Seasonality Insights for Bergrivier Local Municipality
- The Airbnb seasonality in Bergrivier Local Municipality shows highly seasonal trends requiring careful strategy. While the sections above show seasonal averages, it's also insightful to look at the extremes:
- During the high season, the absolute peak month showcases Bergrivier Local Municipality's highest earning potential, with monthly revenues capable of climbing to $2,109, occupancy reaching a high of 41.9%, and ADRs peaking at $155.
- Conversely, the slowest single month of the year, typically falling within the low season, marks the market's lowest point. In this month, revenue might dip to $925, occupancy could drop to 20.5%, and ADRs may adjust down to $129.
- Understanding both the seasonal averages and these monthly peaks and troughs in revenue, occupancy, and ADR is crucial for maximizing your Airbnb profit potential in Bergrivier Local Municipality.
Seasonal Strategies for Maximizing Profit
- Peak Season: Maximize revenue through premium pricing and potentially longer minimum stays. Ensure high availability.
- Low Season: Offer competitive pricing, special promotions (e.g., extended stay discounts), and flexible cancellation policies. Target off-season travelers like remote workers or budget-conscious guests.
- Shoulder Seasons: Implement dynamic pricing that balances peak and low rates. Target weekend travelers or specific events. Offer slightly more flexible terms than peak season.
- Regularly analyze your own performance against these Bergrivier Local Municipality seasonality benchmarks and adjust your pricing and availability strategy accordingly.
Best Areas for Airbnb Investment in Bergrivier Local Municipality (2026)
Exploring the top neighborhoods for short-term rentals in Bergrivier Local Municipality? This section highlights key areas, outlining why they are attractive for hosts and guests, along with notable local attractions. Consider these locations based on your target guest profile and investment strategy.
| Neighborhood / Area | Why Host Here? (Target Guests & Appeal) | Key Attractions & Landmarks |
|---|---|---|
| Piketberg | A charming town with beautiful mountain views and a rich heritage, Piketberg is ideal for tourists seeking nature and relaxation. It's known for its access to hiking trails and local wineries. | Piketberg Mountain, Piket-Bo-Berg Nature Reserve, Wolseley Road, local wine estates, historic architecture |
| Porterville | A gateway to the Cederberg Mountains, Porterville is popular among nature lovers and is perfect for outdoor activities like hiking and birdwatching. Its small-town charm attracts a variety of visitors. | Cederberg Mountains, Porterville Nature Reserve, local hiking trails, Kromme River, charming local cafes |
| Tulbagh | Famed for its scenic valley and wine production, Tulbagh is a hidden gem with a variety of outdoor and culinary experiences, making it perfect for weekend getaways. | Tulbagh Valley, local wine estates, Nature Reserve, Tulbagh Earthquake Museum, charming historic town |
| Ceres | Known for its fruit farms and stunning landscapes, Ceres attracts nature enthusiasts and families looking for outdoor activities like fruit picking and hiking in the mountains. | Ceres Valley, local fruit farms, Matroosberg Nature Reserve, hiking trails, Ceres Railway |
| Hermon | A quiet countryside area known for its agricultural landscapes, Hermon offers a peaceful retreat for those wanting to escape the city bustle and enjoy nature. | countryside views, farms, local produce markets, outdoor markets, hiking trails |
| Wellington | Famous for its wine and brandy production, Wellington combines cultural experiences with outdoor activities, making it an attractive destination for tourists. | local wine estates, Wellington Golf Club, historical sites, nature trails, local markets |
| Riebeek Kasteel | A picturesque village in the Swartland region, Riebeek Kasteel is popular for its artistic community and stunning landscapes, making it a great destination for art and wine enthusiasts. | Riebeek Kasteel village, local art galleries, wine estates, views of the Kasteelberg, farm stalls |
| Moorreesburg | A small town known for its wheat fields and local agriculture, Moorreesburg is ideal for visitors looking for a rustic experience and a taste of rural life in the Western Cape. | agricultural landscapes, local nature walks, historic buildings, community events, farm visits |
Understanding Airbnb License Requirements & STR Laws in Bergrivier Local Municipality (2026)
While Bergrivier Local Municipality, Western Cape, South Africa currently shows low STR regulations, specific Airbnb license requirements might still exist or change. Always verify the latest short term rental regulations and Airbnb license requirements directly with local government authorities for Bergrivier Local Municipality to ensure full compliance before hosting.
(Source: AirROI data, 2026, finding no licensed listings among those analyzed)
Top Performing Airbnb Properties in Bergrivier Local Municipality (2026)
Benchmark your potential! Explore examples of top-performing Airbnb properties in Bergrivier Local Municipalitybased on Trailing Twelve Month (TTM) revenue. Analyze their characteristics, revenue, occupancy rate, and ADR to understand what drives success in this market.

Berg River Living
Entire Place • 4 bedrooms

Luxury Getaway in the Piket Bo Berg (Off-Grid)
Entire Place • 3 bedrooms
Ohana, a hidden sanctuary set in a private reserve
Entire Place • 3 bedrooms
Bella La Vita... a beautiful beachfront Villa.
Entire Place • 4 bedrooms
KORF Eco Cabin
Entire Place • 2 bedrooms
shamrock - Dwarskersbos
Entire Place • 5 bedrooms
Note: Performance varies based on location, size, amenities, seasonality, and management quality. Data reflects the past 12 months.
Top Performing Airbnb Hosts in Bergrivier Local Municipality (2026)
Learn from the best! This table showcases top-performing Airbnb hosts in Bergrivier Local Municipality based on the number of properties managed and estimated total revenue over the past year. Analyze their scale and performance metrics.
| Host Name | Properties | Grossing Revenue | Stay Reviews | Avg Rating |
|---|---|---|---|---|
| Ilane | 11 | $121,374 | 81 | 4.99/5.0 |
| Jane | 3 | $82,896 | 127 | 4.99/5.0 |
| Hope | 4 | $68,350 | 151 | 4.92/5.0 |
| Alberta Cecilia Helena | 1 | $55,944 | 11 | 5.00/5.0 |
| Anita | 1 | $55,057 | 33 | 4.91/5.0 |
| Debbie | 1 | $52,488 | 77 | 5.00/5.0 |
| Charlene | 4 | $51,448 | 83 | 4.76/5.0 |
| Jeannie | 1 | $44,505 | 61 | 4.87/5.0 |
| Yanic | 2 | $43,511 | 177 | 4.92/5.0 |
| Maret | 1 | $40,598 | 72 | 4.94/5.0 |
Analyzing the strategies of top hosts, such as their property selection, pricing, and guest communication, can offer valuable lessons for optimizing your own Airbnb operations in Bergrivier Local Municipality.
Dive Deeper: Advanced Bergrivier Local Municipality STR Market Data (2026)
Ready to unlock more insights? AirROI provides access to advanced metrics and comprehensive Airbnb data for Bergrivier Local Municipality. Explore detailed analytics beyond this report to refine your investment strategy, optimize pricing, and maximize your vacation rental profits.
Explore Advanced MetricsBergrivier Local Municipality Short-Term Rental Market Composition (2026): Property & Room Types
Room Type Distribution
Property Type Distribution
Market Composition Insights for Bergrivier Local Municipality
- The Bergrivier Local Municipality Airbnb market composition is heavily skewed towards Entire Home/Apt listings, which make up 90% of the 130 active rentals. This indicates strong guest preference for privacy and space.
- Looking at the property type distribution in Bergrivier Local Municipality, House properties are the most common (51.5%), reflecting the local real estate landscape.
- Houses represent a significant 51.5% portion, catering likely to families or larger groups.
- The presence of 6.9% Hotel/Boutique listings indicates integration with traditional hospitality.
- Smaller segments like others, unique stays (combined 3.1%) offer potential for unique stay experiences.
Bergrivier Local Municipality Airbnb Room Capacity Analysis (2026): Bedroom Distribution
Distribution of Listings by Number of Bedrooms
Room Capacity Insights for Bergrivier Local Municipality
- The dominant room capacity in Bergrivier Local Municipality is 1 bedroom listings, making up 28.5% of the market. This suggests a strong demand for properties suitable for couples or solo travelers.
- Together, 1 bedroom and 2 bedrooms properties represent 51.6% of the active Airbnb listings in Bergrivier Local Municipality, indicating a high concentration in these sizes.
- A significant 46.2% of listings offer 3+ bedrooms, catering to larger groups and families seeking more space in Bergrivier Local Municipality.
Bergrivier Local Municipality Vacation Rental Guest Capacity Trends (2026)
Distribution of Listings by Guest Capacity
Guest Capacity Insights for Bergrivier Local Municipality
- The most common guest capacity trend in Bergrivier Local Municipality vacation rentals is listings accommodating 2 guests (24.6%). This suggests the primary traveler segment is likely couples or solo travelers.
- Properties designed for 2 guests and 8+ guests dominate the Bergrivier Local Municipality STR market, accounting for 48.4% of listings.
- 46.8% of properties accommodate 6+ guests, serving the market segment for larger families or group travel in Bergrivier Local Municipality.
- On average, properties in Bergrivier Local Municipality are equipped to host 4.8 guests.
Bergrivier Local Municipality Airbnb Booking Patterns (2026): Available vs. Booked Days
Available Days Distribution
Booked Days Distribution
Booking Pattern Insights for Bergrivier Local Municipality
- The most common availability pattern in Bergrivier Local Municipality falls within the 271-366 days range, representing 70.8% of listings. This suggests many properties have significant open periods on their calendars.
- Approximately 90.8% of listings show high availability (181+ days open annually), indicating potential for increased bookings or specific owner usage patterns.
- For booked days, the 31-90 days range is most frequent in Bergrivier Local Municipality (35.4%), reflecting common guest stay durations or potential owner blocking patterns.
- A notable 10.0% of properties secure long booking periods (181+ days booked per year), highlighting successful long-term rental strategies or significant owner usage.
Bergrivier Local Municipality Airbnb Minimum Stay Requirements Analysis
Distribution of Listings by Minimum Night Requirement
1 Night
25 listings
19.2% of total
2 Nights
53 listings
40.8% of total
3 Nights
2 listings
1.5% of total
7-29 Nights
1 listings
0.8% of total
30+ Nights
49 listings
37.7% of total
Key Insights
- The most prevalent minimum stay requirement in Bergrivier Local Municipality is 2 Nights, adopted by 40.8% of listings. This highlights the market's preference for shorter, flexible bookings.
- A significant segment (37.7%) caters to monthly stays (30+ nights) in Bergrivier Local Municipality, pointing to opportunities in the extended-stay market.
Recommendations
- Align with the market by considering a 2 Nights minimum stay, as 40.8% of Bergrivier Local Municipality hosts use this setting.
- If feasible, allowing 1-night stays, especially midweek or during low season, could capture last-minute bookings, as only 19.2% currently do.
- A 2-night minimum appears standard (40.8%). Consider this for weekends or peak periods.
- Explore offering discounts for stays of 30+ nights to attract the 37.7% of the market seeking extended stays.
- Adjust minimum nights based on seasonality – potentially shorter during low season and longer during peak demand periods in Bergrivier Local Municipality.
Bergrivier Local Municipality Airbnb Cancellation Policy Trends Analysis (2026)
Refundable
7 listings
5.4% of total
Limited
4 listings
3.1% of total
Non-refundable
6 listings
4.7% of total
Flexible
24 listings
18.6% of total
Moderate
29 listings
22.5% of total
Firm
50 listings
38.8% of total
Strict
9 listings
7% of total
Cancellation Policy Insights for Bergrivier Local Municipality
- The prevailing Airbnb cancellation policy trend in Bergrivier Local Municipality is Firm, used by 38.8% of listings.
- There's a relatively balanced mix between guest-friendly (41.1%) and stricter (45.8%) policies, offering choices for different guest needs.
- Strict cancellation policies are quite rare (7%), potentially making listings with this policy less competitive unless justified by high demand or property type.
Recommendations for Hosts
- Consider adopting a Firm policy to align with the 38.8% market standard in Bergrivier Local Municipality.
- Using a Strict policy might deter some guests, as only 7% of listings use it. Evaluate if potential revenue protection outweighs possible lower booking rates.
- Regularly review your cancellation policy against competitors and market demand shifts in Bergrivier Local Municipality.
Bergrivier Local Municipality STR Booking Lead Time Analysis (2026)
Average Booking Lead Time by Month
Booking Lead Time Insights for Bergrivier Local Municipality
- The overall average booking lead time for vacation rentals in Bergrivier Local Municipality is 54 days.
- Guests book furthest in advance for stays during December (average 109 days), likely coinciding with peak travel demand or local events.
- The shortest booking windows occur for stays in June (average 24 days), indicating more last-minute travel plans during this time.
- Seasonally, Winter (69 days avg.) sees the longest lead times, while Summer (36 days avg.) has the shortest, reflecting typical travel planning cycles.
Recommendations for Hosts
- Use the overall average lead time (54 days) as a baseline for your pricing and availability strategy in Bergrivier Local Municipality.
- For December stays, consider implementing length-of-stay discounts or slightly higher rates for bookings made less than 109 days out to capitalize on advance planning.
- Target marketing efforts for the Winter season well in advance (at least 69 days) to capture early planners.
- Monitor your own booking lead times against these Bergrivier Local Municipality averages to identify opportunities for dynamic pricing adjustments.
Popular & Essential Airbnb Amenities in Bergrivier Local Municipality (2026)
Amenity Prevalence
Amenity Insights for Bergrivier Local Municipality
- Popular amenities like Kitchen, Free parking on premises, BBQ grill are common but not universal. Offering these can provide a competitive edge.
- Warning: Wifi is not universally provided but is considered essential globally. Ensure reliable Wifi is offered.
Recommendations for Hosts
- Consider adding popular differentiators like Kitchen or Free parking on premises to increase appeal.
- Highlight unique or less common amenities you offer (e.g., hot tub, dedicated workspace, EV charger) in your listing description and photos.
- Regularly check competitor amenities in Bergrivier Local Municipality to stay competitive.
Bergrivier Local Municipality Airbnb Guest Demographics & Profile Analysis (2026)
Guest Profile Summary for Bergrivier Local Municipality
- The typical guest profile for Airbnb in Bergrivier Local Municipality consists of primarily domestic travelers (79%), often arriving from nearby Cape Town, typically belonging to the Post-2000s (Gen Z/Alpha) group (50%), primarily speaking English or Afrikaans.
- Domestic travelers account for 79.2% of guests.
- Key international markets include South Africa (79.2%) and United Kingdom (5%).
- Top languages spoken are English (58.1%) followed by Afrikaans (23.2%).
- A significant demographic segment is the Post-2000s (Gen Z/Alpha) group, representing 50% of guests.
Recommendations for Hosts
- Target domestic marketing efforts towards travelers from Cape Town and Western Cape.
- Tailor amenities and listing descriptions to appeal to the dominant Post-2000s (Gen Z/Alpha) demographic (e.g., highlight fast WiFi, smart home features, local guides).
- Highlight unique local experiences or amenities relevant to the primary guest profile.
- Consider seasonal promotions aligned with peak travel times for key origin markets.
Nearby Short-Term Rental Market Comparison
How does the Bergrivier Local Municipality Airbnb market stack up against its neighbors? Compare key performance metrics like average monthly revenue, ADR, and occupancy rates in surrounding areas to understand the broader regional STR landscape.
| Market | Active Properties | Monthly Revenue | Daily Rate | Avg. Occupancy |
|---|---|---|---|---|
| Stellenbosch Local Municipality | 1,297 | $1,821 | $186.76 | 43% |
| Cape Town | 13,044 | $1,682 | $181.11 | 44% |
| Witzenberg Local Municipality | 257 | $1,349 | $133.58 | 35% |
| Robertson | 12 | $1,101 | $105.42 | 43% |
| Drakenstein Local Municipality | 435 | $1,087 | $150.07 | 33% |
| Swartland Local Municipality | 386 | $1,084 | $164.90 | 27% |
| Saldanha Bay Local Municipality | 1,184 | $1,050 | $148.05 | 29% |
| Stellenbosch | 48 | $1,040 | $130.97 | 39% |
| Langeberg Local Municipality | 444 | $954 | $118.54 | 31% |
| Melkbosstrand | 80 | $928 | $156.82 | 34% |