Galera Airbnb Market Analysis 2026: Short Term Rental Data & Vacation Rental Statistics in Andalusia, Spain
Is Airbnb profitable in Galera in 2026? Explore comprehensive Airbnb analytics for Galera, Andalusia, Spain to uncover income potential. This 2026 STR market report for Galera, based on AirROI data from February 2025 to January 2026, reveals key trends in the niche market of 18 active listings.
Whether you're considering an Airbnb investment in Galera, optimizing your existing vacation rental, or exploring rental arbitrage opportunities, understanding the Galera Airbnb data is crucial. Navigating the high regulation landscape is key to maximizing your short term rental income potential. Let's dive into the specifics.
Key Galera Airbnb Performance Metrics Overview
Monthly Airbnb Revenue Variations & Income Potential in Galera (2026)
Understanding the monthly revenue variations for Airbnb listings in Galera is key to maximizing your short term rental income potential. Seasonality significantly impacts earnings. Our analysis, based on data from the past 12 months, shows that the peak revenue month for STRs in Galera is typically August, while March often presents the lowest earnings, highlighting opportunities for strategic pricing adjustments during shoulder and low seasons. Explore the typical Airbnb income in Galera across different performance tiers:
- Best-in-class properties (Top 10%) achieve $3,220+ monthly, often utilizing dynamic pricing and superior guest experiences.
- Strong performing properties (Top 25%) earn $1,162 or more, indicating effective management and desirable locations/amenities.
- Typical properties (Median) generate around $576 per month, representing the average market performance.
- Entry-level properties (Bottom 25%) see earnings around $347, often with potential for optimization.
Average Monthly Airbnb Earnings Trend in Galera
Galera Airbnb Occupancy Rate Trends (2026)
Maximize your bookings by understanding the Galera STR occupancy trends. Seasonal demand shifts significantly influence how often properties are booked. Typically, Augustsees the highest demand (peak season occupancy), while June experiences the lowest (low season). Effective strategies, like adjusting minimum stays or offering promotions, can boost occupancy during slower periods. Here's how different property tiers perform in Galera:
- Best-in-class properties (Top 10%) achieve 53%+ occupancy, indicating high desirability and potentially optimized availability.
- Strong performing properties (Top 25%) maintain 28% or higher occupancy, suggesting good market fit and guest satisfaction.
- Typical properties (Median) have an occupancy rate around 17%.
- Entry-level properties (Bottom 25%) average 10% occupancy, potentially facing higher vacancy.
Average Monthly Occupancy Rate Trend in Galera
Average Daily Rate (ADR) Airbnb Trends in Galera (2026)
Effective short term rental pricing strategy in Galera involves understanding monthly ADR fluctuations. The Average Daily Rate (ADR) for Airbnb in Galera typically peaks in January and dips lowest during March. Leveraging Airbnb dynamic pricing tools or strategies based on this seasonality can significantly boost revenue. Here's a look at the typical nightly rates achieved:
- Best-in-class properties (Top 10%) command rates of $452+ per night, often due to premium features or locations.
- Strong performing properties (Top 25%) achieve nightly rates of $193 or more.
- Typical properties (Median) charge around $109 per night.
- Entry-level properties (Bottom 25%) earn around $81 per night.
Average Daily Rate (ADR) Trend by Month in Galera
Get Live Galera Market Intelligence 👇

Explore Real-time Analytics
Airbnb Seasonality Analysis & Trends in Galera (2026)
Peak Season (August, July, December)
- Revenue averages $2,545 per month
- Occupancy rates average 31.2%
- Daily rates average $220
Shoulder Season
- Revenue averages $1,302 per month
- Occupancy maintains around 19.0%
- Daily rates hold near $215
Low Season (January, February, March)
- Revenue drops to average $563 per month
- Occupancy decreases to average 20.2%
- Daily rates adjust to average $228
Seasonality Insights for Galera
- The Airbnb seasonality in Galera shows highly seasonal trends requiring careful strategy. While the sections above show seasonal averages, it's also insightful to look at the extremes:
- During the high season, the absolute peak month showcases Galera's highest earning potential, with monthly revenues capable of climbing to $3,088, occupancy reaching a high of 36.8%, and ADRs peaking at $272.
- Conversely, the slowest single month of the year, typically falling within the low season, marks the market's lowest point. In this month, revenue might dip to $454, occupancy could drop to 10.7%, and ADRs may adjust down to $204.
- Understanding both the seasonal averages and these monthly peaks and troughs in revenue, occupancy, and ADR is crucial for maximizing your Airbnb profit potential in Galera.
Seasonal Strategies for Maximizing Profit
- Peak Season: Maximize revenue through premium pricing and potentially longer minimum stays. Ensure high availability.
- Low Season: Offer competitive pricing, special promotions (e.g., extended stay discounts), and flexible cancellation policies. Target off-season travelers like remote workers or budget-conscious guests.
- Shoulder Seasons: Implement dynamic pricing that balances peak and low rates. Target weekend travelers or specific events. Offer slightly more flexible terms than peak season.
- Regularly analyze your own performance against these Galera seasonality benchmarks and adjust your pricing and availability strategy accordingly.
Best Areas for Airbnb Investment in Galera (2026)
Exploring the top neighborhoods for short-term rentals in Galera? This section highlights key areas, outlining why they are attractive for hosts and guests, along with notable local attractions. Consider these locations based on your target guest profile and investment strategy.
| Neighborhood / Area | Why Host Here? (Target Guests & Appeal) | Key Attractions & Landmarks |
|---|---|---|
| Playa de La Herradura | Popular beach destination known for its beautiful coastline and clear waters. Ideal for tourists looking for a relaxing beach vacation with water sports opportunities. | La Herradura Beach, Acantilados de Maro-Cerro Gordo Natural Area, Water sports activities, Snorkeling and scuba diving, Charming seafront restaurants |
| Almuñécar | Traditional Spanish town with a rich history and beautiful beaches. Great for families and couples seeking a cultural experience along with beach relaxation. | San Miguel Castle, Aquarium of Almuñécar, Tropical gardens, Beaches of La Caletilla and Playa San Cristobal, Local tapas bars |
| Nerja | Famous for its stunning Nerja Caves and beautiful Mediterranean beaches. A perfect spot for both adventure and relaxation with a picturesque town atmosphere. | Nerja Caves, Balcon de Europa, Beaches of Burriana and Calahonda, Aqueduct of El Águila, Charming narrow streets |
| Salobreña | A charming coastal town with a historic castle and picturesque old town. Attracts visitors looking for a quiet retreat with scenic views. | Salobreña Castle, Beaches of Salobreña, Old Town with whitewashed houses, Lemon and avocado groves, Scenic coastal views |
| Motril | Larger town with a wide range of amenities and beaches. Suitable for visitors wanting a more urban experience while still close to the coast. | Motril Beaches, Sugar Cane Museum, Historical sites, Local markets and shops, Promenade |
| Cájar | A small village near Granada, ideal for those wishing to explore both the mountains and nearby attractions such as the Alhambra. Perfect for nature and culture lovers. | Scenic views of the Sierra Nevada, Access to hiking trails, Proximity to Granada, Local festivals, Traditional Andalusian architecture |
| Orgiva | Gateway to the Alpujarras mountains with a bohemian vibe. Popular with those looking for an alternative lifestyle and outdoor adventures. | Trekking in the Alpujarras, Scenic mountain views, Artisanal markets, Natural hot springs, Vibrant local community |
| Frigiliana | A beautiful white-washed village known for its narrow winding streets and stunning vistas. It attracts tourists who enjoy its charm and history. | Historic center, Frigiliana Botanical Garden, Views of the Mediterranean, Local festivals, Traditional restaurants |
Understanding Airbnb License Requirements & STR Laws in Galera (2026)
Yes, Galera, Andalusia, Spain enforces high STR regulations. Obtaining a license and ensuring compliance is almost certainly required according to current 2026 STR laws. Always verify the latest short term rental regulations and Airbnb license requirements directly with local government authorities for Galera to ensure full compliance before hosting.
(Source: AirROI data, 2026, based on 94% licensed listings)
Top Performing Airbnb Properties in Galera (2026)
Benchmark your potential! Explore examples of top-performing Airbnb properties in Galerabased on Trailing Twelve Month (TTM) revenue. Analyze their characteristics, revenue, occupancy rate, and ADR to understand what drives success in this market.
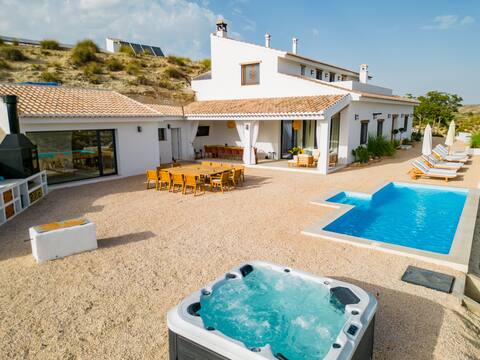
Casa Lua, luxury villa with spa
Entire Place • 10 bedrooms

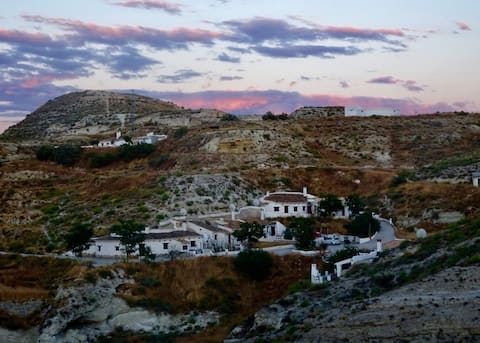
Cavehouse - Galera, Granada, Spain
Entire Place • 2 bedrooms
Cueva Encantada
Entire Place • 1 bedroom

Astarté Galera House
Entire Place • 8 bedrooms

Los Pesebres Cave House
Entire Place • 1 bedroom
Astarté Galera up house
Entire Place • 4 bedrooms
Note: Performance varies based on location, size, amenities, seasonality, and management quality. Data reflects the past 12 months.
Top Performing Airbnb Hosts in Galera (2026)
Learn from the best! This table showcases top-performing Airbnb hosts in Galera based on the number of properties managed and estimated total revenue over the past year. Analyze their scale and performance metrics.
| Host Name | Properties | Grossing Revenue | Stay Reviews | Avg Rating |
|---|---|---|---|---|
| Christel | 1 | $100,737 | 2 | Not Rated |
| Rosa María | 6 | $25,121 | 77 | 4.65/5.0 |
| Pieter And Veronica Sanford | 1 | $23,294 | 78 | 5.00/5.0 |
| David | 2 | $14,471 | 12 | 5.00/5.0 |
| Samuel | 1 | $12,804 | 67 | 4.90/5.0 |
| Cuevas Victoria | 1 | $6,419 | 3 | 5.00/5.0 |
| Karen | 1 | $6,265 | 83 | 4.89/5.0 |
| Novasol | 1 | $5,103 | 1 | Not Rated |
| Eufemio | 2 | $4,177 | 3 | Not Rated |
| Graham | 1 | $2,823 | 8 | 4.88/5.0 |
Analyzing the strategies of top hosts, such as their property selection, pricing, and guest communication, can offer valuable lessons for optimizing your own Airbnb operations in Galera.
Dive Deeper: Advanced Galera STR Market Data (2026)
Ready to unlock more insights? AirROI provides access to advanced metrics and comprehensive Airbnb data for Galera. Explore detailed analytics beyond this report to refine your investment strategy, optimize pricing, and maximize your vacation rental profits.
Explore Advanced MetricsGalera Short-Term Rental Market Composition (2026): Property & Room Types
Room Type Distribution
Property Type Distribution
Market Composition Insights for Galera
- The Galera Airbnb market composition is heavily skewed towards Entire Home/Apt listings, which make up 100% of the 18 active rentals. This indicates strong guest preference for privacy and space.
- Looking at the property type distribution in Galera, Unique Stays properties are the most common (55.6%), reflecting the local real estate landscape.
- Houses represent a significant 33.3% portion, catering likely to families or larger groups.
Galera Airbnb Room Capacity Analysis (2026): Bedroom Distribution
Distribution of Listings by Number of Bedrooms
Room Capacity Insights for Galera
- The dominant room capacity in Galera is 1 bedroom listings, making up 61.1% of the market. This suggests a strong demand for properties suitable for couples or solo travelers.
- Together, 1 bedroom and 5+ bedrooms properties represent 77.8% of the active Airbnb listings in Galera, indicating a high concentration in these sizes.
- With over half the market (61.1%) consisting of studios or 1-bedroom units, Galera is particularly well-suited for individuals or couples.
- A significant 22.3% of listings offer 3+ bedrooms, catering to larger groups and families seeking more space in Galera.
Galera Vacation Rental Guest Capacity Trends (2026)
Distribution of Listings by Guest Capacity
Guest Capacity Insights for Galera
- The most common guest capacity trend in Galera vacation rentals is listings accommodating 8+ guests (33.3%). This suggests the primary traveler segment is likely larger groups.
- Properties designed for 8+ guests and 4 guests dominate the Galera STR market, accounting for 61.1% of listings.
- 33.3% of properties accommodate 6+ guests, serving the market segment for larger families or group travel in Galera.
- On average, properties in Galera are equipped to host 4.9 guests.
Galera Airbnb Booking Patterns (2026): Available vs. Booked Days
Available Days Distribution
Booked Days Distribution
Booking Pattern Insights for Galera
- The most common availability pattern in Galera falls within the 271-366 days range, representing 88.9% of listings. This suggests many properties have significant open periods on their calendars.
- Approximately 88.9% of listings show high availability (181+ days open annually), indicating potential for increased bookings or specific owner usage patterns.
- For booked days, the 31-90 days range is most frequent in Galera (44.4%), reflecting common guest stay durations or potential owner blocking patterns.
- A notable 11.1% of properties secure long booking periods (181+ days booked per year), highlighting successful long-term rental strategies or significant owner usage.
Galera Airbnb Minimum Stay Requirements Analysis
Distribution of Listings by Minimum Night Requirement
2 Nights
7 listings
38.9% of total
3 Nights
1 listings
5.6% of total
30+ Nights
10 listings
55.6% of total
Key Insights
- The most prevalent minimum stay requirement in Galera is 30+ Nights, adopted by 55.6% of listings. This highlights the market's preference for longer commitments.
- A significant segment (55.6%) caters to monthly stays (30+ nights) in Galera, pointing to opportunities in the extended-stay market.
Recommendations
- Align with the market by considering a 30+ Nights minimum stay, as 55.6% of Galera hosts use this setting.
- A 2-night minimum appears standard (38.9%). Consider this for weekends or peak periods.
- Explore offering discounts for stays of 30+ nights to attract the 55.6% of the market seeking extended stays.
- Adjust minimum nights based on seasonality – potentially shorter during low season and longer during peak demand periods in Galera.
Galera Airbnb Cancellation Policy Trends Analysis (2026)
Super Strict 60 Days
1 listings
5.6% of total
Flexible
3 listings
16.7% of total
Moderate
9 listings
50% of total
Firm
3 listings
16.7% of total
Strict
2 listings
11.1% of total
Cancellation Policy Insights for Galera
- The prevailing Airbnb cancellation policy trend in Galera is Moderate, used by 50% of listings.
- There's a relatively balanced mix between guest-friendly (66.7%) and stricter (27.8%) policies, offering choices for different guest needs.
Recommendations for Hosts
- Consider adopting a Moderate policy to align with the 50% market standard in Galera.
- Using a Strict policy might deter some guests, as only 11.1% of listings use it. Evaluate if potential revenue protection outweighs possible lower booking rates.
- Regularly review your cancellation policy against competitors and market demand shifts in Galera.
Galera STR Booking Lead Time Analysis (2026)
Average Booking Lead Time by Month
Booking Lead Time Insights for Galera
- The overall average booking lead time for vacation rentals in Galera is 68 days.
- Guests book furthest in advance for stays during June (average 104 days), likely coinciding with peak travel demand or local events.
- The shortest booking windows occur for stays in March (average 21 days), indicating more last-minute travel plans during this time.
- Seasonally, Summer (85 days avg.) sees the longest lead times, while Spring (44 days avg.) has the shortest, reflecting typical travel planning cycles.
Recommendations for Hosts
- Use the overall average lead time (68 days) as a baseline for your pricing and availability strategy in Galera.
- For June stays, consider implementing length-of-stay discounts or slightly higher rates for bookings made less than 104 days out to capitalize on advance planning.
- Target marketing efforts for the Summer season well in advance (at least 85 days) to capture early planners.
- Monitor your own booking lead times against these Galera averages to identify opportunities for dynamic pricing adjustments.
Popular & Essential Airbnb Amenities in Galera (2026)
Amenity Prevalence
Amenity Insights for Galera
- Essential amenities in Galera that guests expect include: TV, Kitchen. Lacking these (any) could significantly impact bookings.
- Popular amenities like Fire extinguisher, Indoor fireplace, Refrigerator are common but not universal. Offering these can provide a competitive edge.
Recommendations for Hosts
- Ensure your listing includes all essential amenities for Galera: TV, Kitchen.
- Consider adding popular differentiators like Fire extinguisher or Indoor fireplace to increase appeal.
- Highlight unique or less common amenities you offer (e.g., hot tub, dedicated workspace, EV charger) in your listing description and photos.
- Regularly check competitor amenities in Galera to stay competitive.
Galera Airbnb Guest Demographics & Profile Analysis (2026)
Guest Profile Summary for Galera
- The typical guest profile for Airbnb in Galera consists of a mix of domestic (53%) and international guests, often arriving from nearby Alicante, typically belonging to the Post-2000s (Gen Z/Alpha) group (50%), primarily speaking English or Spanish.
- Domestic travelers account for 53.1% of guests.
- Key international markets include Spain (53.1%) and United Kingdom (28.1%).
- Top languages spoken are English (33.3%) followed by Spanish (30%).
- A significant demographic segment is the Post-2000s (Gen Z/Alpha) group, representing 50% of guests.
Recommendations for Hosts
- Balance marketing efforts between domestic and international channels based on the guest mix.
- Tailor amenities and listing descriptions to appeal to the dominant Post-2000s (Gen Z/Alpha) demographic (e.g., highlight fast WiFi, smart home features, local guides).
- Highlight unique local experiences or amenities relevant to the primary guest profile.
- Consider seasonal promotions aligned with peak travel times for key origin markets.
Nearby Short-Term Rental Market Comparison
How does the Galera Airbnb market stack up against its neighbors? Compare key performance metrics like average monthly revenue, ADR, and occupancy rates in surrounding areas to understand the broader regional STR landscape.
| Market | Active Properties | Monthly Revenue | Daily Rate | Avg. Occupancy |
|---|---|---|---|---|
| Gójar | 14 | $2,483 | $231.10 | 33% |
| Villa de Otura | 20 | $2,168 | $319.86 | 36% |
| Frigiliana | 394 | $2,037 | $224.15 | 46% |
| Árchez | 18 | $1,887 | $254.70 | 36% |
| Albuñuelas | 14 | $1,853 | $186.37 | 36% |
| Torrox Costa | 10 | $1,785 | $220.19 | 48% |
| La Zubia | 50 | $1,782 | $204.26 | 37% |
| Salobreña | 279 | $1,750 | $246.45 | 37% |
| Nerja | 2,012 | $1,715 | $193.57 | 45% |
| El Valle | 31 | $1,683 | $208.10 | 37% |