Guillena Airbnb Market Analysis 2026: Short Term Rental Data & Vacation Rental Statistics in Andalusia, Spain
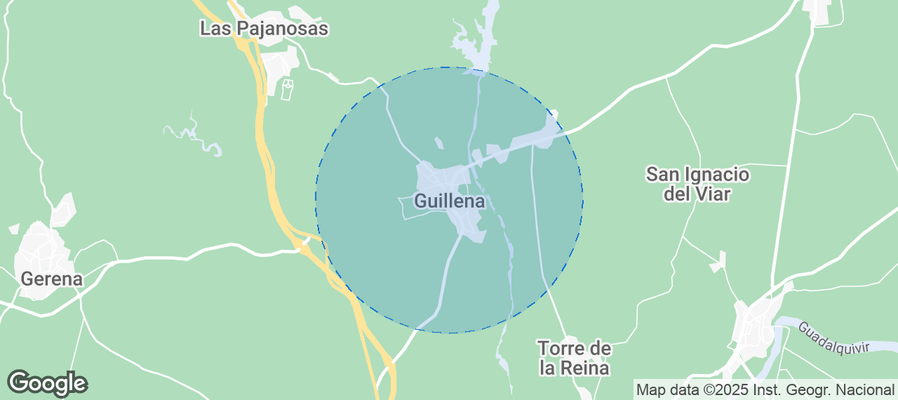
Is Airbnb profitable in Guillena in 2026? Explore comprehensive Airbnb analytics for Guillena, Andalusia, Spain to uncover income potential. This 2026 STR market report for Guillena, based on AirROI data from February 2025 to January 2026, reveals key trends in the niche market of 35 active listings.
Whether you're considering an Airbnb investment in Guillena, optimizing your existing vacation rental, or exploring rental arbitrage opportunities, understanding the Guillena Airbnb data is crucial. Navigating the high regulation landscape is key to maximizing your short term rental income potential. Let's dive into the specifics.
Key Guillena Airbnb Performance Metrics Overview
Monthly Airbnb Revenue Variations & Income Potential in Guillena (2026)
Understanding the monthly revenue variations for Airbnb listings in Guillena is key to maximizing your short term rental income potential. Seasonality significantly impacts earnings. Our analysis, based on data from the past 12 months, shows that the peak revenue month for STRs in Guillena is typically August, while January often presents the lowest earnings, highlighting opportunities for strategic pricing adjustments during shoulder and low seasons. Explore the typical Airbnb income in Guillena across different performance tiers:
- Best-in-class properties (Top 10%) achieve $6,033+ monthly, often utilizing dynamic pricing and superior guest experiences.
- Strong performing properties (Top 25%) earn $4,395 or more, indicating effective management and desirable locations/amenities.
- Typical properties (Median) generate around $2,439 per month, representing the average market performance.
- Entry-level properties (Bottom 25%) see earnings around $1,351, often with potential for optimization.
Average Monthly Airbnb Earnings Trend in Guillena
Guillena Airbnb Occupancy Rate Trends (2026)
Maximize your bookings by understanding the Guillena STR occupancy trends. Seasonal demand shifts significantly influence how often properties are booked. Typically, Augustsees the highest demand (peak season occupancy), while January experiences the lowest (low season). Effective strategies, like adjusting minimum stays or offering promotions, can boost occupancy during slower periods. Here's how different property tiers perform in Guillena:
- Best-in-class properties (Top 10%) achieve 71%+ occupancy, indicating high desirability and potentially optimized availability.
- Strong performing properties (Top 25%) maintain 55% or higher occupancy, suggesting good market fit and guest satisfaction.
- Typical properties (Median) have an occupancy rate around 37%.
- Entry-level properties (Bottom 25%) average 21% occupancy, potentially facing higher vacancy.
Average Monthly Occupancy Rate Trend in Guillena
Average Daily Rate (ADR) Airbnb Trends in Guillena (2026)
Effective short term rental pricing strategy in Guillena involves understanding monthly ADR fluctuations. The Average Daily Rate (ADR) for Airbnb in Guillena typically peaks in July and dips lowest during October. Leveraging Airbnb dynamic pricing tools or strategies based on this seasonality can significantly boost revenue. Here's a look at the typical nightly rates achieved:
- Best-in-class properties (Top 10%) command rates of $404+ per night, often due to premium features or locations.
- Strong performing properties (Top 25%) achieve nightly rates of $314 or more.
- Typical properties (Median) charge around $219 per night.
- Entry-level properties (Bottom 25%) earn around $164 per night.
Average Daily Rate (ADR) Trend by Month in Guillena
Get Live Guillena Market Intelligence 👇
Explore Real-time Analytics
Airbnb Seasonality Analysis & Trends in Guillena (2026)
Peak Season (August, July, April)
- Revenue averages $4,811 per month
- Occupancy rates average 56.4%
- Daily rates average $300
Shoulder Season
- Revenue averages $2,997 per month
- Occupancy maintains around 38.8%
- Daily rates hold near $263
Low Season (January, February, November)
- Revenue drops to average $1,597 per month
- Occupancy decreases to average 22.9%
- Daily rates adjust to average $246
Seasonality Insights for Guillena
- The Airbnb seasonality in Guillena shows highly seasonal trends requiring careful strategy. While the sections above show seasonal averages, it's also insightful to look at the extremes:
- During the high season, the absolute peak month showcases Guillena's highest earning potential, with monthly revenues capable of climbing to $5,572, occupancy reaching a high of 63.4%, and ADRs peaking at $310.
- Conversely, the slowest single month of the year, typically falling within the low season, marks the market's lowest point. In this month, revenue might dip to $1,399, occupancy could drop to 17.7%, and ADRs may adjust down to $224.
- Understanding both the seasonal averages and these monthly peaks and troughs in revenue, occupancy, and ADR is crucial for maximizing your Airbnb profit potential in Guillena.
Seasonal Strategies for Maximizing Profit
- Peak Season: Maximize revenue through premium pricing and potentially longer minimum stays. Ensure high availability.
- Low Season: Offer competitive pricing, special promotions (e.g., extended stay discounts), and flexible cancellation policies. Target off-season travelers like remote workers or budget-conscious guests.
- Shoulder Seasons: Implement dynamic pricing that balances peak and low rates. Target weekend travelers or specific events. Offer slightly more flexible terms than peak season.
- Regularly analyze your own performance against these Guillena seasonality benchmarks and adjust your pricing and availability strategy accordingly.
Best Areas for Airbnb Investment in Guillena (2026)
Exploring the top neighborhoods for short-term rentals in Guillena? This section highlights key areas, outlining why they are attractive for hosts and guests, along with notable local attractions. Consider these locations based on your target guest profile and investment strategy.
| Neighborhood / Area | Why Host Here? (Target Guests & Appeal) | Key Attractions & Landmarks |
|---|---|---|
| Guillena Town Center | Central area ideal for tourists and locals alike, close to shops, restaurants, and cultural sites. Perfect for short stays as it gives a balance of local life and tourist attractions. | Parish Church of San Juan Bautista, Guillena Municipal Market, Local tapas bars, Guillena's Plaza de España, Nearby parks |
| Las Pajanosas | A charming village atmosphere with natural surroundings. Popular for those looking to escape the city and enjoy the tranquility and outdoor activities. | Guadalquivir River, Natural parks, Hiking trails, Local festivals, Traditional Spanish cuisine |
| Cortijo del Cuarto | A picturesque area designed for rural tourism, attracting visitors interested in wine, agriculture, and rural experiences away from urban life. | Local wineries, Olive groves, Traditional farmhouses, Guided tours, Culinary experiences |
| El Castillo | Rich in history and architecture, this area offers guests a unique glimpse into the past with its ancient structures and beautiful surroundings. | Guillena Castle, Historic ruins, Scenic viewpoints, Cultural events, Artisan markets |
| Las Cabezas de San Juan | Close to nature reserves, popular with eco-tourists and those looking to enjoy bird watching and outdoor sports. | Doñana National Park, Natural wildlife reserves, Bird watching, Fishing spots, River activities |
| Alameda de Sevilla | A vibrant social hub near Guillena. Known for its nightlife and local events, attracting younger guests looking for an energetic atmosphere. | Tapas bars, Live music venues, Cultural festivals, Street art, Shopping areas |
| Brenes | Nearby town with a blend of modernity and tradition, offering both industrial developments and historical sites, appealing to diverse guests. | Historical buildings, Local artisan shops, Parks and recreational areas, Community events, Traditional homes |
| Camas | A traditional town that offers a mix of historical significance with modern amenities, popular among families and cultural enthusiasts. | Iglesia de Santa María, Local museums, Traditional markets, Parks, Community festivals |
Understanding Airbnb License Requirements & STR Laws in Guillena (2026)
Yes, Guillena, Andalusia, Spain enforces high STR regulations. Obtaining a license and ensuring compliance is almost certainly required according to current 2026 STR laws. Always verify the latest short term rental regulations and Airbnb license requirements directly with local government authorities for Guillena to ensure full compliance before hosting.
(Source: AirROI data, 2026, based on 94% licensed listings)
Top Performing Airbnb Properties in Guillena (2026)
Benchmark your potential! Explore examples of top-performing Airbnb properties in Guillenabased on Trailing Twelve Month (TTM) revenue. Analyze their characteristics, revenue, occupancy rate, and ADR to understand what drives success in this market.
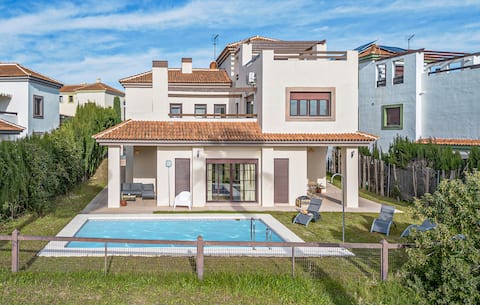
Nice home in Guillena with WiFi
Entire Place • 4 bedrooms
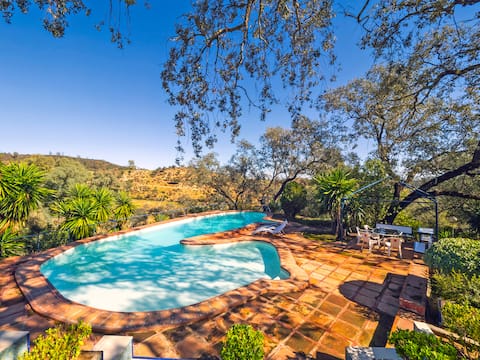
Cubo's Quinta de los Cisnes & mini-golf included
Entire Place • 5 bedrooms

Villa SenseSevilla/pool/nature/Golf 6 minutes away
Entire Place • 4 bedrooms

Best of Both Worlds
Entire Place • 5 bedrooms

100% Independent Chalet. Heated pool
Entire Place • 4 bedrooms
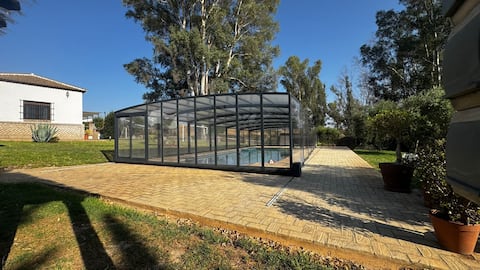
Spectacular Andalusian-style villa on a large estate
Entire Place • 5 bedrooms
Note: Performance varies based on location, size, amenities, seasonality, and management quality. Data reflects the past 12 months.
Top Performing Airbnb Hosts in Guillena (2026)
Learn from the best! This table showcases top-performing Airbnb hosts in Guillena based on the number of properties managed and estimated total revenue over the past year. Analyze their scale and performance metrics.
| Host Name | Properties | Grossing Revenue | Stay Reviews | Avg Rating |
|---|---|---|---|---|
| Jose Luis | 5 | $201,929 | 247 | 4.89/5.0 |
| Maria José | 7 | $123,555 | 22 | 4.78/5.0 |
| Novasol | 1 | $95,644 | 8 | 4.63/5.0 |
| Stephanie | 3 | $90,019 | 115 | 4.80/5.0 |
| Cubos Holiday Homes | 1 | $81,426 | 14 | 4.93/5.0 |
| Carol | 1 | $80,693 | 94 | 4.93/5.0 |
| Debra | 1 | $61,608 | 43 | 4.79/5.0 |
| Esther | 1 | $40,515 | 32 | 4.81/5.0 |
| Novasol | 1 | $35,143 | 2 | Not Rated |
| Angel | 1 | $28,138 | 86 | 4.87/5.0 |
Analyzing the strategies of top hosts, such as their property selection, pricing, and guest communication, can offer valuable lessons for optimizing your own Airbnb operations in Guillena.
Dive Deeper: Advanced Guillena STR Market Data (2026)
Ready to unlock more insights? AirROI provides access to advanced metrics and comprehensive Airbnb data for Guillena. Explore detailed analytics beyond this report to refine your investment strategy, optimize pricing, and maximize your vacation rental profits.
Explore Advanced MetricsGuillena Short-Term Rental Market Composition (2026): Property & Room Types
Room Type Distribution
Property Type Distribution
Market Composition Insights for Guillena
- The Guillena Airbnb market composition is heavily skewed towards Entire Home/Apt listings, which make up 74.3% of the 35 active rentals. This indicates strong guest preference for privacy and space.
- Looking at the property type distribution in Guillena, House properties are the most common (77.1%), reflecting the local real estate landscape.
- Houses represent a significant 77.1% portion, catering likely to families or larger groups.
- The presence of 22.9% Hotel/Boutique listings indicates integration with traditional hospitality.
Guillena Airbnb Room Capacity Analysis (2026): Bedroom Distribution
Distribution of Listings by Number of Bedrooms
Room Capacity Insights for Guillena
- The dominant room capacity in Guillena is 4 bedrooms listings, making up 28.6% of the market. This suggests a strong demand for properties suitable for families or small groups.
- Together, 4 bedrooms and 1 bedroom properties represent 51.5% of the active Airbnb listings in Guillena, indicating a high concentration in these sizes.
- A significant 65.7% of listings offer 3+ bedrooms, catering to larger groups and families seeking more space in Guillena.
Guillena Vacation Rental Guest Capacity Trends (2026)
Distribution of Listings by Guest Capacity
Guest Capacity Insights for Guillena
- The most common guest capacity trend in Guillena vacation rentals is listings accommodating 8+ guests (54.3%). This suggests the primary traveler segment is likely larger groups.
- Properties designed for 8+ guests and 4 guests dominate the Guillena STR market, accounting for 68.6% of listings.
- 60.1% of properties accommodate 6+ guests, serving the market segment for larger families or group travel in Guillena.
- On average, properties in Guillena are equipped to host 5.8 guests.
Guillena Airbnb Booking Patterns (2026): Available vs. Booked Days
Available Days Distribution
Booked Days Distribution
Booking Pattern Insights for Guillena
- The most common availability pattern in Guillena falls within the 271-366 days range, representing 42.9% of listings. This suggests many properties have significant open periods on their calendars.
- Approximately 71.5% of listings show high availability (181+ days open annually), indicating potential for increased bookings or specific owner usage patterns.
- For booked days, the 91-180 days range is most frequent in Guillena (31.4%), reflecting common guest stay durations or potential owner blocking patterns.
- A notable 28.6% of properties secure long booking periods (181+ days booked per year), highlighting successful long-term rental strategies or significant owner usage.
Guillena Airbnb Minimum Stay Requirements Analysis
Distribution of Listings by Minimum Night Requirement
1 Night
10 listings
28.6% of total
2 Nights
3 listings
8.6% of total
3 Nights
1 listings
2.9% of total
4-6 Nights
5 listings
14.3% of total
30+ Nights
16 listings
45.7% of total
Key Insights
- The most prevalent minimum stay requirement in Guillena is 30+ Nights, adopted by 45.7% of listings. This highlights the market's preference for longer commitments.
- A significant segment (45.7%) caters to monthly stays (30+ nights) in Guillena, pointing to opportunities in the extended-stay market.
Recommendations
- Align with the market by considering a 30+ Nights minimum stay, as 45.7% of Guillena hosts use this setting.
- If feasible, allowing 1-night stays, especially midweek or during low season, could capture last-minute bookings, as only 28.6% currently do.
- Explore offering discounts for stays of 30+ nights to attract the 45.7% of the market seeking extended stays.
- Adjust minimum nights based on seasonality – potentially shorter during low season and longer during peak demand periods in Guillena.
Guillena Airbnb Cancellation Policy Trends Analysis (2026)
Super Strict 60 Days
3 listings
8.6% of total
Flexible
3 listings
8.6% of total
Moderate
12 listings
34.3% of total
Firm
15 listings
42.9% of total
Strict
2 listings
5.7% of total
Cancellation Policy Insights for Guillena
- The prevailing Airbnb cancellation policy trend in Guillena is Firm, used by 42.9% of listings.
- There's a relatively balanced mix between guest-friendly (42.9%) and stricter (48.6%) policies, offering choices for different guest needs.
- Strict cancellation policies are quite rare (5.7%), potentially making listings with this policy less competitive unless justified by high demand or property type.
Recommendations for Hosts
- Consider adopting a Firm policy to align with the 42.9% market standard in Guillena.
- Using a Strict policy might deter some guests, as only 5.7% of listings use it. Evaluate if potential revenue protection outweighs possible lower booking rates.
- Regularly review your cancellation policy against competitors and market demand shifts in Guillena.
Guillena STR Booking Lead Time Analysis (2026)
Average Booking Lead Time by Month
Booking Lead Time Insights for Guillena
- The overall average booking lead time for vacation rentals in Guillena is 51 days.
- Guests book furthest in advance for stays during August (average 91 days), likely coinciding with peak travel demand or local events.
- The shortest booking windows occur for stays in February (average 22 days), indicating more last-minute travel plans during this time.
- Seasonally, Summer (71 days avg.) sees the longest lead times, while Winter (33 days avg.) has the shortest, reflecting typical travel planning cycles.
Recommendations for Hosts
- Use the overall average lead time (51 days) as a baseline for your pricing and availability strategy in Guillena.
- For August stays, consider implementing length-of-stay discounts or slightly higher rates for bookings made less than 91 days out to capitalize on advance planning.
- Target marketing efforts for the Summer season well in advance (at least 71 days) to capture early planners.
- Monitor your own booking lead times against these Guillena averages to identify opportunities for dynamic pricing adjustments.
Popular & Essential Airbnb Amenities in Guillena (2026)
Amenity Prevalence
Amenity Insights for Guillena
- Essential amenities in Guillena that guests expect include: Dishes and silverware, Air conditioning, Wifi, TV, Pool. Lacking these (any) could significantly impact bookings.
- Popular amenities like Washer, Cooking basics, Coffee maker are common but not universal. Offering these can provide a competitive edge.
Recommendations for Hosts
- Ensure your listing includes all essential amenities for Guillena: Dishes and silverware, Air conditioning, Wifi, TV, Pool.
- Prioritize adding missing essentials: TV, Pool.
- Consider adding popular differentiators like Washer or Cooking basics to increase appeal.
- Highlight unique or less common amenities you offer (e.g., hot tub, dedicated workspace, EV charger) in your listing description and photos.
- Regularly check competitor amenities in Guillena to stay competitive.
Guillena Airbnb Guest Demographics & Profile Analysis (2026)
Guest Profile Summary for Guillena
- The typical guest profile for Airbnb in Guillena consists of predominantly international visitors (74%), with top international origins including France, typically belonging to the Post-2000s (Gen Z/Alpha) group (50%), primarily speaking English or Spanish.
- Domestic travelers account for 26.0% of guests.
- Key international markets include Spain (26%) and France (15.8%).
- Top languages spoken are English (37.9%) followed by Spanish (16.7%).
- A significant demographic segment is the Post-2000s (Gen Z/Alpha) group, representing 50% of guests.
Recommendations for Hosts
- Focus marketing internationally, particularly towards travelers from France.
- Tailor amenities and listing descriptions to appeal to the dominant Post-2000s (Gen Z/Alpha) demographic (e.g., highlight fast WiFi, smart home features, local guides).
- Highlight unique local experiences or amenities relevant to the primary guest profile.
- Consider seasonal promotions aligned with peak travel times for key origin markets.
Nearby Short-Term Rental Market Comparison
How does the Guillena Airbnb market stack up against its neighbors? Compare key performance metrics like average monthly revenue, ADR, and occupancy rates in surrounding areas to understand the broader regional STR landscape.
| Market | Active Properties | Monthly Revenue | Daily Rate | Avg. Occupancy |
|---|---|---|---|---|
| Monesterio | 17 | $3,001 | $260.35 | 36% |
| Gelves | 26 | $2,989 | $190.74 | 54% |
| Benahavís | 518 | $2,914 | $430.92 | 39% |
| El Paraíso | 13 | $2,679 | $369.93 | 45% |
| Cantillana | 10 | $2,375 | $199.78 | 35% |
| Seville | 7,019 | $2,331 | $174.88 | 50% |
| Gerena | 10 | $2,307 | $277.29 | 38% |
| Marchena | 23 | $2,267 | $344.26 | 37% |
| San Roque | 293 | $2,258 | $329.56 | 39% |
| São Brás de Alportel | 128 | $2,174 | $285.02 | 43% |