Salobreña Airbnb Market Analysis 2026: Short Term Rental Data & Vacation Rental Statistics in Andalusia, Spain
Is Airbnb profitable in Salobreña in 2026? Explore comprehensive Airbnb analytics for Salobreña, Andalusia, Spain to uncover income potential. This 2026 STR market report for Salobreña, based on AirROI data from February 2025 to January 2026, reveals key trends in the market of 279 active listings.
Whether you're considering an Airbnb investment in Salobreña, optimizing your existing vacation rental, or exploring rental arbitrage opportunities, understanding the Salobreña Airbnb data is crucial. Navigating the high regulation landscape is key to maximizing your short term rental income potential. Let's dive into the specifics.
Key Salobreña Airbnb Performance Metrics Overview
Monthly Airbnb Revenue Variations & Income Potential in Salobreña (2026)
Understanding the monthly revenue variations for Airbnb listings in Salobreña is key to maximizing your short term rental income potential. Seasonality significantly impacts earnings. Our analysis, based on data from the past 12 months, shows that the peak revenue month for STRs in Salobreña is typically August, while November often presents the lowest earnings, highlighting opportunities for strategic pricing adjustments during shoulder and low seasons. Explore the typical Airbnb income in Salobreña across different performance tiers:
- Best-in-class properties (Top 10%) achieve $6,394+ monthly, often utilizing dynamic pricing and superior guest experiences.
- Strong performing properties (Top 25%) earn $3,197 or more, indicating effective management and desirable locations/amenities.
- Typical properties (Median) generate around $1,626 per month, representing the average market performance.
- Entry-level properties (Bottom 25%) see earnings around $858, often with potential for optimization.
Average Monthly Airbnb Earnings Trend in Salobreña
Salobreña Airbnb Occupancy Rate Trends (2026)
Maximize your bookings by understanding the Salobreña STR occupancy trends. Seasonal demand shifts significantly influence how often properties are booked. Typically, Augustsees the highest demand (peak season occupancy), while January experiences the lowest (low season). Effective strategies, like adjusting minimum stays or offering promotions, can boost occupancy during slower periods. Here's how different property tiers perform in Salobreña:
- Best-in-class properties (Top 10%) achieve 76%+ occupancy, indicating high desirability and potentially optimized availability.
- Strong performing properties (Top 25%) maintain 58% or higher occupancy, suggesting good market fit and guest satisfaction.
- Typical properties (Median) have an occupancy rate around 34%.
- Entry-level properties (Bottom 25%) average 16% occupancy, potentially facing higher vacancy.
Average Monthly Occupancy Rate Trend in Salobreña
Average Daily Rate (ADR) Airbnb Trends in Salobreña (2026)
Effective short term rental pricing strategy in Salobreña involves understanding monthly ADR fluctuations. The Average Daily Rate (ADR) for Airbnb in Salobreña typically peaks in January and dips lowest during March. Leveraging Airbnb dynamic pricing tools or strategies based on this seasonality can significantly boost revenue. Here's a look at the typical nightly rates achieved:
- Best-in-class properties (Top 10%) command rates of $453+ per night, often due to premium features or locations.
- Strong performing properties (Top 25%) achieve nightly rates of $290 or more.
- Typical properties (Median) charge around $154 per night.
- Entry-level properties (Bottom 25%) earn around $108 per night.
Average Daily Rate (ADR) Trend by Month in Salobreña
Get Live Salobreña Market Intelligence 👇

Explore Real-time Analytics
Airbnb Seasonality Analysis & Trends in Salobreña (2026)
Peak Season (August, July, September)
- Revenue averages $4,333 per month
- Occupancy rates average 54.5%
- Daily rates average $275
Shoulder Season
- Revenue averages $2,366 per month
- Occupancy maintains around 34.3%
- Daily rates hold near $242
Low Season (February, November, December)
- Revenue drops to average $1,721 per month
- Occupancy decreases to average 31.7%
- Daily rates adjust to average $229
Seasonality Insights for Salobreña
- The Airbnb seasonality in Salobreña shows highly seasonal trends requiring careful strategy. While the sections above show seasonal averages, it's also insightful to look at the extremes:
- During the high season, the absolute peak month showcases Salobreña's highest earning potential, with monthly revenues capable of climbing to $5,312, occupancy reaching a high of 64.6%, and ADRs peaking at $288.
- Conversely, the slowest single month of the year, typically falling within the low season, marks the market's lowest point. In this month, revenue might dip to $1,654, occupancy could drop to 20.2%, and ADRs may adjust down to $211.
- Understanding both the seasonal averages and these monthly peaks and troughs in revenue, occupancy, and ADR is crucial for maximizing your Airbnb profit potential in Salobreña.
Seasonal Strategies for Maximizing Profit
- Peak Season: Maximize revenue through premium pricing and potentially longer minimum stays. Ensure high availability.
- Low Season: Offer competitive pricing, special promotions (e.g., extended stay discounts), and flexible cancellation policies. Target off-season travelers like remote workers or budget-conscious guests.
- Shoulder Seasons: Implement dynamic pricing that balances peak and low rates. Target weekend travelers or specific events. Offer slightly more flexible terms than peak season.
- Regularly analyze your own performance against these Salobreña seasonality benchmarks and adjust your pricing and availability strategy accordingly.
Best Areas for Airbnb Investment in Salobreña (2026)
Exploring the top neighborhoods for short-term rentals in Salobreña? This section highlights key areas, outlining why they are attractive for hosts and guests, along with notable local attractions. Consider these locations based on your target guest profile and investment strategy.
| Neighborhood / Area | Why Host Here? (Target Guests & Appeal) | Key Attractions & Landmarks |
|---|---|---|
| La Caleta | Known for its beautiful beaches and tranquil atmosphere, La Caleta attracts families and couples looking for relaxation and sun. Its proximity to the beach makes it ideal for summer vacationers. | La Caleta Beach, Centro Cultural de Salobreña, Mirador del Castillo, Paseo Marítimo, Parque el Majuelo |
| Salobreña Old Town | The historic old town offers charming streets, breathtaking views, and a glimpse into Andalusian culture. Tourists love exploring its narrow alleys and enjoying local cuisine. | Salobreña Castle, Church of Our Lady of Sorrows, Plaza de las Huertas, Pueblo de Salobreña, Scenic views of the coast |
| La Playa | This area is ideal for those looking to enjoy beach activities and water sports. The vibrant beach clubs and restaurants attract a younger crowd and tourists seeking entertainment. | Playa de Salobreña, Beach Bars, Water Sports Activities, Amarilla Beach, Strolling promenade along the beach |
| Castillo de Salobreña | The castle area offers stunning panoramic views and historical significance. It's a great place for tourists who appreciate history and photography. | Castillo de Salobreña, Historical exhibits, Photography spots, Walkways around the castle, Sunset views |
| Salobreña Golf | This area is perfect for golf enthusiasts and those seeking luxury villas. It appeals to travelers looking for a more upscale stay with leisure activities. | Salobreña Golf Club, Luxury Villas, Laguna Beach, Tranquil surroundings, Nature walks |
| Almuñécar | Just a short drive away, this neighboring town offers more beaches and attractions. It's ideal for Airbnbs that want to cater to guests wanting to explore both towns. | Aquarium of Almuñécar, Beaches of Almuñécar, Peñón del Santo, Almuñécar Castle, Tropical Garden |
| Cueva del Agua | Nature lovers are drawn to this area because of its beautiful caves and hiking opportunities. It's perfect for adventure seekers and those wanting to explore the natural beauty of the region. | Cueva del Agua, Hiking Trails, Natural Parks, Bird Watching, Gastronomy experiences |
| Los Peñones | Known for its stunning cliffs and natural beauty, this area attracts those looking for a scenic escape and offers a tranquil environment for a relaxing getaway. | Cliffs of Los Peñones, Scenic Trails, Beach Access, Nature Parks, Local Restaurants |
Understanding Airbnb License Requirements & STR Laws in Salobreña (2026)
Yes, Salobreña, Andalusia, Spain enforces high STR regulations. Obtaining a license and ensuring compliance is almost certainly required according to current 2026 STR laws. Always verify the latest short term rental regulations and Airbnb license requirements directly with local government authorities for Salobreña to ensure full compliance before hosting.
(Source: AirROI data, 2026, based on 86% licensed listings)
Top Performing Airbnb Properties in Salobreña (2026)
Benchmark your potential! Explore examples of top-performing Airbnb properties in Salobreñabased on Trailing Twelve Month (TTM) revenue. Analyze their characteristics, revenue, occupancy rate, and ADR to understand what drives success in this market.

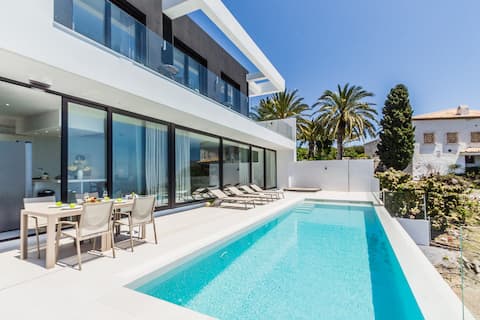
Cliff House with Heated Pool
Entire Place • 3 bedrooms
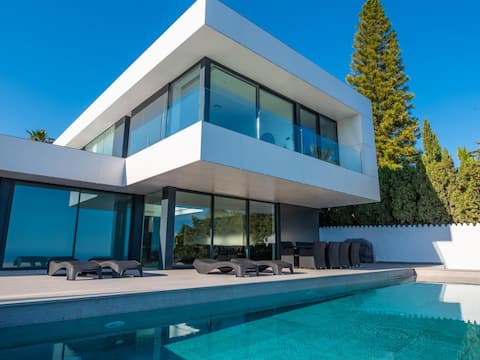
Villa Nobra with private heated pool and jacuzzi
Entire Place • 4 bedrooms

Magnificent 4 bedroom villa with stunning views
Entire Place • 4 bedrooms
Luxurious villa with heated pool
Entire Place • 6 bedrooms

Villa Infinite
Entire Place • 4 bedrooms

Luxury villa with incredible views,private pool
Entire Place • 3 bedrooms
Note: Performance varies based on location, size, amenities, seasonality, and management quality. Data reflects the past 12 months.
Top Performing Airbnb Hosts in Salobreña (2026)
Learn from the best! This table showcases top-performing Airbnb hosts in Salobreña based on the number of properties managed and estimated total revenue over the past year. Analyze their scale and performance metrics.
| Host Name | Properties | Grossing Revenue | Stay Reviews | Avg Rating |
|---|---|---|---|---|
| Carlos | 26 | $1,237,759 | 382 | 4.75/5.0 |
| Mathilde | 17 | $470,795 | 69 | 4.93/5.0 |
| Gabriel | 5 | $259,083 | 144 | 4.82/5.0 |
| Comeback Imm | 7 | $142,945 | 68 | 4.89/5.0 |
| Holidu | 2 | $137,851 | 19 | 4.88/5.0 |
| Silvina Daniela | 7 | $121,772 | 108 | 4.82/5.0 |
| Holidu | 4 | $113,269 | 35 | 4.79/5.0 |
| Holidu | 3 | $99,925 | 12 | 4.78/5.0 |
| Ingeborg | 2 | $97,963 | 94 | 4.97/5.0 |
| Holidu | 1 | $92,959 | 4 | 4.75/5.0 |
Analyzing the strategies of top hosts, such as their property selection, pricing, and guest communication, can offer valuable lessons for optimizing your own Airbnb operations in Salobreña.
Dive Deeper: Advanced Salobreña STR Market Data (2026)
Ready to unlock more insights? AirROI provides access to advanced metrics and comprehensive Airbnb data for Salobreña. Explore detailed analytics beyond this report to refine your investment strategy, optimize pricing, and maximize your vacation rental profits.
Explore Advanced MetricsSalobreña Short-Term Rental Market Composition (2026): Property & Room Types
Room Type Distribution
Property Type Distribution
Market Composition Insights for Salobreña
- The Salobreña Airbnb market composition is heavily skewed towards Entire Home/Apt listings, which make up 96.8% of the 279 active rentals. This indicates strong guest preference for privacy and space.
- Looking at the property type distribution in Salobreña, House properties are the most common (55.9%), reflecting the local real estate landscape.
- Houses represent a significant 55.9% portion, catering likely to families or larger groups.
- Smaller segments like hotel/boutique, others, outdoor/unique (combined 4.7%) offer potential for unique stay experiences.
Salobreña Airbnb Room Capacity Analysis (2026): Bedroom Distribution
Distribution of Listings by Number of Bedrooms
Room Capacity Insights for Salobreña
- The dominant room capacity in Salobreña is 2 bedrooms listings, making up 34.8% of the market. This suggests a strong demand for properties suitable for couples or solo travelers.
- Together, 2 bedrooms and 3 bedrooms properties represent 62.4% of the active Airbnb listings in Salobreña, indicating a high concentration in these sizes.
- A significant 50.2% of listings offer 3+ bedrooms, catering to larger groups and families seeking more space in Salobreña.
Salobreña Vacation Rental Guest Capacity Trends (2026)
Distribution of Listings by Guest Capacity
Guest Capacity Insights for Salobreña
- The most common guest capacity trend in Salobreña vacation rentals is listings accommodating 4 guests (26.9%). This suggests the primary traveler segment is likely small families or groups.
- Properties designed for 4 guests and 6 guests dominate the Salobreña STR market, accounting for 50.6% of listings.
- 48.0% of properties accommodate 6+ guests, serving the market segment for larger families or group travel in Salobreña.
- On average, properties in Salobreña are equipped to host 5.3 guests.
Salobreña Airbnb Booking Patterns (2026): Available vs. Booked Days
Available Days Distribution
Booked Days Distribution
Booking Pattern Insights for Salobreña
- The most common availability pattern in Salobreña falls within the 271-366 days range, representing 57% of listings. This suggests many properties have significant open periods on their calendars.
- Approximately 86.0% of listings show high availability (181+ days open annually), indicating potential for increased bookings or specific owner usage patterns.
- For booked days, the 31-90 days range is most frequent in Salobreña (32.3%), reflecting common guest stay durations or potential owner blocking patterns.
- A notable 15.0% of properties secure long booking periods (181+ days booked per year), highlighting successful long-term rental strategies or significant owner usage.
Salobreña Airbnb Minimum Stay Requirements Analysis
Distribution of Listings by Minimum Night Requirement
1 Night
20 listings
7.2% of total
2 Nights
20 listings
7.2% of total
3 Nights
16 listings
5.7% of total
4-6 Nights
60 listings
21.5% of total
7-29 Nights
53 listings
19% of total
30+ Nights
110 listings
39.4% of total
Key Insights
- The most prevalent minimum stay requirement in Salobreña is 30+ Nights, adopted by 39.4% of listings. This highlights the market's preference for longer commitments.
- Very short stays (1-2 nights) are less common (14.4%), suggesting hosts prefer slightly longer bookings to optimize turnover.
- A significant segment (39.4%) caters to monthly stays (30+ nights) in Salobreña, pointing to opportunities in the extended-stay market.
Recommendations
- Align with the market by considering a 30+ Nights minimum stay, as 39.4% of Salobreña hosts use this setting.
- If feasible, allowing 1-night stays, especially midweek or during low season, could capture last-minute bookings, as only 7.2% currently do.
- Explore offering discounts for stays of 30+ nights to attract the 39.4% of the market seeking extended stays.
- Adjust minimum nights based on seasonality – potentially shorter during low season and longer during peak demand periods in Salobreña.
Salobreña Airbnb Cancellation Policy Trends Analysis (2026)
Super Strict 60 Days
29 listings
10.4% of total
Limited
1 listings
0.4% of total
Super Strict 30 Days
3 listings
1.1% of total
Flexible
24 listings
8.6% of total
Moderate
59 listings
21.1% of total
Firm
114 listings
40.9% of total
Strict
49 listings
17.6% of total
Cancellation Policy Insights for Salobreña
- The prevailing Airbnb cancellation policy trend in Salobreña is Firm, used by 40.9% of listings.
- A majority (58.5%) of hosts in Salobreña utilize Firm or Strict policies, indicating a market where hosts prioritize booking security.
Recommendations for Hosts
- Consider adopting a Firm policy to align with the 40.9% market standard in Salobreña.
- Regularly review your cancellation policy against competitors and market demand shifts in Salobreña.
Salobreña STR Booking Lead Time Analysis (2026)
Average Booking Lead Time by Month
Booking Lead Time Insights for Salobreña
- The overall average booking lead time for vacation rentals in Salobreña is 66 days.
- Guests book furthest in advance for stays during August (average 102 days), likely coinciding with peak travel demand or local events.
- The shortest booking windows occur for stays in March (average 42 days), indicating more last-minute travel plans during this time.
- Seasonally, Summer (86 days avg.) sees the longest lead times, while Winter (47 days avg.) has the shortest, reflecting typical travel planning cycles.
Recommendations for Hosts
- Use the overall average lead time (66 days) as a baseline for your pricing and availability strategy in Salobreña.
- For August stays, consider implementing length-of-stay discounts or slightly higher rates for bookings made less than 102 days out to capitalize on advance planning.
- Target marketing efforts for the Summer season well in advance (at least 86 days) to capture early planners.
- Monitor your own booking lead times against these Salobreña averages to identify opportunities for dynamic pricing adjustments.
Popular & Essential Airbnb Amenities in Salobreña (2026)
Amenity Prevalence
Amenity Insights for Salobreña
- Essential amenities in Salobreña that guests expect include: Kitchen, TV. Lacking these (any) could significantly impact bookings.
- Popular amenities like Washer, Wifi, Refrigerator are common but not universal. Offering these can provide a competitive edge.
- Warning: Wifi is not universally provided but is considered essential globally. Ensure reliable Wifi is offered.
Recommendations for Hosts
- Ensure your listing includes all essential amenities for Salobreña: Kitchen, TV.
- Prioritize adding missing essentials: Kitchen, TV.
- Consider adding popular differentiators like Washer or Wifi to increase appeal.
- Highlight unique or less common amenities you offer (e.g., hot tub, dedicated workspace, EV charger) in your listing description and photos.
- Regularly check competitor amenities in Salobreña to stay competitive.
Salobreña Airbnb Guest Demographics & Profile Analysis (2026)
Guest Profile Summary for Salobreña
- The typical guest profile for Airbnb in Salobreña consists of predominantly international visitors (68%), with top international origins including United Kingdom, typically belonging to the Post-2000s (Gen Z/Alpha) group (50%), primarily speaking English or Spanish.
- Domestic travelers account for 31.6% of guests.
- Key international markets include Spain (31.6%) and United Kingdom (15.2%).
- Top languages spoken are English (37.4%) followed by Spanish (21.9%).
- A significant demographic segment is the Post-2000s (Gen Z/Alpha) group, representing 50% of guests.
Recommendations for Hosts
- Focus marketing internationally, particularly towards travelers from United Kingdom.
- Tailor amenities and listing descriptions to appeal to the dominant Post-2000s (Gen Z/Alpha) demographic (e.g., highlight fast WiFi, smart home features, local guides).
- Highlight unique local experiences or amenities relevant to the primary guest profile.
- Consider seasonal promotions aligned with peak travel times for key origin markets.
Nearby Short-Term Rental Market Comparison
How does the Salobreña Airbnb market stack up against its neighbors? Compare key performance metrics like average monthly revenue, ADR, and occupancy rates in surrounding areas to understand the broader regional STR landscape.
| Market | Active Properties | Monthly Revenue | Daily Rate | Avg. Occupancy |
|---|---|---|---|---|
| Cártama | 48 | $4,137 | $378.39 | 45% |
| Alhaurín de la Torre | 210 | $3,716 | $325.91 | 46% |
| Alhaurín el Grande | 271 | $3,613 | $310.22 | 46% |
| Casarabonela | 24 | $3,495 | $286.94 | 39% |
| Marbella | 5,279 | $2,756 | $342.36 | 42% |
| Villanueva del Rosario | 12 | $2,590 | $310.50 | 35% |
| Gójar | 14 | $2,483 | $231.10 | 33% |
| Coín | 119 | $2,388 | $303.70 | 41% |
| Ojén | 136 | $2,305 | $244.23 | 44% |
| Málaga | 8,177 | $2,191 | $175.56 | 52% |