Torrox Airbnb Market Analysis 2026: Short Term Rental Data & Vacation Rental Statistics in Andalusia, Spain
Is Airbnb profitable in Torrox in 2026? Explore comprehensive Airbnb analytics for Torrox, Andalusia, Spain to uncover income potential. This 2026 STR market report for Torrox, based on AirROI data from February 2025 to January 2026, reveals key trends in the market of 814 active listings.
Whether you're considering an Airbnb investment in Torrox, optimizing your existing vacation rental, or exploring rental arbitrage opportunities, understanding the Torrox Airbnb data is crucial. Navigating the high regulation landscape is key to maximizing your short term rental income potential. Let's dive into the specifics.
Key Torrox Airbnb Performance Metrics Overview
Monthly Airbnb Revenue Variations & Income Potential in Torrox (2026)
Understanding the monthly revenue variations for Airbnb listings in Torrox is key to maximizing your short term rental income potential. Seasonality significantly impacts earnings. Our analysis, based on data from the past 12 months, shows that the peak revenue month for STRs in Torrox is typically August, while January often presents the lowest earnings, highlighting opportunities for strategic pricing adjustments during shoulder and low seasons. Explore the typical Airbnb income in Torrox across different performance tiers:
- Best-in-class properties (Top 10%) achieve $4,416+ monthly, often utilizing dynamic pricing and superior guest experiences.
- Strong performing properties (Top 25%) earn $2,912 or more, indicating effective management and desirable locations/amenities.
- Typical properties (Median) generate around $1,712 per month, representing the average market performance.
- Entry-level properties (Bottom 25%) see earnings around $887, often with potential for optimization.
Average Monthly Airbnb Earnings Trend in Torrox
Torrox Airbnb Occupancy Rate Trends (2026)
Maximize your bookings by understanding the Torrox STR occupancy trends. Seasonal demand shifts significantly influence how often properties are booked. Typically, Augustsees the highest demand (peak season occupancy), while January experiences the lowest (low season). Effective strategies, like adjusting minimum stays or offering promotions, can boost occupancy during slower periods. Here's how different property tiers perform in Torrox:
- Best-in-class properties (Top 10%) achieve 83%+ occupancy, indicating high desirability and potentially optimized availability.
- Strong performing properties (Top 25%) maintain 66% or higher occupancy, suggesting good market fit and guest satisfaction.
- Typical properties (Median) have an occupancy rate around 41%.
- Entry-level properties (Bottom 25%) average 20% occupancy, potentially facing higher vacancy.
Average Monthly Occupancy Rate Trend in Torrox
Average Daily Rate (ADR) Airbnb Trends in Torrox (2026)
Effective short term rental pricing strategy in Torrox involves understanding monthly ADR fluctuations. The Average Daily Rate (ADR) for Airbnb in Torrox typically peaks in August and dips lowest during February. Leveraging Airbnb dynamic pricing tools or strategies based on this seasonality can significantly boost revenue. Here's a look at the typical nightly rates achieved:
- Best-in-class properties (Top 10%) command rates of $375+ per night, often due to premium features or locations.
- Strong performing properties (Top 25%) achieve nightly rates of $211 or more.
- Typical properties (Median) charge around $137 per night.
- Entry-level properties (Bottom 25%) earn around $98 per night.
Average Daily Rate (ADR) Trend by Month in Torrox
Get Live Torrox Market Intelligence 👇

Explore Real-time Analytics
Airbnb Seasonality Analysis & Trends in Torrox (2026)
Peak Season (August, July, September)
- Revenue averages $3,656 per month
- Occupancy rates average 58.6%
- Daily rates average $229
Shoulder Season
- Revenue averages $1,899 per month
- Occupancy maintains around 41.7%
- Daily rates hold near $185
Low Season (January, February, December)
- Revenue drops to average $1,327 per month
- Occupancy decreases to average 31.8%
- Daily rates adjust to average $183
Seasonality Insights for Torrox
- The Airbnb seasonality in Torrox shows highly seasonal trends requiring careful strategy. While the sections above show seasonal averages, it's also insightful to look at the extremes:
- During the high season, the absolute peak month showcases Torrox's highest earning potential, with monthly revenues capable of climbing to $4,500, occupancy reaching a high of 67.7%, and ADRs peaking at $238.
- Conversely, the slowest single month of the year, typically falling within the low season, marks the market's lowest point. In this month, revenue might dip to $1,050, occupancy could drop to 23.5%, and ADRs may adjust down to $168.
- Understanding both the seasonal averages and these monthly peaks and troughs in revenue, occupancy, and ADR is crucial for maximizing your Airbnb profit potential in Torrox.
Seasonal Strategies for Maximizing Profit
- Peak Season: Maximize revenue through premium pricing and potentially longer minimum stays. Ensure high availability.
- Low Season: Offer competitive pricing, special promotions (e.g., extended stay discounts), and flexible cancellation policies. Target off-season travelers like remote workers or budget-conscious guests.
- Shoulder Seasons: Implement dynamic pricing that balances peak and low rates. Target weekend travelers or specific events. Offer slightly more flexible terms than peak season.
- Regularly analyze your own performance against these Torrox seasonality benchmarks and adjust your pricing and availability strategy accordingly.
Best Areas for Airbnb Investment in Torrox (2026)
Exploring the top neighborhoods for short-term rentals in Torrox? This section highlights key areas, outlining why they are attractive for hosts and guests, along with notable local attractions. Consider these locations based on your target guest profile and investment strategy.
| Neighborhood / Area | Why Host Here? (Target Guests & Appeal) | Key Attractions & Landmarks |
|---|---|---|
| Torrox Costa | A popular coastal area known for its beautiful beaches and waterfront promenades. Perfect for tourists seeking sun and sea, with easy access to local restaurants and bars. | Playa de Torrox Costa, El Morche Beach, Paseo Maritimo, Torrox Marina, Cliffs of Maro-Cerro Gordo Natural Area |
| Torrox Pueblo | Charming traditional Andalusian village offering a taste of local culture with stunning views and cobbled streets. Attracts visitors interested in history and authentic experiences. | Church of Nuestra Señora de la Encarnación, Plaza de las Tres Culturas, Mirador de Torrox, Local festivals and events, Traditional tapas bars |
| Nerja | Famous for its picturesque beaches and nearby caves, Nerja draws tourists looking for beautiful landscapes and outdoor activities. It offers a vibrant nightlife and cultural scene. | Cuevas de Nerja, Balcony of Europe, Nerja Beach, Burriana Beach, Acueducto del Águila |
| Frigiliana | Known as one of the most beautiful villages in Spain, Frigiliana provides a stunning setting with whitewashed houses and mountain views, appealing to many tourists for day trips and exploration. | Historic center, Castle of Lizar, Cerro Gordo Natural Area, Botanical Garden, Local artisanal shops |
| La Axarquía | A region known for its rich agricultural land, offering a unique cultural landscape, attracting visitors interested in rural tourism and nature adventures. | Local vineyards, Andalusian hiking trails, Maro-Cerro Gordo Cliffs, Authentic villages, Sunflower fields |
| Baviera Golf | A popular golf resort area that attracts golf enthusiasts and those looking for leisure activities, offering upscale amenities and a relaxing environment. | Baviera Golf Course, Clubhouse amenities, Nearby beaches, Local dining options, Scenic drives |
| Maro | A small and beautiful village near the coast, known for its stunning natural landscapes and tranquility, making it a great spot for guests looking for a peaceful getaway. | Beaches of Maro, Cerro Gordo Natural Area, Local hiking paths, Scenic viewpoints, Traditional Andalusian cuisine |
| Algarrobo | An area with a mix of beach and village life, Algarrobo offers a less touristy experience while still being near the coast, ideal for families and those looking for a quiet stay. | Algarrobo Beach, Aquavelis Water Park, Local markets, Charming village square, Coastal walks |
Understanding Airbnb License Requirements & STR Laws in Torrox (2026)
Yes, Torrox, Andalusia, Spain enforces high STR regulations. Obtaining a license and ensuring compliance is almost certainly required according to current 2026 STR laws. Always verify the latest short term rental regulations and Airbnb license requirements directly with local government authorities for Torrox to ensure full compliance before hosting.
(Source: AirROI data, 2026, based on 82% licensed listings)
Top Performing Airbnb Properties in Torrox (2026)
Benchmark your potential! Explore examples of top-performing Airbnb properties in Torroxbased on Trailing Twelve Month (TTM) revenue. Analyze their characteristics, revenue, occupancy rate, and ADR to understand what drives success in this market.

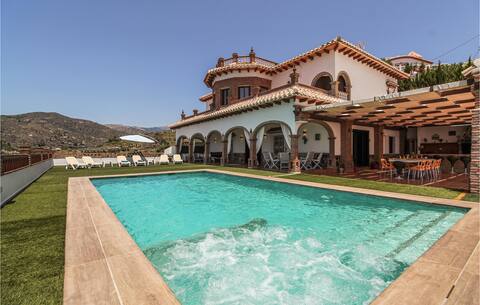
Beautiful Villa with Private Pool & Stunning Views
Entire Place • 4 bedrooms

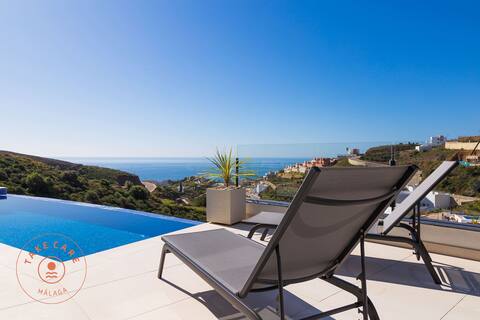
Luxury Seaview Villa Leala - TCM
Entire Place • 3 bedrooms
Pet friendly home in Malaga
Entire Place • 5 bedrooms
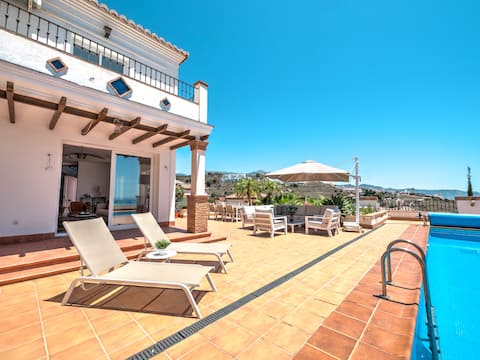
Seaview Luxury Villa Jensen - TCM
Entire Place • 5 bedrooms
Luxurious villa with private pool and sea view
Entire Place • 7 bedrooms

Luxurious in Nerja, sea view and unparalleled pool
Entire Place • 2 bedrooms
Note: Performance varies based on location, size, amenities, seasonality, and management quality. Data reflects the past 12 months.
Top Performing Airbnb Hosts in Torrox (2026)
Learn from the best! This table showcases top-performing Airbnb hosts in Torrox based on the number of properties managed and estimated total revenue over the past year. Analyze their scale and performance metrics.
| Host Name | Properties | Grossing Revenue | Stay Reviews | Avg Rating |
|---|---|---|---|---|
| Ruralidays | 40 | $719,285 | 140 | 4.82/5.0 |
| Carmina | 27 | $511,442 | 2059 | 4.72/5.0 |
| SolSet | 22 | $494,311 | 388 | 4.50/5.0 |
| Cecilia - Interhome | 11 | $335,205 | 56 | 4.73/5.0 |
| Kristina | 12 | $293,856 | 307 | 4.84/5.0 |
| Emil - NerjaRental | 5 | $267,526 | 88 | 4.81/5.0 |
| Take Care Malaga | 4 | $257,184 | 45 | 4.92/5.0 |
| Richard | 7 | $220,968 | 84 | 4.55/5.0 |
| Jose Carlos | 5 | $215,392 | 214 | 4.92/5.0 |
| Miguel | 19 | $211,234 | 144 | 4.69/5.0 |
Analyzing the strategies of top hosts, such as their property selection, pricing, and guest communication, can offer valuable lessons for optimizing your own Airbnb operations in Torrox.
Dive Deeper: Advanced Torrox STR Market Data (2026)
Ready to unlock more insights? AirROI provides access to advanced metrics and comprehensive Airbnb data for Torrox. Explore detailed analytics beyond this report to refine your investment strategy, optimize pricing, and maximize your vacation rental profits.
Explore Advanced MetricsTorrox Short-Term Rental Market Composition (2026): Property & Room Types
Room Type Distribution
Property Type Distribution
Market Composition Insights for Torrox
- The Torrox Airbnb market composition is heavily skewed towards Entire Home/Apt listings, which make up 99.3% of the 814 active rentals. This indicates strong guest preference for privacy and space.
- Looking at the property type distribution in Torrox, Apartment/Condo properties are the most common (67.4%), reflecting the local real estate landscape.
- Houses represent a significant 31.6% portion, catering likely to families or larger groups.
- Smaller segments like hotel/boutique, others (combined 1.0%) offer potential for unique stay experiences.
Torrox Airbnb Room Capacity Analysis (2026): Bedroom Distribution
Distribution of Listings by Number of Bedrooms
Room Capacity Insights for Torrox
- The dominant room capacity in Torrox is 2 bedrooms listings, making up 41.6% of the market. This suggests a strong demand for properties suitable for couples or solo travelers.
- Together, 2 bedrooms and 1 bedroom properties represent 68.6% of the active Airbnb listings in Torrox, indicating a high concentration in these sizes.
- A significant 25.9% of listings offer 3+ bedrooms, catering to larger groups and families seeking more space in Torrox.
Torrox Vacation Rental Guest Capacity Trends (2026)
Distribution of Listings by Guest Capacity
Guest Capacity Insights for Torrox
- The most common guest capacity trend in Torrox vacation rentals is listings accommodating 4 guests (45.8%). This suggests the primary traveler segment is likely small families or groups.
- Properties designed for 4 guests and 6 guests dominate the Torrox STR market, accounting for 65.6% of listings.
- 27.9% of properties accommodate 6+ guests, serving the market segment for larger families or group travel in Torrox.
- On average, properties in Torrox are equipped to host 4.5 guests.
Torrox Airbnb Booking Patterns (2026): Available vs. Booked Days
Available Days Distribution
Booked Days Distribution
Booking Pattern Insights for Torrox
- The most common availability pattern in Torrox falls within the 271-366 days range, representing 53.9% of listings. This suggests many properties have significant open periods on their calendars.
- Approximately 83.5% of listings show high availability (181+ days open annually), indicating potential for increased bookings or specific owner usage patterns.
- For booked days, the 91-180 days range is most frequent in Torrox (30.2%), reflecting common guest stay durations or potential owner blocking patterns.
- A notable 17.6% of properties secure long booking periods (181+ days booked per year), highlighting successful long-term rental strategies or significant owner usage.
Torrox Airbnb Minimum Stay Requirements Analysis
Distribution of Listings by Minimum Night Requirement
1 Night
66 listings
8.1% of total
2 Nights
32 listings
3.9% of total
3 Nights
43 listings
5.3% of total
4-6 Nights
247 listings
30.3% of total
7-29 Nights
72 listings
8.8% of total
30+ Nights
354 listings
43.5% of total
Key Insights
- The most prevalent minimum stay requirement in Torrox is 30+ Nights, adopted by 43.5% of listings. This highlights the market's preference for longer commitments.
- Very short stays (1-2 nights) are less common (12.0%), suggesting hosts prefer slightly longer bookings to optimize turnover.
- A significant segment (43.5%) caters to monthly stays (30+ nights) in Torrox, pointing to opportunities in the extended-stay market.
Recommendations
- Align with the market by considering a 30+ Nights minimum stay, as 43.5% of Torrox hosts use this setting.
- If feasible, allowing 1-night stays, especially midweek or during low season, could capture last-minute bookings, as only 8.1% currently do.
- Explore offering discounts for stays of 30+ nights to attract the 43.5% of the market seeking extended stays.
- Adjust minimum nights based on seasonality – potentially shorter during low season and longer during peak demand periods in Torrox.
Torrox Airbnb Cancellation Policy Trends Analysis (2026)
Super Strict 60 Days
55 listings
6.8% of total
Limited
4 listings
0.5% of total
Super Strict 30 Days
63 listings
7.8% of total
Non-refundable
1 listings
0.1% of total
Flexible
62 listings
7.6% of total
Moderate
141 listings
17.4% of total
Firm
372 listings
45.9% of total
Strict
113 listings
13.9% of total
Cancellation Policy Insights for Torrox
- The prevailing Airbnb cancellation policy trend in Torrox is Firm, used by 45.9% of listings.
- A majority (59.8%) of hosts in Torrox utilize Firm or Strict policies, indicating a market where hosts prioritize booking security.
Recommendations for Hosts
- Consider adopting a Firm policy to align with the 45.9% market standard in Torrox.
- Using a Strict policy might deter some guests, as only 13.9% of listings use it. Evaluate if potential revenue protection outweighs possible lower booking rates.
- Regularly review your cancellation policy against competitors and market demand shifts in Torrox.
Torrox STR Booking Lead Time Analysis (2026)
Average Booking Lead Time by Month
Booking Lead Time Insights for Torrox
- The overall average booking lead time for vacation rentals in Torrox is 76 days.
- Guests book furthest in advance for stays during August (average 103 days), likely coinciding with peak travel demand or local events.
- The shortest booking windows occur for stays in December (average 60 days), indicating more last-minute travel plans during this time.
- Seasonally, Summer (87 days avg.) sees the longest lead times, while Winter (66 days avg.) has the shortest, reflecting typical travel planning cycles.
Recommendations for Hosts
- Use the overall average lead time (76 days) as a baseline for your pricing and availability strategy in Torrox.
- For August stays, consider implementing length-of-stay discounts or slightly higher rates for bookings made less than 103 days out to capitalize on advance planning.
- Target marketing efforts for the Summer season well in advance (at least 87 days) to capture early planners.
- Monitor your own booking lead times against these Torrox averages to identify opportunities for dynamic pricing adjustments.
Popular & Essential Airbnb Amenities in Torrox (2026)
Amenity Prevalence
Amenity Insights for Torrox
- Essential amenities in Torrox that guests expect include: TV, Kitchen, Wifi, Washer. Lacking these (any) could significantly impact bookings.
- Popular amenities like Air conditioning, Refrigerator, Coffee maker are common but not universal. Offering these can provide a competitive edge.
Recommendations for Hosts
- Ensure your listing includes all essential amenities for Torrox: TV, Kitchen, Wifi, Washer.
- Prioritize adding missing essentials: TV, Kitchen, Wifi, Washer.
- Consider adding popular differentiators like Air conditioning or Refrigerator to increase appeal.
- Highlight unique or less common amenities you offer (e.g., hot tub, dedicated workspace, EV charger) in your listing description and photos.
- Regularly check competitor amenities in Torrox to stay competitive.
Torrox Airbnb Guest Demographics & Profile Analysis (2026)
Guest Profile Summary for Torrox
- The typical guest profile for Airbnb in Torrox consists of predominantly international visitors (75%), with top international origins including United Kingdom, typically belonging to the Post-2000s (Gen Z/Alpha) group (50%), primarily speaking English or Spanish.
- Domestic travelers account for 25.0% of guests.
- Key international markets include Spain (25%) and United Kingdom (15.7%).
- Top languages spoken are English (37.9%) followed by Spanish (17%).
- A significant demographic segment is the Post-2000s (Gen Z/Alpha) group, representing 50% of guests.
Recommendations for Hosts
- Focus marketing internationally, particularly towards travelers from United Kingdom.
- Tailor amenities and listing descriptions to appeal to the dominant Post-2000s (Gen Z/Alpha) demographic (e.g., highlight fast WiFi, smart home features, local guides).
- Highlight unique local experiences or amenities relevant to the primary guest profile.
- Consider seasonal promotions aligned with peak travel times for key origin markets.
Nearby Short-Term Rental Market Comparison
How does the Torrox Airbnb market stack up against its neighbors? Compare key performance metrics like average monthly revenue, ADR, and occupancy rates in surrounding areas to understand the broader regional STR landscape.
| Market | Active Properties | Monthly Revenue | Daily Rate | Avg. Occupancy |
|---|---|---|---|---|
| Cártama | 48 | $4,137 | $378.39 | 45% |
| Alhaurín de la Torre | 210 | $3,716 | $325.91 | 46% |
| Alhaurín el Grande | 271 | $3,613 | $310.22 | 46% |
| Casarabonela | 24 | $3,495 | $286.94 | 39% |
| Marbella | 5,279 | $2,756 | $342.36 | 42% |
| Villanueva del Rosario | 12 | $2,590 | $310.50 | 35% |
| Gójar | 14 | $2,483 | $231.10 | 33% |
| Coín | 119 | $2,388 | $303.70 | 41% |
| Ojén | 136 | $2,305 | $244.23 | 44% |
| Málaga | 8,177 | $2,191 | $175.56 | 52% |