Ubrique Airbnb Market Analysis 2026: Short Term Rental Data & Vacation Rental Statistics in Andalusia, Spain
Is Airbnb profitable in Ubrique in 2026? Explore comprehensive Airbnb analytics for Ubrique, Andalusia, Spain to uncover income potential. This 2026 STR market report for Ubrique, based on AirROI data from February 2025 to January 2026, reveals key trends in the niche market of 21 active listings.
Whether you're considering an Airbnb investment in Ubrique, optimizing your existing vacation rental, or exploring rental arbitrage opportunities, understanding the Ubrique Airbnb data is crucial. Navigating the high regulation landscape is key to maximizing your short term rental income potential. Let's dive into the specifics.
Key Ubrique Airbnb Performance Metrics Overview
Monthly Airbnb Revenue Variations & Income Potential in Ubrique (2026)
Understanding the monthly revenue variations for Airbnb listings in Ubrique is key to maximizing your short term rental income potential. Seasonality significantly impacts earnings. Our analysis, based on data from the past 12 months, shows that the peak revenue month for STRs in Ubrique is typically December, while February often presents the lowest earnings, highlighting opportunities for strategic pricing adjustments during shoulder and low seasons. Explore the typical Airbnb income in Ubrique across different performance tiers:
- Best-in-class properties (Top 10%) achieve $2,094+ monthly, often utilizing dynamic pricing and superior guest experiences.
- Strong performing properties (Top 25%) earn $1,488 or more, indicating effective management and desirable locations/amenities.
- Typical properties (Median) generate around $869 per month, representing the average market performance.
- Entry-level properties (Bottom 25%) see earnings around $496, often with potential for optimization.
Average Monthly Airbnb Earnings Trend in Ubrique
Ubrique Airbnb Occupancy Rate Trends (2026)
Maximize your bookings by understanding the Ubrique STR occupancy trends. Seasonal demand shifts significantly influence how often properties are booked. Typically, Aprilsees the highest demand (peak season occupancy), while January experiences the lowest (low season). Effective strategies, like adjusting minimum stays or offering promotions, can boost occupancy during slower periods. Here's how different property tiers perform in Ubrique:
- Best-in-class properties (Top 10%) achieve 64%+ occupancy, indicating high desirability and potentially optimized availability.
- Strong performing properties (Top 25%) maintain 39% or higher occupancy, suggesting good market fit and guest satisfaction.
- Typical properties (Median) have an occupancy rate around 24%.
- Entry-level properties (Bottom 25%) average 13% occupancy, potentially facing higher vacancy.
Average Monthly Occupancy Rate Trend in Ubrique
Average Daily Rate (ADR) Airbnb Trends in Ubrique (2026)
Effective short term rental pricing strategy in Ubrique involves understanding monthly ADR fluctuations. The Average Daily Rate (ADR) for Airbnb in Ubrique typically peaks in December and dips lowest during March. Leveraging Airbnb dynamic pricing tools or strategies based on this seasonality can significantly boost revenue. Here's a look at the typical nightly rates achieved:
- Best-in-class properties (Top 10%) command rates of $312+ per night, often due to premium features or locations.
- Strong performing properties (Top 25%) achieve nightly rates of $150 or more.
- Typical properties (Median) charge around $107 per night.
- Entry-level properties (Bottom 25%) earn around $67 per night.
Average Daily Rate (ADR) Trend by Month in Ubrique
Get Live Ubrique Market Intelligence 👇

Explore Real-time Analytics
Airbnb Seasonality Analysis & Trends in Ubrique (2026)
Peak Season (December, April, May)
- Revenue averages $1,742 per month
- Occupancy rates average 34.9%
- Daily rates average $139
Shoulder Season
- Revenue averages $1,187 per month
- Occupancy maintains around 28.9%
- Daily rates hold near $139
Low Season (February, June, November)
- Revenue drops to average $919 per month
- Occupancy decreases to average 27.4%
- Daily rates adjust to average $137
Seasonality Insights for Ubrique
- The Airbnb seasonality in Ubrique shows highly seasonal trends requiring careful strategy. While the sections above show seasonal averages, it's also insightful to look at the extremes:
- During the high season, the absolute peak month showcases Ubrique's highest earning potential, with monthly revenues capable of climbing to $2,112, occupancy reaching a high of 44.3%, and ADRs peaking at $166.
- Conversely, the slowest single month of the year, typically falling within the low season, marks the market's lowest point. In this month, revenue might dip to $873, occupancy could drop to 21.9%, and ADRs may adjust down to $121.
- Understanding both the seasonal averages and these monthly peaks and troughs in revenue, occupancy, and ADR is crucial for maximizing your Airbnb profit potential in Ubrique.
Seasonal Strategies for Maximizing Profit
- Peak Season: Maximize revenue through premium pricing and potentially longer minimum stays. Ensure high availability.
- Low Season: Offer competitive pricing, special promotions (e.g., extended stay discounts), and flexible cancellation policies. Target off-season travelers like remote workers or budget-conscious guests.
- Shoulder Seasons: Implement dynamic pricing that balances peak and low rates. Target weekend travelers or specific events. Offer slightly more flexible terms than peak season.
- Regularly analyze your own performance against these Ubrique seasonality benchmarks and adjust your pricing and availability strategy accordingly.
Best Areas for Airbnb Investment in Ubrique (2026)
Exploring the top neighborhoods for short-term rentals in Ubrique? This section highlights key areas, outlining why they are attractive for hosts and guests, along with notable local attractions. Consider these locations based on your target guest profile and investment strategy.
| Neighborhood / Area | Why Host Here? (Target Guests & Appeal) | Key Attractions & Landmarks |
|---|---|---|
| Historic Center | The charming historic center of Ubrique is known for its beautiful architecture and traditional Andalusian atmosphere. It's a popular location for tourists interested in culture and history. | Plaza de España, Iglesia de Nuestra Señora de la O, Museo de la Piel, Calzada Romana, Calle Cañada |
| Sierra de Grazalema Natural Park | This stunning natural park is perfect for outdoor enthusiasts and nature lovers. It offers hiking, birdwatching, and breathtaking landscapes, attracting visitors looking for adventure and relaxation. | Sendero de los Pinsapos, Cueva de la Pileta, El Torreón Viewpoint, Zahara de la Sierra, Grazalema Village |
| Los Castaños | A picturesque area surrounded by chestnut trees, known for its tranquility and natural beauty. It's an ideal spot for guests seeking a peaceful retreat away from the hustle and bustle. | Chestnut Forests, Nature Trails, Local Honey Producers, Scenic Picnic Areas |
| Ubrique Leather Workshops | Ubrique is famous for its leather craftsmanship. Tourists often visit to see the workshops and purchase high-quality leather goods, making this area a hotspot for shopping and cultural experiences. | Leather Artisan Shops, Factory Tours, Leather Craft Workshops |
| Local Markets | The local markets in Ubrique are vibrant and full of Andalusian culture. Visitors are drawn to the markets for local produce, crafts, and culinary delights. | Mercado de Abastos, Local Food Stalls, Artisan Craft Markets |
| Roman Ruins of Ocuri | These ancient ruins offer a glimpse into the region's past and attract history lovers and archaeological enthusiasts looking to explore. | Archaeological Site, Museum of Ocuri, Historical Exhibits |
| Walking Trails | Ubrique is surrounded by beautiful landscapes and offers excellent walking and hiking trails, perfect for tourists seeking outdoor activities. | GR-7 Trail, Sendero de los Hielos, Local Flora and Fauna |
| Gastronomic Experiences | Ubrique is known for its delicious local cuisine, making it a great destination for food enthusiasts who want to explore Andalusian flavors. | Local Tapas Bars, Traditional Restaurants, Wine Tastings, Gourmet Food Tours |
Understanding Airbnb License Requirements & STR Laws in Ubrique (2026)
Yes, Ubrique, Andalusia, Spain enforces high STR regulations. Obtaining a license and ensuring compliance is almost certainly required according to current 2026 STR laws. Always verify the latest short term rental regulations and Airbnb license requirements directly with local government authorities for Ubrique to ensure full compliance before hosting.
(Source: AirROI data, 2026, based on 86% licensed listings)
Top Performing Airbnb Properties in Ubrique (2026)
Benchmark your potential! Explore examples of top-performing Airbnb properties in Ubriquebased on Trailing Twelve Month (TTM) revenue. Analyze their characteristics, revenue, occupancy rate, and ADR to understand what drives success in this market.
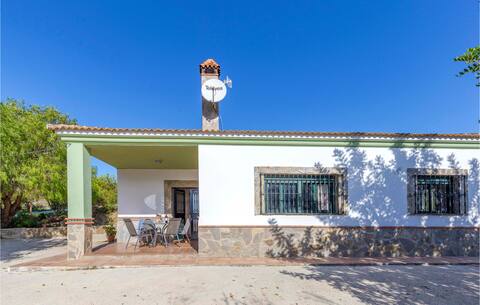
Stunning home in Ubrique with kitchen
Entire Place • 3 bedrooms

fresneda home andalucia
Entire Place • 4 bedrooms
Ubrique Loft Rural
Entire Place • 1 bedroom

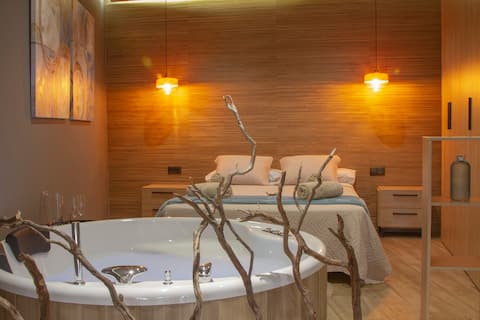
LOFT EDEN for unique and special moments
Entire Place • 1 bedroom

Casa La Fresneda, Ubrique by Ruralidays
Entire Place • 4 bedrooms

Cozy apartment in the center of Ubrique
Entire Place • 1 bedroom
Note: Performance varies based on location, size, amenities, seasonality, and management quality. Data reflects the past 12 months.
Top Performing Airbnb Hosts in Ubrique (2026)
Learn from the best! This table showcases top-performing Airbnb hosts in Ubrique based on the number of properties managed and estimated total revenue over the past year. Analyze their scale and performance metrics.
| Host Name | Properties | Grossing Revenue | Stay Reviews | Avg Rating |
|---|---|---|---|---|
| José Antonio | 4 | $49,444 | 49 | 4.88/5.0 |
| Novasol | 1 | $29,827 | 3 | 5.00/5.0 |
| Antonio | 1 | $28,371 | 1 | Not Rated |
| Maria Del Pilar | 1 | $16,590 | 215 | 4.90/5.0 |
| Ruralidays | 1 | $12,682 | 1 | Not Rated |
| Manuel | 1 | $12,452 | 62 | 4.94/5.0 |
| Sebastian | 2 | $11,008 | 47 | 4.75/5.0 |
| Novasol | 1 | $10,946 | 8 | 3.75/5.0 |
| Daniel | 1 | $10,381 | 4 | 5.00/5.0 |
| Bartolome | 1 | $8,633 | 17 | 4.88/5.0 |
Analyzing the strategies of top hosts, such as their property selection, pricing, and guest communication, can offer valuable lessons for optimizing your own Airbnb operations in Ubrique.
Dive Deeper: Advanced Ubrique STR Market Data (2026)
Ready to unlock more insights? AirROI provides access to advanced metrics and comprehensive Airbnb data for Ubrique. Explore detailed analytics beyond this report to refine your investment strategy, optimize pricing, and maximize your vacation rental profits.
Explore Advanced MetricsUbrique Short-Term Rental Market Composition (2026): Property & Room Types
Room Type Distribution
Property Type Distribution
Market Composition Insights for Ubrique
- The Ubrique Airbnb market composition is heavily skewed towards Entire Home/Apt listings, which make up 100% of the 21 active rentals. This indicates strong guest preference for privacy and space.
- Looking at the property type distribution in Ubrique, House properties are the most common (52.4%), reflecting the local real estate landscape.
- Houses represent a significant 52.4% portion, catering likely to families or larger groups.
Ubrique Airbnb Room Capacity Analysis (2026): Bedroom Distribution
Distribution of Listings by Number of Bedrooms
Room Capacity Insights for Ubrique
- The dominant room capacity in Ubrique is 1 bedroom listings, making up 66.7% of the market. This suggests a strong demand for properties suitable for couples or solo travelers.
- Together, 1 bedroom and 3 bedrooms properties represent 85.7% of the active Airbnb listings in Ubrique, indicating a high concentration in these sizes.
- With over half the market (66.7%) consisting of studios or 1-bedroom units, Ubrique is particularly well-suited for individuals or couples.
- A significant 33.3% of listings offer 3+ bedrooms, catering to larger groups and families seeking more space in Ubrique.
Ubrique Vacation Rental Guest Capacity Trends (2026)
Distribution of Listings by Guest Capacity
Guest Capacity Insights for Ubrique
- The most common guest capacity trend in Ubrique vacation rentals is listings accommodating 2 guests (47.6%). This suggests the primary traveler segment is likely couples or solo travelers.
- Properties designed for 2 guests and 8+ guests dominate the Ubrique STR market, accounting for 61.9% of listings.
- A significant 47.6% of listings cater specifically to 1-2 guests, highlighting strong demand from couples and solo travelers in Ubrique.
- 28.6% of properties accommodate 6+ guests, serving the market segment for larger families or group travel in Ubrique.
- On average, properties in Ubrique are equipped to host 3.8 guests.
Ubrique Airbnb Booking Patterns (2026): Available vs. Booked Days
Available Days Distribution
Booked Days Distribution
Booking Pattern Insights for Ubrique
- The most common availability pattern in Ubrique falls within the 271-366 days range, representing 71.4% of listings. This suggests many properties have significant open periods on their calendars.
- Approximately 100.0% of listings show high availability (181+ days open annually), indicating potential for increased bookings or specific owner usage patterns.
- For booked days, the 31-90 days range is most frequent in Ubrique (57.1%), reflecting common guest stay durations or potential owner blocking patterns.
Ubrique Airbnb Minimum Stay Requirements Analysis
Distribution of Listings by Minimum Night Requirement
1 Night
7 listings
33.3% of total
2 Nights
7 listings
33.3% of total
30+ Nights
7 listings
33.3% of total
Key Insights
- The most prevalent minimum stay requirement in Ubrique is 1 Night, adopted by 33.3% of listings. This highlights the market's preference for shorter, flexible bookings.
- A strong majority (66.6%) of the Ubrique Airbnb data shows acceptance of very short stays (1-2 nights), indicating a dynamic, high-turnover market.
- A significant segment (33.3%) caters to monthly stays (30+ nights) in Ubrique, pointing to opportunities in the extended-stay market.
Recommendations
- Align with the market by considering a 1 Night minimum stay, as 33.3% of Ubrique hosts use this setting.
- Explore offering discounts for stays of 30+ nights to attract the 33.3% of the market seeking extended stays.
- Adjust minimum nights based on seasonality – potentially shorter during low season and longer during peak demand periods in Ubrique.
Ubrique Airbnb Cancellation Policy Trends Analysis (2026)
Limited
1 listings
4.8% of total
Super Strict 60 Days
2 listings
9.5% of total
Flexible
5 listings
23.8% of total
Moderate
7 listings
33.3% of total
Firm
2 listings
9.5% of total
Strict
4 listings
19% of total
Cancellation Policy Insights for Ubrique
- The prevailing Airbnb cancellation policy trend in Ubrique is Moderate, used by 33.3% of listings.
- There's a relatively balanced mix between guest-friendly (57.1%) and stricter (28.5%) policies, offering choices for different guest needs.
Recommendations for Hosts
- Consider adopting a Moderate policy to align with the 33.3% market standard in Ubrique.
- Regularly review your cancellation policy against competitors and market demand shifts in Ubrique.
Ubrique STR Booking Lead Time Analysis (2026)
Average Booking Lead Time by Month
Booking Lead Time Insights for Ubrique
- The overall average booking lead time for vacation rentals in Ubrique is 42 days.
- Guests book furthest in advance for stays during September (average 68 days), likely coinciding with peak travel demand or local events.
- The shortest booking windows occur for stays in March (average 24 days), indicating more last-minute travel plans during this time.
- Seasonally, Fall (49 days avg.) sees the longest lead times, while Spring (29 days avg.) has the shortest, reflecting typical travel planning cycles.
Recommendations for Hosts
- Use the overall average lead time (42 days) as a baseline for your pricing and availability strategy in Ubrique.
- For September stays, consider implementing length-of-stay discounts or slightly higher rates for bookings made less than 68 days out to capitalize on advance planning.
- Target marketing efforts for the Fall season well in advance (at least 49 days) to capture early planners.
- Monitor your own booking lead times against these Ubrique averages to identify opportunities for dynamic pricing adjustments.
Popular & Essential Airbnb Amenities in Ubrique (2026)
Amenity Prevalence
Amenity Insights for Ubrique
- Essential amenities in Ubrique that guests expect include: TV, Kitchen. Lacking these (any) could significantly impact bookings.
- Popular amenities like Air conditioning, Wifi, Coffee maker are common but not universal. Offering these can provide a competitive edge.
- Warning: Wifi is not universally provided but is considered essential globally. Ensure reliable Wifi is offered.
Recommendations for Hosts
- Ensure your listing includes all essential amenities for Ubrique: TV, Kitchen.
- Prioritize adding missing essentials: TV, Kitchen.
- Consider adding popular differentiators like Air conditioning or Wifi to increase appeal.
- Highlight unique or less common amenities you offer (e.g., hot tub, dedicated workspace, EV charger) in your listing description and photos.
- Regularly check competitor amenities in Ubrique to stay competitive.
Ubrique Airbnb Guest Demographics & Profile Analysis (2026)
Guest Profile Summary for Ubrique
- The typical guest profile for Airbnb in Ubrique consists of a mix of domestic (60%) and international guests, often arriving from nearby Seville, typically belonging to the Post-2000s (Gen Z/Alpha) group (50%), primarily speaking Spanish or English.
- Domestic travelers account for 60.4% of guests.
- Key international markets include Spain (60.4%) and Netherlands (8.3%).
- Top languages spoken are Spanish (39.3%) followed by English (30.4%).
- A significant demographic segment is the Post-2000s (Gen Z/Alpha) group, representing 50% of guests.
Recommendations for Hosts
- Target domestic marketing efforts towards travelers from Seville and Zahara de la Sierra.
- Tailor amenities and listing descriptions to appeal to the dominant Post-2000s (Gen Z/Alpha) demographic (e.g., highlight fast WiFi, smart home features, local guides).
- Highlight unique local experiences or amenities relevant to the primary guest profile.
- Consider seasonal promotions aligned with peak travel times for key origin markets.
Nearby Short-Term Rental Market Comparison
How does the Ubrique Airbnb market stack up against its neighbors? Compare key performance metrics like average monthly revenue, ADR, and occupancy rates in surrounding areas to understand the broader regional STR landscape.
| Market | Active Properties | Monthly Revenue | Daily Rate | Avg. Occupancy |
|---|---|---|---|---|
| Cártama | 48 | $4,137 | $378.39 | 45% |
| Alhaurín de la Torre | 210 | $3,716 | $325.91 | 46% |
| Alhaurín el Grande | 271 | $3,613 | $310.22 | 46% |
| Casarabonela | 24 | $3,495 | $286.94 | 39% |
| Gelves | 26 | $2,989 | $190.74 | 54% |
| Benahavís | 518 | $2,914 | $430.92 | 39% |
| Marbella | 5,279 | $2,756 | $342.36 | 42% |
| El Paraíso | 13 | $2,679 | $369.93 | 45% |
| Villanueva del Rosario | 12 | $2,590 | $310.50 | 35% |
| Guillena | 35 | $2,502 | $256.76 | 38% |