Utrera Airbnb Market Analysis 2026: Short Term Rental Data & Vacation Rental Statistics in Andalusia, Spain
Is Airbnb profitable in Utrera in 2026? Explore comprehensive Airbnb analytics for Utrera, Andalusia, Spain to uncover income potential. This 2026 STR market report for Utrera, based on AirROI data from February 2025 to January 2026, reveals key trends in the niche market of 30 active listings.
Whether you're considering an Airbnb investment in Utrera, optimizing your existing vacation rental, or exploring rental arbitrage opportunities, understanding the Utrera Airbnb data is crucial. Navigating the high regulation landscape is key to maximizing your short term rental income potential. Let's dive into the specifics.
Key Utrera Airbnb Performance Metrics Overview
Monthly Airbnb Revenue Variations & Income Potential in Utrera (2026)
Understanding the monthly revenue variations for Airbnb listings in Utrera is key to maximizing your short term rental income potential. Seasonality significantly impacts earnings. Our analysis, based on data from the past 12 months, shows that the peak revenue month for STRs in Utrera is typically May, while January often presents the lowest earnings, highlighting opportunities for strategic pricing adjustments during shoulder and low seasons. Explore the typical Airbnb income in Utrera across different performance tiers:
- Best-in-class properties (Top 10%) achieve $3,804+ monthly, often utilizing dynamic pricing and superior guest experiences.
- Strong performing properties (Top 25%) earn $1,934 or more, indicating effective management and desirable locations/amenities.
- Typical properties (Median) generate around $1,066 per month, representing the average market performance.
- Entry-level properties (Bottom 25%) see earnings around $473, often with potential for optimization.
Average Monthly Airbnb Earnings Trend in Utrera
Utrera Airbnb Occupancy Rate Trends (2026)
Maximize your bookings by understanding the Utrera STR occupancy trends. Seasonal demand shifts significantly influence how often properties are booked. Typically, Aprilsees the highest demand (peak season occupancy), while January experiences the lowest (low season). Effective strategies, like adjusting minimum stays or offering promotions, can boost occupancy during slower periods. Here's how different property tiers perform in Utrera:
- Best-in-class properties (Top 10%) achieve 73%+ occupancy, indicating high desirability and potentially optimized availability.
- Strong performing properties (Top 25%) maintain 55% or higher occupancy, suggesting good market fit and guest satisfaction.
- Typical properties (Median) have an occupancy rate around 31%.
- Entry-level properties (Bottom 25%) average 15% occupancy, potentially facing higher vacancy.
Average Monthly Occupancy Rate Trend in Utrera
Average Daily Rate (ADR) Airbnb Trends in Utrera (2026)
Effective short term rental pricing strategy in Utrera involves understanding monthly ADR fluctuations. The Average Daily Rate (ADR) for Airbnb in Utrera typically peaks in July and dips lowest during November. Leveraging Airbnb dynamic pricing tools or strategies based on this seasonality can significantly boost revenue. Here's a look at the typical nightly rates achieved:
- Best-in-class properties (Top 10%) command rates of $408+ per night, often due to premium features or locations.
- Strong performing properties (Top 25%) achieve nightly rates of $187 or more.
- Typical properties (Median) charge around $106 per night.
- Entry-level properties (Bottom 25%) earn around $77 per night.
Average Daily Rate (ADR) Trend by Month in Utrera
Get Live Utrera Market Intelligence 👇

Explore Real-time Analytics
Airbnb Seasonality Analysis & Trends in Utrera (2026)
Peak Season (May, April, August)
- Revenue averages $2,142 per month
- Occupancy rates average 47.6%
- Daily rates average $211
Shoulder Season
- Revenue averages $1,566 per month
- Occupancy maintains around 37.0%
- Daily rates hold near $194
Low Season (January, November, December)
- Revenue drops to average $981 per month
- Occupancy decreases to average 26.6%
- Daily rates adjust to average $152
Seasonality Insights for Utrera
- The Airbnb seasonality in Utrera shows highly seasonal trends requiring careful strategy. While the sections above show seasonal averages, it's also insightful to look at the extremes:
- During the high season, the absolute peak month showcases Utrera's highest earning potential, with monthly revenues capable of climbing to $2,269, occupancy reaching a high of 53.0%, and ADRs peaking at $216.
- Conversely, the slowest single month of the year, typically falling within the low season, marks the market's lowest point. In this month, revenue might dip to $836, occupancy could drop to 23.7%, and ADRs may adjust down to $150.
- Understanding both the seasonal averages and these monthly peaks and troughs in revenue, occupancy, and ADR is crucial for maximizing your Airbnb profit potential in Utrera.
Seasonal Strategies for Maximizing Profit
- Peak Season: Maximize revenue through premium pricing and potentially longer minimum stays. Ensure high availability.
- Low Season: Offer competitive pricing, special promotions (e.g., extended stay discounts), and flexible cancellation policies. Target off-season travelers like remote workers or budget-conscious guests.
- Shoulder Seasons: Implement dynamic pricing that balances peak and low rates. Target weekend travelers or specific events. Offer slightly more flexible terms than peak season.
- Regularly analyze your own performance against these Utrera seasonality benchmarks and adjust your pricing and availability strategy accordingly.
Best Areas for Airbnb Investment in Utrera (2026)
Exploring the top neighborhoods for short-term rentals in Utrera? This section highlights key areas, outlining why they are attractive for hosts and guests, along with notable local attractions. Consider these locations based on your target guest profile and investment strategy.
| Neighborhood / Area | Why Host Here? (Target Guests & Appeal) | Key Attractions & Landmarks |
|---|---|---|
| Centro Histórico | The historic center of Utrera features charming streets, traditional Andalusian architecture, and rich history. It's a prime spot for tourists interested in local culture and history with easy access to local restaurants and shops. | Castillo de Utrera, Iglesia de Santiago, Plaza de la Constitución, Museo de Utrera, Parque de Consolación |
| Los Molinos | This residential area is popular among families and offers a peaceful atmosphere. Its proximity to parks and nature makes it appealing for families and those seeking tranquility. | Parque de los Molinos, Cerro de Utrera, nature walks, local shops |
| El Palacio | This area is known for its beautiful palatial houses and quiet streets. An ideal location for those who appreciate a calmer setting while still being close to the city center. | Palacio de los Marqueses de Utrera, historic buildings, local cafes |
| San Juan Bosco | A vibrant neighborhood known for its community feel and local markets. It attracts those looking for an authentic Andalusian experience away from the more touristy areas. | Mercado de Abastos, Local festivals, churches |
| La Paz | La Paz is a growing area with ample amenities and attractions. It is attractive to visitors looking for modern conveniences with a touch of traditional Andalusian culture. | Centros comerciales, Playparks, local amenities |
| Torreblanca | This suburban area offers a mix of local culture and modern living. It's suitable for tourists wanting a quieter getaway yet still close to the city's attractions. | Alluvial parks, Walks along the river, Community events |
| Las Setas | Las Setas is known for its striking architecture and local nightlife. It attracts a younger crowd looking for entertainment and social activities. | Cultural festivals, Nightclubs, restaurants |
| Polígono Industrial | The industrial park is not just for business; it attracts workers and visitors looking for affordable accommodations close to employment hubs, great for budget travelers. | business districts, warehouses turned into attractions, local eateries |
Understanding Airbnb License Requirements & STR Laws in Utrera (2026)
Yes, Utrera, Andalusia, Spain enforces high STR regulations. Obtaining a license and ensuring compliance is almost certainly required according to current 2026 STR laws. Always verify the latest short term rental regulations and Airbnb license requirements directly with local government authorities for Utrera to ensure full compliance before hosting.
(Source: AirROI data, 2026, based on 77% licensed listings)
Top Performing Airbnb Properties in Utrera (2026)
Benchmark your potential! Explore examples of top-performing Airbnb properties in Utrerabased on Trailing Twelve Month (TTM) revenue. Analyze their characteristics, revenue, occupancy rate, and ADR to understand what drives success in this market.
La Palmera Rustic Estate
Entire Place • 4 bedrooms

Finca Doña Juana
Entire Place • 4 bedrooms
Your place to celebrate life
Entire Place • 5 bedrooms
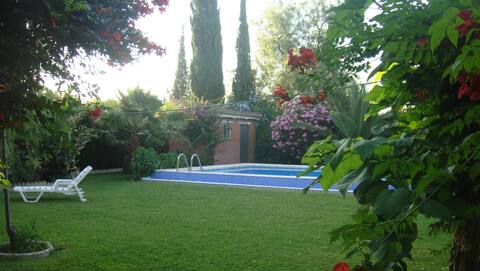
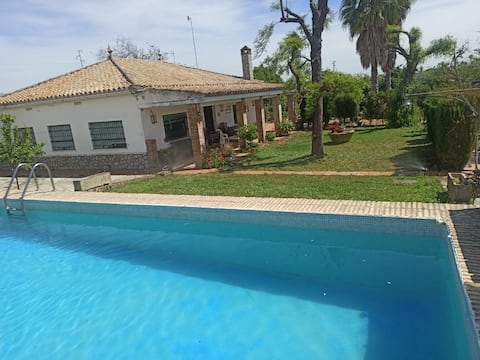
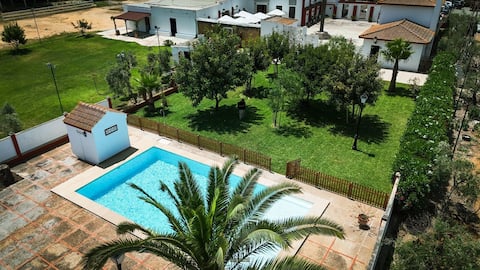
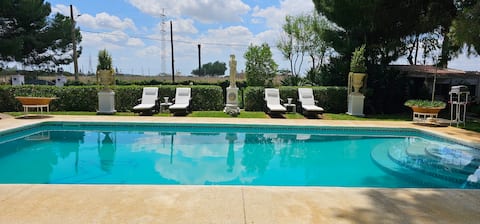
A villa near Seville, with a garden and private pool
Entire Place • 4 bedrooms
La Casita Navasola
Entire Place • 1 bedroom

Very bright apartment in a downtown area
Entire Place • 2 bedrooms
Note: Performance varies based on location, size, amenities, seasonality, and management quality. Data reflects the past 12 months.
Top Performing Airbnb Hosts in Utrera (2026)
Learn from the best! This table showcases top-performing Airbnb hosts in Utrera based on the number of properties managed and estimated total revenue over the past year. Analyze their scale and performance metrics.
| Host Name | Properties | Grossing Revenue | Stay Reviews | Avg Rating |
|---|---|---|---|---|
| Jesús García Gallego | 4 | $60,361 | 83 | 4.70/5.0 |
| José Manuel | 1 | $55,569 | 14 | 4.86/5.0 |
| Jesus | 1 | $49,687 | 104 | 4.87/5.0 |
| Manuel | 1 | $43,602 | 3 | 5.00/5.0 |
| Valentina | 1 | $29,651 | 9 | 4.89/5.0 |
| Charo | 4 | $25,095 | 30 | 4.53/5.0 |
| César | 1 | $22,656 | 192 | 4.78/5.0 |
| Ana | 1 | $21,665 | 72 | 4.92/5.0 |
| Conso | 1 | $18,776 | 52 | 4.92/5.0 |
| Jesús | 1 | $14,993 | 11 | 4.82/5.0 |
Analyzing the strategies of top hosts, such as their property selection, pricing, and guest communication, can offer valuable lessons for optimizing your own Airbnb operations in Utrera.
Dive Deeper: Advanced Utrera STR Market Data (2026)
Ready to unlock more insights? AirROI provides access to advanced metrics and comprehensive Airbnb data for Utrera. Explore detailed analytics beyond this report to refine your investment strategy, optimize pricing, and maximize your vacation rental profits.
Explore Advanced MetricsUtrera Short-Term Rental Market Composition (2026): Property & Room Types
Room Type Distribution
Property Type Distribution
Market Composition Insights for Utrera
- The Utrera Airbnb market composition is heavily skewed towards Entire Home/Apt listings, which make up 70% of the 30 active rentals. This indicates strong guest preference for privacy and space.
- Looking at the property type distribution in Utrera, House properties are the most common (40%), reflecting the local real estate landscape.
- Houses represent a significant 40% portion, catering likely to families or larger groups.
- The presence of 16.7% Hotel/Boutique listings indicates integration with traditional hospitality.
Utrera Airbnb Room Capacity Analysis (2026): Bedroom Distribution
Distribution of Listings by Number of Bedrooms
Room Capacity Insights for Utrera
- The dominant room capacity in Utrera is 1 bedroom listings, making up 43.3% of the market. This suggests a strong demand for properties suitable for couples or solo travelers.
- Together, 1 bedroom and 2 bedrooms properties represent 70.0% of the active Airbnb listings in Utrera, indicating a high concentration in these sizes.
- A significant 23.4% of listings offer 3+ bedrooms, catering to larger groups and families seeking more space in Utrera.
Utrera Vacation Rental Guest Capacity Trends (2026)
Distribution of Listings by Guest Capacity
Guest Capacity Insights for Utrera
- The most common guest capacity trend in Utrera vacation rentals is listings accommodating 8+ guests (26.7%). This suggests the primary traveler segment is likely larger groups.
- Properties designed for 8+ guests and 4 guests dominate the Utrera STR market, accounting for 50.0% of listings.
- 30.0% of properties accommodate 6+ guests, serving the market segment for larger families or group travel in Utrera.
- On average, properties in Utrera are equipped to host 4.2 guests.
Utrera Airbnb Booking Patterns (2026): Available vs. Booked Days
Available Days Distribution
Booked Days Distribution
Booking Pattern Insights for Utrera
- The most common availability pattern in Utrera falls within the 271-366 days range, representing 60% of listings. This suggests many properties have significant open periods on their calendars.
- Approximately 80.0% of listings show high availability (181+ days open annually), indicating potential for increased bookings or specific owner usage patterns.
- For booked days, the 31-90 days range is most frequent in Utrera (33.3%), reflecting common guest stay durations or potential owner blocking patterns.
- A notable 20.0% of properties secure long booking periods (181+ days booked per year), highlighting successful long-term rental strategies or significant owner usage.
Utrera Airbnb Minimum Stay Requirements Analysis
Distribution of Listings by Minimum Night Requirement
1 Night
11 listings
36.7% of total
2 Nights
6 listings
20% of total
3 Nights
3 listings
10% of total
4-6 Nights
1 listings
3.3% of total
30+ Nights
9 listings
30% of total
Key Insights
- The most prevalent minimum stay requirement in Utrera is 1 Night, adopted by 36.7% of listings. This highlights the market's preference for shorter, flexible bookings.
- A significant segment (30%) caters to monthly stays (30+ nights) in Utrera, pointing to opportunities in the extended-stay market.
Recommendations
- Align with the market by considering a 1 Night minimum stay, as 36.7% of Utrera hosts use this setting.
- Explore offering discounts for stays of 30+ nights to attract the 30% of the market seeking extended stays.
- Adjust minimum nights based on seasonality – potentially shorter during low season and longer during peak demand periods in Utrera.
Utrera Airbnb Cancellation Policy Trends Analysis (2026)
Limited
1 listings
3.3% of total
Flexible
9 listings
30% of total
Moderate
11 listings
36.7% of total
Firm
8 listings
26.7% of total
Strict
1 listings
3.3% of total
Cancellation Policy Insights for Utrera
- The prevailing Airbnb cancellation policy trend in Utrera is Moderate, used by 36.7% of listings.
- There's a relatively balanced mix between guest-friendly (66.7%) and stricter (30.0%) policies, offering choices for different guest needs.
- Strict cancellation policies are quite rare (3.3%), potentially making listings with this policy less competitive unless justified by high demand or property type.
Recommendations for Hosts
- Consider adopting a Moderate policy to align with the 36.7% market standard in Utrera.
- Using a Strict policy might deter some guests, as only 3.3% of listings use it. Evaluate if potential revenue protection outweighs possible lower booking rates.
- Regularly review your cancellation policy against competitors and market demand shifts in Utrera.
Utrera STR Booking Lead Time Analysis (2026)
Average Booking Lead Time by Month
Booking Lead Time Insights for Utrera
- The overall average booking lead time for vacation rentals in Utrera is 50 days.
- Guests book furthest in advance for stays during September (average 77 days), likely coinciding with peak travel demand or local events.
- The shortest booking windows occur for stays in January (average 21 days), indicating more last-minute travel plans during this time.
- Seasonally, Fall (66 days avg.) sees the longest lead times, while Winter (34 days avg.) has the shortest, reflecting typical travel planning cycles.
Recommendations for Hosts
- Use the overall average lead time (50 days) as a baseline for your pricing and availability strategy in Utrera.
- For September stays, consider implementing length-of-stay discounts or slightly higher rates for bookings made less than 77 days out to capitalize on advance planning.
- Target marketing efforts for the Fall season well in advance (at least 66 days) to capture early planners.
- Monitor your own booking lead times against these Utrera averages to identify opportunities for dynamic pricing adjustments.
Popular & Essential Airbnb Amenities in Utrera (2026)
Amenity Prevalence
Amenity Insights for Utrera
- Essential amenities in Utrera that guests expect include: TV, Wifi. Lacking these (any) could significantly impact bookings.
- Popular amenities like Air conditioning, Kitchen, Hangers are common but not universal. Offering these can provide a competitive edge.
Recommendations for Hosts
- Ensure your listing includes all essential amenities for Utrera: TV, Wifi.
- Prioritize adding missing essentials: Wifi.
- Consider adding popular differentiators like Air conditioning or Kitchen to increase appeal.
- Highlight unique or less common amenities you offer (e.g., hot tub, dedicated workspace, EV charger) in your listing description and photos.
- Regularly check competitor amenities in Utrera to stay competitive.
Utrera Airbnb Guest Demographics & Profile Analysis (2026)
Guest Profile Summary for Utrera
- The typical guest profile for Airbnb in Utrera consists of predominantly international visitors (70%), with top international origins including France, typically belonging to the Post-2000s (Gen Z/Alpha) group (50%), primarily speaking English or Spanish.
- Domestic travelers account for 30.2% of guests.
- Key international markets include Spain (30.2%) and France (26%).
- Top languages spoken are English (33.1%) followed by Spanish (18.6%).
- A significant demographic segment is the Post-2000s (Gen Z/Alpha) group, representing 50% of guests.
Recommendations for Hosts
- Focus marketing internationally, particularly towards travelers from France.
- Tailor amenities and listing descriptions to appeal to the dominant Post-2000s (Gen Z/Alpha) demographic (e.g., highlight fast WiFi, smart home features, local guides).
- Highlight unique local experiences or amenities relevant to the primary guest profile.
- Consider seasonal promotions aligned with peak travel times for key origin markets.
Nearby Short-Term Rental Market Comparison
How does the Utrera Airbnb market stack up against its neighbors? Compare key performance metrics like average monthly revenue, ADR, and occupancy rates in surrounding areas to understand the broader regional STR landscape.
| Market | Active Properties | Monthly Revenue | Daily Rate | Avg. Occupancy |
|---|---|---|---|---|
| Cártama | 48 | $4,137 | $378.39 | 45% |
| Alhaurín de la Torre | 210 | $3,716 | $325.91 | 46% |
| Alhaurín el Grande | 271 | $3,613 | $310.22 | 46% |
| Casarabonela | 24 | $3,495 | $286.94 | 39% |
| Monesterio | 17 | $3,001 | $260.35 | 36% |
| Gelves | 26 | $2,989 | $190.74 | 54% |
| Benahavís | 518 | $2,914 | $430.92 | 39% |
| Marbella | 5,279 | $2,756 | $342.36 | 42% |
| El Paraíso | 13 | $2,679 | $369.93 | 45% |
| Villanueva del Rosario | 12 | $2,590 | $310.50 | 35% |