Yunquera Airbnb Market Analysis 2026: Short Term Rental Data & Vacation Rental Statistics in Andalusia, Spain
Is Airbnb profitable in Yunquera in 2026? Explore comprehensive Airbnb analytics for Yunquera, Andalusia, Spain to uncover income potential. This 2026 STR market report for Yunquera, based on AirROI data from February 2025 to January 2026, reveals key trends in the niche market of 22 active listings.
Whether you're considering an Airbnb investment in Yunquera, optimizing your existing vacation rental, or exploring rental arbitrage opportunities, understanding the Yunquera Airbnb data is crucial. Navigating the high regulation landscape is key to maximizing your short term rental income potential. Let's dive into the specifics.
Key Yunquera Airbnb Performance Metrics Overview
Monthly Airbnb Revenue Variations & Income Potential in Yunquera (2026)
Understanding the monthly revenue variations for Airbnb listings in Yunquera is key to maximizing your short term rental income potential. Seasonality significantly impacts earnings. Our analysis, based on data from the past 12 months, shows that the peak revenue month for STRs in Yunquera is typically July, while January often presents the lowest earnings, highlighting opportunities for strategic pricing adjustments during shoulder and low seasons. Explore the typical Airbnb income in Yunquera across different performance tiers:
- Best-in-class properties (Top 10%) achieve $2,694+ monthly, often utilizing dynamic pricing and superior guest experiences.
- Strong performing properties (Top 25%) earn $1,703 or more, indicating effective management and desirable locations/amenities.
- Typical properties (Median) generate around $931 per month, representing the average market performance.
- Entry-level properties (Bottom 25%) see earnings around $449, often with potential for optimization.
Average Monthly Airbnb Earnings Trend in Yunquera
Yunquera Airbnb Occupancy Rate Trends (2026)
Maximize your bookings by understanding the Yunquera STR occupancy trends. Seasonal demand shifts significantly influence how often properties are booked. Typically, Julysees the highest demand (peak season occupancy), while January experiences the lowest (low season). Effective strategies, like adjusting minimum stays or offering promotions, can boost occupancy during slower periods. Here's how different property tiers perform in Yunquera:
- Best-in-class properties (Top 10%) achieve 71%+ occupancy, indicating high desirability and potentially optimized availability.
- Strong performing properties (Top 25%) maintain 51% or higher occupancy, suggesting good market fit and guest satisfaction.
- Typical properties (Median) have an occupancy rate around 27%.
- Entry-level properties (Bottom 25%) average 13% occupancy, potentially facing higher vacancy.
Average Monthly Occupancy Rate Trend in Yunquera
Average Daily Rate (ADR) Airbnb Trends in Yunquera (2026)
Effective short term rental pricing strategy in Yunquera involves understanding monthly ADR fluctuations. The Average Daily Rate (ADR) for Airbnb in Yunquera typically peaks in July and dips lowest during November. Leveraging Airbnb dynamic pricing tools or strategies based on this seasonality can significantly boost revenue. Here's a look at the typical nightly rates achieved:
- Best-in-class properties (Top 10%) command rates of $225+ per night, often due to premium features or locations.
- Strong performing properties (Top 25%) achieve nightly rates of $170 or more.
- Typical properties (Median) charge around $102 per night.
- Entry-level properties (Bottom 25%) earn around $78 per night.
Average Daily Rate (ADR) Trend by Month in Yunquera
Get Live Yunquera Market Intelligence 👇

Explore Real-time Analytics
Airbnb Seasonality Analysis & Trends in Yunquera (2026)
Peak Season (July, August, September)
- Revenue averages $2,184 per month
- Occupancy rates average 49.1%
- Daily rates average $162
Shoulder Season
- Revenue averages $1,001 per month
- Occupancy maintains around 32.8%
- Daily rates hold near $144
Low Season (January, November, December)
- Revenue drops to average $656 per month
- Occupancy decreases to average 20.4%
- Daily rates adjust to average $142
Seasonality Insights for Yunquera
- The Airbnb seasonality in Yunquera shows highly seasonal trends requiring careful strategy. While the sections above show seasonal averages, it's also insightful to look at the extremes:
- During the high season, the absolute peak month showcases Yunquera's highest earning potential, with monthly revenues capable of climbing to $2,515, occupancy reaching a high of 54.1%, and ADRs peaking at $163.
- Conversely, the slowest single month of the year, typically falling within the low season, marks the market's lowest point. In this month, revenue might dip to $533, occupancy could drop to 17.2%, and ADRs may adjust down to $136.
- Understanding both the seasonal averages and these monthly peaks and troughs in revenue, occupancy, and ADR is crucial for maximizing your Airbnb profit potential in Yunquera.
Seasonal Strategies for Maximizing Profit
- Peak Season: Maximize revenue through premium pricing and potentially longer minimum stays. Ensure high availability.
- Low Season: Offer competitive pricing, special promotions (e.g., extended stay discounts), and flexible cancellation policies. Target off-season travelers like remote workers or budget-conscious guests.
- Shoulder Seasons: Implement dynamic pricing that balances peak and low rates. Target weekend travelers or specific events. Offer slightly more flexible terms than peak season.
- Regularly analyze your own performance against these Yunquera seasonality benchmarks and adjust your pricing and availability strategy accordingly.
Best Areas for Airbnb Investment in Yunquera (2026)
Exploring the top neighborhoods for short-term rentals in Yunquera? This section highlights key areas, outlining why they are attractive for hosts and guests, along with notable local attractions. Consider these locations based on your target guest profile and investment strategy.
| Neighborhood / Area | Why Host Here? (Target Guests & Appeal) | Key Attractions & Landmarks |
|---|---|---|
| Yunquera Town Center | Charming town center with traditional Andalusian architecture. Attracts visitors looking to experience local history, culture, and cuisine, particularly during the festive seasons. | Plaza de la Constitución, Iglesia de Nuestra Señora de la Encarnación, Caminito del Rey trails, local tapas bars, community festivals |
| Sierra de las Nieves Natural Park | A stunning natural park offering breathtaking views and outdoor activities. Ideal for nature lovers, hikers, and those seeking tranquility away from city life. | Hiking trails, birdwatching, picnic areas, natural pools, mountain scenery |
| Cerro de los Remedios | A picturesque area known for its panoramic views and serene environment. Popular among tourists looking for a peaceful getaway with beautiful natural landscapes. | Viewpoint lookout, natural hiking trails, traditional rural architecture, stargazing opportunities, local wildlife |
| Nearby Villages (Guaro, Monda) | Charming neighboring villages that offer authentic Andalusian experiences. Great for guests interested in exploring small towns and rural tourism. | Village festivals, local museums, artisan shops, traditional markets, hiking routes |
| El Chorro | Famous for the El Caminito del Rey walkway, drawing adventure-seekers and tourists alike. A must-visit for those who love thrilling outdoor experiences. | Caminito del Rey, El Chorro Gorge, rock climbing, sightseeing, local dining options |
| Ronda | A historic city known for its stunning cliffside location and deep cultural heritage. Attracts a wide range of tourists, from history buffs to romantic getaways. | Puente Nuevo, Plaza de Toros, Palacio de Mondragón, Banos Arabes, local wineries |
| Granada (easy access) | Major city with rich Moorish history and culture, known for Alhambra. Popular weekend destination for tourists staying in nearby Yunquera. | Alhambra, Generalife Gardens, Albaicín, Granada Cathedral, tapas scene |
| Coastal Areas (Marbella, Nerja) | Close proximity to luxurious coastal destinations. Attracts beach-goers, shoppers, and sun-seekers, enhancing the appeal of rural accommodation in Yunquera. | Beaches of Marbella, Nerja Caves, Puerto Banús, each clubs, Marbella Old Town |
Understanding Airbnb License Requirements & STR Laws in Yunquera (2026)
Yes, Yunquera, Andalusia, Spain enforces high STR regulations. Obtaining a license and ensuring compliance is almost certainly required according to current 2026 STR laws. Always verify the latest short term rental regulations and Airbnb license requirements directly with local government authorities for Yunquera to ensure full compliance before hosting.
(Source: AirROI data, 2026, based on 82% licensed listings)
Top Performing Airbnb Properties in Yunquera (2026)
Benchmark your potential! Explore examples of top-performing Airbnb properties in Yunquerabased on Trailing Twelve Month (TTM) revenue. Analyze their characteristics, revenue, occupancy rate, and ADR to understand what drives success in this market.

The House of Los Cipreses.
Entire Place • 3 bedrooms
Cube's Casa Mi Recreo High Privacy
Entire Place • 2 bedrooms
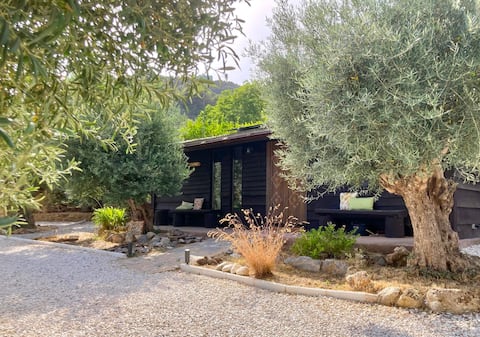
La Cabaña
Entire Place • 3 bedrooms
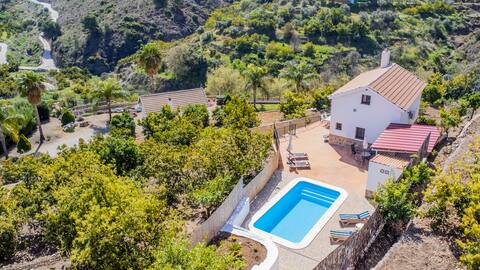
Villa El Pedregal - Sierra de las Nieves Park
Entire Place • 2 bedrooms

Hansel & Gretel House
Entire Place • 1 bedroom

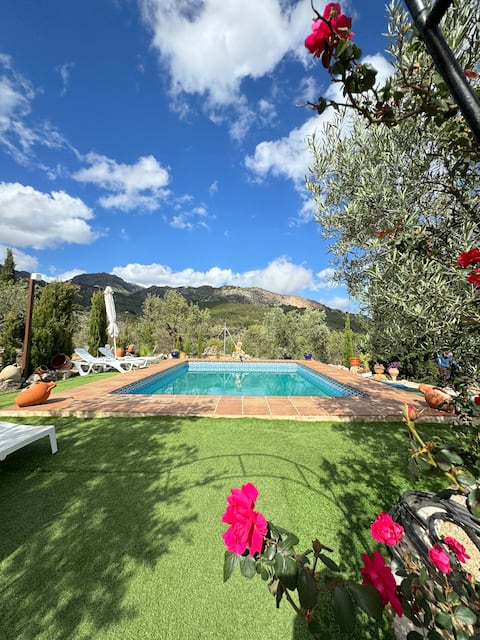
Fantastic Views of Sunny Valleys
Entire Place • 3 bedrooms
Note: Performance varies based on location, size, amenities, seasonality, and management quality. Data reflects the past 12 months.
Top Performing Airbnb Hosts in Yunquera (2026)
Learn from the best! This table showcases top-performing Airbnb hosts in Yunquera based on the number of properties managed and estimated total revenue over the past year. Analyze their scale and performance metrics.
| Host Name | Properties | Grossing Revenue | Stay Reviews | Avg Rating |
|---|---|---|---|---|
| Britt & Kees | 2 | $40,884 | 15 | 4.83/5.0 |
| Maria Jose | 1 | $29,288 | 65 | 4.92/5.0 |
| Cubos Holiday Homes | 1 | $28,148 | 14 | 4.93/5.0 |
| Maria | 1 | $24,652 | 22 | 4.73/5.0 |
| Dawn | 1 | $15,314 | 72 | 4.93/5.0 |
| Dag | 1 | $14,972 | 89 | 4.87/5.0 |
| Jose Francisco | 2 | $11,271 | 107 | 4.42/5.0 |
| Jubelina | 1 | $10,503 | 34 | 4.91/5.0 |
| Ruralidays | 1 | $8,470 | 4 | 5.00/5.0 |
| Adriana | 1 | $7,720 | 7 | 4.86/5.0 |
Analyzing the strategies of top hosts, such as their property selection, pricing, and guest communication, can offer valuable lessons for optimizing your own Airbnb operations in Yunquera.
Dive Deeper: Advanced Yunquera STR Market Data (2026)
Ready to unlock more insights? AirROI provides access to advanced metrics and comprehensive Airbnb data for Yunquera. Explore detailed analytics beyond this report to refine your investment strategy, optimize pricing, and maximize your vacation rental profits.
Explore Advanced MetricsYunquera Short-Term Rental Market Composition (2026): Property & Room Types
Room Type Distribution
Property Type Distribution
Market Composition Insights for Yunquera
- The Yunquera Airbnb market composition is heavily skewed towards Entire Home/Apt listings, which make up 100% of the 22 active rentals. This indicates strong guest preference for privacy and space.
- Looking at the property type distribution in Yunquera, House properties are the most common (86.4%), reflecting the local real estate landscape.
- Houses represent a significant 86.4% portion, catering likely to families or larger groups.
- Smaller segments like apartment/condo, hotel/boutique, outdoor/unique (combined 13.5%) offer potential for unique stay experiences.
Yunquera Airbnb Room Capacity Analysis (2026): Bedroom Distribution
Distribution of Listings by Number of Bedrooms
Room Capacity Insights for Yunquera
- The dominant room capacity in Yunquera is 3 bedrooms listings, making up 31.8% of the market. This suggests a strong demand for properties suitable for families or small groups.
- Together, 3 bedrooms and 2 bedrooms properties represent 54.5% of the active Airbnb listings in Yunquera, indicating a high concentration in these sizes.
- A significant 54.5% of listings offer 3+ bedrooms, catering to larger groups and families seeking more space in Yunquera.
Yunquera Vacation Rental Guest Capacity Trends (2026)
Distribution of Listings by Guest Capacity
Guest Capacity Insights for Yunquera
- The most common guest capacity trend in Yunquera vacation rentals is listings accommodating 6 guests (40.9%). This suggests the primary traveler segment is likely larger groups.
- Properties designed for 6 guests and 8+ guests dominate the Yunquera STR market, accounting for 63.6% of listings.
- 68.1% of properties accommodate 6+ guests, serving the market segment for larger families or group travel in Yunquera.
- On average, properties in Yunquera are equipped to host 5.5 guests.
Yunquera Airbnb Booking Patterns (2026): Available vs. Booked Days
Available Days Distribution
Booked Days Distribution
Booking Pattern Insights for Yunquera
- The most common availability pattern in Yunquera falls within the 271-366 days range, representing 59.1% of listings. This suggests many properties have significant open periods on their calendars.
- Approximately 77.3% of listings show high availability (181+ days open annually), indicating potential for increased bookings or specific owner usage patterns.
- For booked days, the 31-90 days range is most frequent in Yunquera (45.5%), reflecting common guest stay durations or potential owner blocking patterns.
- A notable 22.7% of properties secure long booking periods (181+ days booked per year), highlighting successful long-term rental strategies or significant owner usage.
Yunquera Airbnb Minimum Stay Requirements Analysis
Distribution of Listings by Minimum Night Requirement
1 Night
1 listings
4.5% of total
2 Nights
9 listings
40.9% of total
3 Nights
3 listings
13.6% of total
4-6 Nights
2 listings
9.1% of total
7-29 Nights
1 listings
4.5% of total
30+ Nights
6 listings
27.3% of total
Key Insights
- The most prevalent minimum stay requirement in Yunquera is 2 Nights, adopted by 40.9% of listings. This highlights the market's preference for shorter, flexible bookings.
- A significant segment (27.3%) caters to monthly stays (30+ nights) in Yunquera, pointing to opportunities in the extended-stay market.
Recommendations
- Align with the market by considering a 2 Nights minimum stay, as 40.9% of Yunquera hosts use this setting.
- If feasible, allowing 1-night stays, especially midweek or during low season, could capture last-minute bookings, as only 4.5% currently do.
- A 2-night minimum appears standard (40.9%). Consider this for weekends or peak periods.
- Explore offering discounts for stays of 30+ nights to attract the 27.3% of the market seeking extended stays.
- Adjust minimum nights based on seasonality – potentially shorter during low season and longer during peak demand periods in Yunquera.
Yunquera Airbnb Cancellation Policy Trends Analysis (2026)
Limited
1 listings
4.5% of total
Flexible
8 listings
36.4% of total
Moderate
5 listings
22.7% of total
Firm
6 listings
27.3% of total
Strict
2 listings
9.1% of total
Cancellation Policy Insights for Yunquera
- The prevailing Airbnb cancellation policy trend in Yunquera is Flexible, used by 36.4% of listings.
- There's a relatively balanced mix between guest-friendly (59.1%) and stricter (36.4%) policies, offering choices for different guest needs.
- Strict cancellation policies are quite rare (9.1%), potentially making listings with this policy less competitive unless justified by high demand or property type.
Recommendations for Hosts
- Consider adopting a Flexible policy to align with the 36.4% market standard in Yunquera.
- Using a Strict policy might deter some guests, as only 9.1% of listings use it. Evaluate if potential revenue protection outweighs possible lower booking rates.
- Regularly review your cancellation policy against competitors and market demand shifts in Yunquera.
Yunquera STR Booking Lead Time Analysis (2026)
Average Booking Lead Time by Month
Booking Lead Time Insights for Yunquera
- The overall average booking lead time for vacation rentals in Yunquera is 53 days.
- Guests book furthest in advance for stays during August (average 100 days), likely coinciding with peak travel demand or local events.
- The shortest booking windows occur for stays in January (average 23 days), indicating more last-minute travel plans during this time.
- Seasonally, Summer (58 days avg.) sees the longest lead times, while Winter (37 days avg.) has the shortest, reflecting typical travel planning cycles.
Recommendations for Hosts
- Use the overall average lead time (53 days) as a baseline for your pricing and availability strategy in Yunquera.
- For August stays, consider implementing length-of-stay discounts or slightly higher rates for bookings made less than 100 days out to capitalize on advance planning.
- Target marketing efforts for the Summer season well in advance (at least 58 days) to capture early planners.
- Monitor your own booking lead times against these Yunquera averages to identify opportunities for dynamic pricing adjustments.
Popular & Essential Airbnb Amenities in Yunquera (2026)
Amenity Prevalence
Amenity Insights for Yunquera
- Essential amenities in Yunquera that guests expect include: Kitchen, Coffee maker. Lacking these (any) could significantly impact bookings.
- Popular amenities like Refrigerator, Dishes and silverware, First aid kit are common but not universal. Offering these can provide a competitive edge.
Recommendations for Hosts
- Ensure your listing includes all essential amenities for Yunquera: Kitchen, Coffee maker.
- Prioritize adding missing essentials: Coffee maker.
- Consider adding popular differentiators like Refrigerator or Dishes and silverware to increase appeal.
- Highlight unique or less common amenities you offer (e.g., hot tub, dedicated workspace, EV charger) in your listing description and photos.
- Regularly check competitor amenities in Yunquera to stay competitive.
Yunquera Airbnb Guest Demographics & Profile Analysis (2026)
Guest Profile Summary for Yunquera
- The typical guest profile for Airbnb in Yunquera consists of predominantly international visitors (76%), with top international origins including United Kingdom, typically belonging to the Post-2000s (Gen Z/Alpha) group (50%), primarily speaking English or French.
- Domestic travelers account for 23.9% of guests.
- Key international markets include Spain (23.9%) and United Kingdom (21.7%).
- Top languages spoken are English (35.9%) followed by French (12.8%).
- A significant demographic segment is the Post-2000s (Gen Z/Alpha) group, representing 50% of guests.
Recommendations for Hosts
- Focus marketing internationally, particularly towards travelers from United Kingdom.
- Tailor amenities and listing descriptions to appeal to the dominant Post-2000s (Gen Z/Alpha) demographic (e.g., highlight fast WiFi, smart home features, local guides).
- Highlight unique local experiences or amenities relevant to the primary guest profile.
- Consider seasonal promotions aligned with peak travel times for key origin markets.
Nearby Short-Term Rental Market Comparison
How does the Yunquera Airbnb market stack up against its neighbors? Compare key performance metrics like average monthly revenue, ADR, and occupancy rates in surrounding areas to understand the broader regional STR landscape.
| Market | Active Properties | Monthly Revenue | Daily Rate | Avg. Occupancy |
|---|---|---|---|---|
| Cártama | 48 | $4,137 | $378.39 | 45% |
| Alhaurín de la Torre | 210 | $3,716 | $325.91 | 46% |
| Alhaurín el Grande | 271 | $3,613 | $310.22 | 46% |
| Casarabonela | 24 | $3,495 | $286.94 | 39% |
| Benahavís | 518 | $2,914 | $430.92 | 39% |
| Marbella | 5,279 | $2,756 | $342.36 | 42% |
| El Paraíso | 13 | $2,679 | $369.93 | 45% |
| Villanueva del Rosario | 12 | $2,590 | $310.50 | 35% |
| Gójar | 14 | $2,483 | $231.10 | 33% |
| Coín | 119 | $2,388 | $303.70 | 41% |