Íllora Airbnb Market Analysis 2026: Short Term Rental Data & Vacation Rental Statistics in Andalusia, Spain
Is Airbnb profitable in Íllora in 2026? Explore comprehensive Airbnb analytics for Íllora, Andalusia, Spain to uncover income potential. This 2026 STR market report for Íllora, based on AirROI data from February 2025 to January 2026, reveals key trends in the niche market of 18 active listings.
Whether you're considering an Airbnb investment in Íllora, optimizing your existing vacation rental, or exploring rental arbitrage opportunities, understanding the Íllora Airbnb data is crucial. Navigating the high regulation landscape is key to maximizing your short term rental income potential. Let's dive into the specifics.
Key Íllora Airbnb Performance Metrics Overview
Monthly Airbnb Revenue Variations & Income Potential in Íllora (2026)
Understanding the monthly revenue variations for Airbnb listings in Íllora is key to maximizing your short term rental income potential. Seasonality significantly impacts earnings. Our analysis, based on data from the past 12 months, shows that the peak revenue month for STRs in Íllora is typically August, while January often presents the lowest earnings, highlighting opportunities for strategic pricing adjustments during shoulder and low seasons. Explore the typical Airbnb income in Íllora across different performance tiers:
- Best-in-class properties (Top 10%) achieve $4,272+ monthly, often utilizing dynamic pricing and superior guest experiences.
- Strong performing properties (Top 25%) earn $2,683 or more, indicating effective management and desirable locations/amenities.
- Typical properties (Median) generate around $1,085 per month, representing the average market performance.
- Entry-level properties (Bottom 25%) see earnings around $312, often with potential for optimization.
Average Monthly Airbnb Earnings Trend in Íllora
Íllora Airbnb Occupancy Rate Trends (2026)
Maximize your bookings by understanding the Íllora STR occupancy trends. Seasonal demand shifts significantly influence how often properties are booked. Typically, Julysees the highest demand (peak season occupancy), while January experiences the lowest (low season). Effective strategies, like adjusting minimum stays or offering promotions, can boost occupancy during slower periods. Here's how different property tiers perform in Íllora:
- Best-in-class properties (Top 10%) achieve 51%+ occupancy, indicating high desirability and potentially optimized availability.
- Strong performing properties (Top 25%) maintain 37% or higher occupancy, suggesting good market fit and guest satisfaction.
- Typical properties (Median) have an occupancy rate around 19%.
- Entry-level properties (Bottom 25%) average 11% occupancy, potentially facing higher vacancy.
Average Monthly Occupancy Rate Trend in Íllora
Average Daily Rate (ADR) Airbnb Trends in Íllora (2026)
Effective short term rental pricing strategy in Íllora involves understanding monthly ADR fluctuations. The Average Daily Rate (ADR) for Airbnb in Íllora typically peaks in August and dips lowest during November. Leveraging Airbnb dynamic pricing tools or strategies based on this seasonality can significantly boost revenue. Here's a look at the typical nightly rates achieved:
- Best-in-class properties (Top 10%) command rates of $437+ per night, often due to premium features or locations.
- Strong performing properties (Top 25%) achieve nightly rates of $306 or more.
- Typical properties (Median) charge around $170 per night.
- Entry-level properties (Bottom 25%) earn around $60 per night.
Average Daily Rate (ADR) Trend by Month in Íllora
Get Live Íllora Market Intelligence 👇

Explore Real-time Analytics
Airbnb Seasonality Analysis & Trends in Íllora (2026)
Peak Season (August, July, December)
- Revenue averages $3,056 per month
- Occupancy rates average 41.5%
- Daily rates average $213
Shoulder Season
- Revenue averages $1,562 per month
- Occupancy maintains around 23.1%
- Daily rates hold near $204
Low Season (January, March, April)
- Revenue drops to average $984 per month
- Occupancy decreases to average 15.1%
- Daily rates adjust to average $200
Seasonality Insights for Íllora
- The Airbnb seasonality in Íllora shows highly seasonal trends requiring careful strategy. While the sections above show seasonal averages, it's also insightful to look at the extremes:
- During the high season, the absolute peak month showcases Íllora's highest earning potential, with monthly revenues capable of climbing to $3,487, occupancy reaching a high of 45.2%, and ADRs peaking at $222.
- Conversely, the slowest single month of the year, typically falling within the low season, marks the market's lowest point. In this month, revenue might dip to $773, occupancy could drop to 10.7%, and ADRs may adjust down to $197.
- Understanding both the seasonal averages and these monthly peaks and troughs in revenue, occupancy, and ADR is crucial for maximizing your Airbnb profit potential in Íllora.
Seasonal Strategies for Maximizing Profit
- Peak Season: Maximize revenue through premium pricing and potentially longer minimum stays. Ensure high availability.
- Low Season: Offer competitive pricing, special promotions (e.g., extended stay discounts), and flexible cancellation policies. Target off-season travelers like remote workers or budget-conscious guests.
- Shoulder Seasons: Implement dynamic pricing that balances peak and low rates. Target weekend travelers or specific events. Offer slightly more flexible terms than peak season.
- Regularly analyze your own performance against these Íllora seasonality benchmarks and adjust your pricing and availability strategy accordingly.
Best Areas for Airbnb Investment in Íllora (2026)
Exploring the top neighborhoods for short-term rentals in Íllora? This section highlights key areas, outlining why they are attractive for hosts and guests, along with notable local attractions. Consider these locations based on your target guest profile and investment strategy.
| Neighborhood / Area | Why Host Here? (Target Guests & Appeal) | Key Attractions & Landmarks |
|---|---|---|
| Iglesia de la Encarnación | A central landmark that attracts visitors for its historical significance and stunning architecture. A great location for those looking to experience the charm of Íllora and its local culture. | Iglesia de la Encarnación, Plaza de España, Alcalá la Real nearby, local tapas bars |
| Castillo de Íllora | The castle offers panoramic views and is rich in history, making it a popular spot for historical tourism and photography. Ideal for travelers interested in culture and history. | Castillo de Íllora, historical walking tours, local hiking trails |
| Calle Real | The main street in Íllora with various shops, cafes, and local life, perfect for tourists who want to feel the local vibe and experience daily life in Andalusia. | Calle Real shops, local markets, cultural events, traditional restaurants |
| Plaza de la Constitución | A beautiful square in the heart of Íllora where locals gather and events take place. Perfect for those wanting to experience the local culture and community life. | Plaza de la Constitución, local festivals, cafe culture |
| Alhama de Granada | Nearby town known for its natural hot springs and thermal baths. Great for visitors looking for relaxation and wellness experiences, enhancing the appeal for Airbnb guests. | Alhama Hot Springs, caving adventure, local cuisine |
| Los Cahorros | A stunning natural area nearby famed for its dramatic landscapes, making it perfect for nature lovers and adventure seekers. Adds variety to Airbnb offerings. | hiking trails, scenic views, nature photography |
| Guadix | A historical town not far from Íllora with unique cave dwellings and rich history. Attracts tourists interested in cultural heritage and unique experiences. | Cave Houses, Guadix Cathedral, local history museums |
| Sierra Nevada National Park | A short drive from Íllora, this national park offers beautiful landscapes, skiing in winter and hiking in summer, appealing to outdoor enthusiasts year-round. | Ski resorts, hiking paths, breathtaking views |
Understanding Airbnb License Requirements & STR Laws in Íllora (2026)
Yes, Íllora, Andalusia, Spain enforces high STR regulations. Obtaining a license and ensuring compliance is almost certainly required according to current 2026 STR laws. Always verify the latest short term rental regulations and Airbnb license requirements directly with local government authorities for Íllora to ensure full compliance before hosting.
(Source: AirROI data, 2026, based on 72% licensed listings)
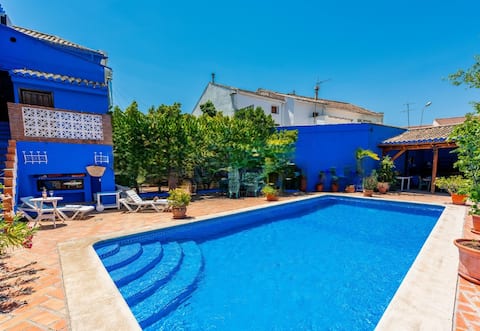
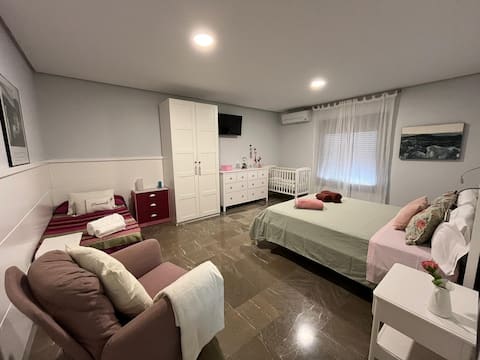
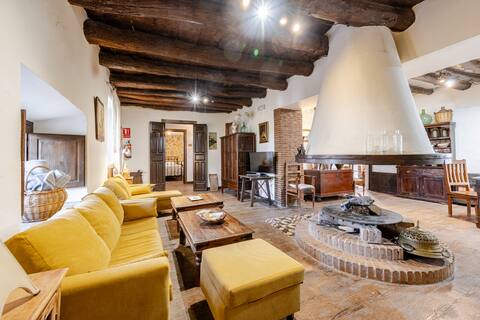
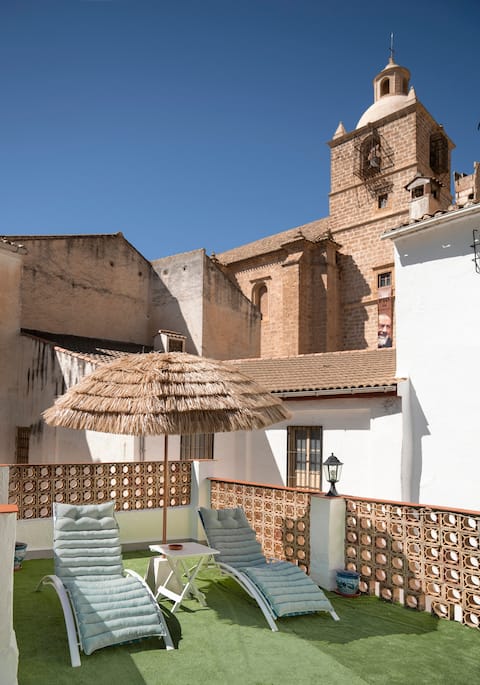
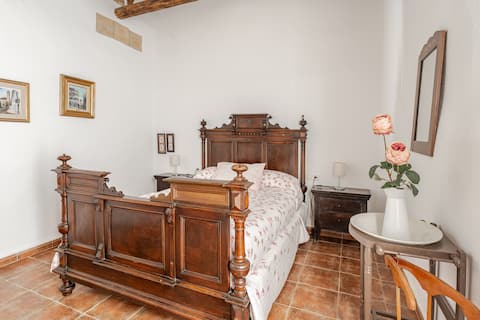
Top Performing Airbnb Properties in Íllora (2026)
Benchmark your potential! Explore examples of top-performing Airbnb properties in Íllorabased on Trailing Twelve Month (TTM) revenue. Analyze their characteristics, revenue, occupancy rate, and ADR to understand what drives success in this market.
La Casa De Íllora, charming rural tourism
Entire Place • 6 bedrooms
"Lucio's Olive Tree House"
Entire Place • 4 bedrooms
Casa Grande of El Cortijuelo
Entire Place • 4 bedrooms
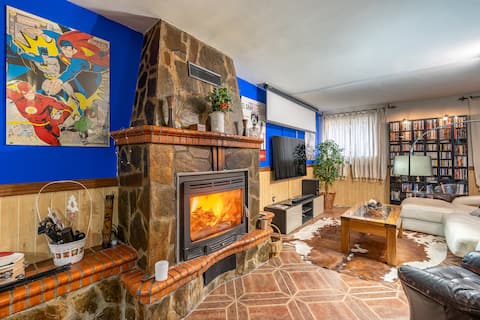
La Latina Casa de Amigos with fireplace and barbecue
Entire Place • 5 bedrooms
Spacious and cozy house with fireplace in Íllora
Entire Place • 6 bedrooms
La Casilla de El Cortijuelo House
Entire Place • 4 bedrooms
Note: Performance varies based on location, size, amenities, seasonality, and management quality. Data reflects the past 12 months.
Top Performing Airbnb Hosts in Íllora (2026)
Learn from the best! This table showcases top-performing Airbnb hosts in Íllora based on the number of properties managed and estimated total revenue over the past year. Analyze their scale and performance metrics.
| Host Name | Properties | Grossing Revenue | Stay Reviews | Avg Rating |
|---|---|---|---|---|
| Alojamiento Rural El Cortijue | 3 | $73,237 | 44 | 3.97/5.0 |
| Eugenia | 1 | $51,015 | 7 | 5.00/5.0 |
| Flora | 1 | $50,295 | 18 | 4.94/5.0 |
| María Reyes | 1 | $18,337 | 2 | Not Rated |
| Jose Antonio | 1 | $18,119 | 8 | 5.00/5.0 |
| Gilles | 1 | $10,498 | 56 | 4.75/5.0 |
| Tanya | 1 | $9,612 | 40 | 4.63/5.0 |
| Pedro | 1 | $9,249 | 12 | 5.00/5.0 |
| Ruralidays | 1 | $4,318 | 3 | 5.00/5.0 |
| Laly | 1 | $4,181 | 8 | 5.00/5.0 |
Analyzing the strategies of top hosts, such as their property selection, pricing, and guest communication, can offer valuable lessons for optimizing your own Airbnb operations in Íllora.
Dive Deeper: Advanced Íllora STR Market Data (2026)
Ready to unlock more insights? AirROI provides access to advanced metrics and comprehensive Airbnb data for Íllora. Explore detailed analytics beyond this report to refine your investment strategy, optimize pricing, and maximize your vacation rental profits.
Explore Advanced MetricsÍllora Short-Term Rental Market Composition (2026): Property & Room Types
Room Type Distribution
Property Type Distribution
Market Composition Insights for Íllora
- The Íllora Airbnb market composition is heavily skewed towards Entire Home/Apt listings, which make up 83.3% of the 18 active rentals. This indicates strong guest preference for privacy and space.
- Looking at the property type distribution in Íllora, House properties are the most common (88.9%), reflecting the local real estate landscape.
- Houses represent a significant 88.9% portion, catering likely to families or larger groups.
Íllora Airbnb Room Capacity Analysis (2026): Bedroom Distribution
Distribution of Listings by Number of Bedrooms
Room Capacity Insights for Íllora
- The dominant room capacity in Íllora is 4 bedrooms listings, making up 33.3% of the market. This suggests a strong demand for properties suitable for families or small groups.
- Together, 4 bedrooms and 2 bedrooms properties represent 61.1% of the active Airbnb listings in Íllora, indicating a high concentration in these sizes.
- A significant 61.1% of listings offer 3+ bedrooms, catering to larger groups and families seeking more space in Íllora.
Íllora Vacation Rental Guest Capacity Trends (2026)
Distribution of Listings by Guest Capacity
Guest Capacity Insights for Íllora
- The most common guest capacity trend in Íllora vacation rentals is listings accommodating 8+ guests (50%). This suggests the primary traveler segment is likely larger groups.
- Properties designed for 8+ guests and 6 guests dominate the Íllora STR market, accounting for 61.1% of listings.
- 66.7% of properties accommodate 6+ guests, serving the market segment for larger families or group travel in Íllora.
- On average, properties in Íllora are equipped to host 5.8 guests.
Íllora Airbnb Booking Patterns (2026): Available vs. Booked Days
Available Days Distribution
Booked Days Distribution
Booking Pattern Insights for Íllora
- The most common availability pattern in Íllora falls within the 271-366 days range, representing 77.8% of listings. This suggests many properties have significant open periods on their calendars.
- Approximately 100.0% of listings show high availability (181+ days open annually), indicating potential for increased bookings or specific owner usage patterns.
- For booked days, the 31-90 days range is most frequent in Íllora (55.6%), reflecting common guest stay durations or potential owner blocking patterns.
Íllora Airbnb Minimum Stay Requirements Analysis
Distribution of Listings by Minimum Night Requirement
1 Night
3 listings
16.7% of total
2 Nights
4 listings
22.2% of total
3 Nights
1 listings
5.6% of total
4-6 Nights
3 listings
16.7% of total
30+ Nights
7 listings
38.9% of total
Key Insights
- The most prevalent minimum stay requirement in Íllora is 30+ Nights, adopted by 38.9% of listings. This highlights the market's preference for longer commitments.
- A significant segment (38.9%) caters to monthly stays (30+ nights) in Íllora, pointing to opportunities in the extended-stay market.
Recommendations
- Align with the market by considering a 30+ Nights minimum stay, as 38.9% of Íllora hosts use this setting.
- If feasible, allowing 1-night stays, especially midweek or during low season, could capture last-minute bookings, as only 16.7% currently do.
- Explore offering discounts for stays of 30+ nights to attract the 38.9% of the market seeking extended stays.
- Adjust minimum nights based on seasonality – potentially shorter during low season and longer during peak demand periods in Íllora.
Íllora Airbnb Cancellation Policy Trends Analysis (2026)
Super Strict 30 Days
3 listings
16.7% of total
Limited
1 listings
5.6% of total
Flexible
4 listings
22.2% of total
Moderate
3 listings
16.7% of total
Firm
6 listings
33.3% of total
Strict
1 listings
5.6% of total
Cancellation Policy Insights for Íllora
- The prevailing Airbnb cancellation policy trend in Íllora is Firm, used by 33.3% of listings.
- There's a relatively balanced mix between guest-friendly (38.9%) and stricter (38.9%) policies, offering choices for different guest needs.
- Strict cancellation policies are quite rare (5.6%), potentially making listings with this policy less competitive unless justified by high demand or property type.
Recommendations for Hosts
- Consider adopting a Firm policy to align with the 33.3% market standard in Íllora.
- Using a Strict policy might deter some guests, as only 5.6% of listings use it. Evaluate if potential revenue protection outweighs possible lower booking rates.
- Regularly review your cancellation policy against competitors and market demand shifts in Íllora.
Íllora STR Booking Lead Time Analysis (2026)
Average Booking Lead Time by Month
Booking Lead Time Insights for Íllora
- The overall average booking lead time for vacation rentals in Íllora is 53 days.
- Guests book furthest in advance for stays during July (average 88 days), likely coinciding with peak travel demand or local events.
- The shortest booking windows occur for stays in February (average 34 days), indicating more last-minute travel plans during this time.
- Seasonally, Summer (66 days avg.) sees the longest lead times, while Spring (48 days avg.) has the shortest, reflecting typical travel planning cycles.
Recommendations for Hosts
- Use the overall average lead time (53 days) as a baseline for your pricing and availability strategy in Íllora.
- For July stays, consider implementing length-of-stay discounts or slightly higher rates for bookings made less than 88 days out to capitalize on advance planning.
- Target marketing efforts for the Summer season well in advance (at least 66 days) to capture early planners.
- Monitor your own booking lead times against these Íllora averages to identify opportunities for dynamic pricing adjustments.
Popular & Essential Airbnb Amenities in Íllora (2026)
Amenity Prevalence
Amenity Insights for Íllora
- Essential amenities in Íllora that guests expect include: Washer. Lacking these (this) could significantly impact bookings.
- Popular amenities like Hair dryer, TV, Heating are common but not universal. Offering these can provide a competitive edge.
- Warning: Wifi is not universally provided but is considered essential globally. Ensure reliable Wifi is offered.
Recommendations for Hosts
- Ensure your listing includes all essential amenities for Íllora: Washer.
- Consider adding popular differentiators like Hair dryer or TV to increase appeal.
- Highlight unique or less common amenities you offer (e.g., hot tub, dedicated workspace, EV charger) in your listing description and photos.
- Regularly check competitor amenities in Íllora to stay competitive.
Íllora Airbnb Guest Demographics & Profile Analysis (2026)
Guest Profile Summary for Íllora
- The typical guest profile for Airbnb in Íllora consists of a mix of domestic (50%) and international guests, with top international origins including United Kingdom, typically belonging to the Post-2000s (Gen Z/Alpha) group (50%), primarily speaking Spanish or English.
- Domestic travelers account for 50.0% of guests.
- Key international markets include Spain (50%) and United Kingdom (17.9%).
- Top languages spoken are Spanish (42.1%) followed by English (31.6%).
- A significant demographic segment is the Post-2000s (Gen Z/Alpha) group, representing 50% of guests.
Recommendations for Hosts
- Balance marketing efforts between domestic and international channels based on the guest mix.
- Tailor amenities and listing descriptions to appeal to the dominant Post-2000s (Gen Z/Alpha) demographic (e.g., highlight fast WiFi, smart home features, local guides).
- Highlight unique local experiences or amenities relevant to the primary guest profile.
- Consider seasonal promotions aligned with peak travel times for key origin markets.
Nearby Short-Term Rental Market Comparison
How does the Íllora Airbnb market stack up against its neighbors? Compare key performance metrics like average monthly revenue, ADR, and occupancy rates in surrounding areas to understand the broader regional STR landscape.
| Market | Active Properties | Monthly Revenue | Daily Rate | Avg. Occupancy |
|---|---|---|---|---|
| Cártama | 48 | $4,137 | $378.39 | 45% |
| Alhaurín de la Torre | 210 | $3,716 | $325.91 | 46% |
| Alhaurín el Grande | 271 | $3,613 | $310.22 | 46% |
| Casarabonela | 24 | $3,495 | $286.94 | 39% |
| Marbella | 5,279 | $2,756 | $342.36 | 42% |
| Villanueva del Rosario | 12 | $2,590 | $310.50 | 35% |
| Gójar | 14 | $2,483 | $231.10 | 33% |
| Coín | 119 | $2,388 | $303.70 | 41% |
| Ojén | 136 | $2,305 | $244.23 | 44% |
| Málaga | 8,177 | $2,191 | $175.56 | 52% |