La Litera / La Llitera Airbnb Market Analysis 2026: Short Term Rental Data & Vacation Rental Statistics in Aragon, Spain
Is Airbnb profitable in La Litera / La Llitera in 2026? Explore comprehensive Airbnb analytics for La Litera / La Llitera, Aragon, Spain to uncover income potential. This 2026 STR market report for La Litera / La Llitera, based on AirROI data from February 2025 to January 2026, reveals key trends in the niche market of 33 active listings.
Whether you're considering an Airbnb investment in La Litera / La Llitera, optimizing your existing vacation rental, or exploring rental arbitrage opportunities, understanding the La Litera / La Llitera Airbnb data is crucial. Navigating the high regulation landscape is key to maximizing your short term rental income potential. Let's dive into the specifics.
Key La Litera / La Llitera Airbnb Performance Metrics Overview
Monthly Airbnb Revenue Variations & Income Potential in La Litera / La Llitera (2026)
Understanding the monthly revenue variations for Airbnb listings in La Litera / La Llitera is key to maximizing your short term rental income potential. Seasonality significantly impacts earnings. Our analysis, based on data from the past 12 months, shows that the peak revenue month for STRs in La Litera / La Llitera is typically August, while December often presents the lowest earnings, highlighting opportunities for strategic pricing adjustments during shoulder and low seasons. Explore the typical Airbnb income in La Litera / La Llitera across different performance tiers:
- Best-in-class properties (Top 10%) achieve $2,754+ monthly, often utilizing dynamic pricing and superior guest experiences.
- Strong performing properties (Top 25%) earn $1,543 or more, indicating effective management and desirable locations/amenities.
- Typical properties (Median) generate around $826 per month, representing the average market performance.
- Entry-level properties (Bottom 25%) see earnings around $532, often with potential for optimization.
Average Monthly Airbnb Earnings Trend in La Litera / La Llitera
La Litera / La Llitera Airbnb Occupancy Rate Trends (2026)
Maximize your bookings by understanding the La Litera / La Llitera STR occupancy trends. Seasonal demand shifts significantly influence how often properties are booked. Typically, Februarysees the highest demand (peak season occupancy), while January experiences the lowest (low season). Effective strategies, like adjusting minimum stays or offering promotions, can boost occupancy during slower periods. Here's how different property tiers perform in La Litera / La Llitera:
- Best-in-class properties (Top 10%) achieve 67%+ occupancy, indicating high desirability and potentially optimized availability.
- Strong performing properties (Top 25%) maintain 45% or higher occupancy, suggesting good market fit and guest satisfaction.
- Typical properties (Median) have an occupancy rate around 27%.
- Entry-level properties (Bottom 25%) average 17% occupancy, potentially facing higher vacancy.
Average Monthly Occupancy Rate Trend in La Litera / La Llitera
Average Daily Rate (ADR) Airbnb Trends in La Litera / La Llitera (2026)
Effective short term rental pricing strategy in La Litera / La Llitera involves understanding monthly ADR fluctuations. The Average Daily Rate (ADR) for Airbnb in La Litera / La Llitera typically peaks in August and dips lowest during February. Leveraging Airbnb dynamic pricing tools or strategies based on this seasonality can significantly boost revenue. Here's a look at the typical nightly rates achieved:
- Best-in-class properties (Top 10%) command rates of $275+ per night, often due to premium features or locations.
- Strong performing properties (Top 25%) achieve nightly rates of $154 or more.
- Typical properties (Median) charge around $92 per night.
- Entry-level properties (Bottom 25%) earn around $72 per night.
Average Daily Rate (ADR) Trend by Month in La Litera / La Llitera
Get Live La Litera / La Llitera Market Intelligence 👇

Explore Real-time Analytics
Airbnb Seasonality Analysis & Trends in La Litera / La Llitera (2026)
Peak Season (August, February, July)
- Revenue averages $1,891 per month
- Occupancy rates average 42.7%
- Daily rates average $135
Shoulder Season
- Revenue averages $1,120 per month
- Occupancy maintains around 32.5%
- Daily rates hold near $132
Low Season (January, November, December)
- Revenue drops to average $699 per month
- Occupancy decreases to average 23.1%
- Daily rates adjust to average $132
Seasonality Insights for La Litera / La Llitera
- The Airbnb seasonality in La Litera / La Llitera shows highly seasonal trends requiring careful strategy. While the sections above show seasonal averages, it's also insightful to look at the extremes:
- During the high season, the absolute peak month showcases La Litera / La Llitera's highest earning potential, with monthly revenues capable of climbing to $2,086, occupancy reaching a high of 47.0%, and ADRs peaking at $139.
- Conversely, the slowest single month of the year, typically falling within the low season, marks the market's lowest point. In this month, revenue might dip to $664, occupancy could drop to 21.6%, and ADRs may adjust down to $127.
- Understanding both the seasonal averages and these monthly peaks and troughs in revenue, occupancy, and ADR is crucial for maximizing your Airbnb profit potential in La Litera / La Llitera.
Seasonal Strategies for Maximizing Profit
- Peak Season: Maximize revenue through premium pricing and potentially longer minimum stays. Ensure high availability.
- Low Season: Offer competitive pricing, special promotions (e.g., extended stay discounts), and flexible cancellation policies. Target off-season travelers like remote workers or budget-conscious guests.
- Shoulder Seasons: Implement dynamic pricing that balances peak and low rates. Target weekend travelers or specific events. Offer slightly more flexible terms than peak season.
- Regularly analyze your own performance against these La Litera / La Llitera seasonality benchmarks and adjust your pricing and availability strategy accordingly.
Best Areas for Airbnb Investment in La Litera / La Llitera (2026)
Exploring the top neighborhoods for short-term rentals in La Litera / La Llitera? This section highlights key areas, outlining why they are attractive for hosts and guests, along with notable local attractions. Consider these locations based on your target guest profile and investment strategy.
| Neighborhood / Area | Why Host Here? (Target Guests & Appeal) | Key Attractions & Landmarks |
|---|---|---|
| Fraga | A key commercial and industrial city in the region, Fraga attracts business travelers and visitors due to its rich historical background and proximity to key transportation routes. It offers a mix of culture and modern amenities. | Iglesia de San Pedro, Fraga Castle, Plaza de España, Parque de la Estación, Museo de Historia |
| Tamarite de Litera | Known for its charming historical center and local festivities, Tamarite de Litera is perfect for those looking to experience authentic Aragonese culture. | Iglesia de San Juan Bautista, Castillo de Tamarite, Plaza de la Villa, Museo Evaristo de Chillida |
| Binéfar | A growing town with industrial activities and a friendly community vibe, it's an excellent choice for family vacations and those exploring the surrounding rural areas. | Church of San Miguel, Parque de la Estación, Casa de la Cultura, Historical Heritage sites |
| San Esteban de Litera | This small town offers a more tranquil getaway among natural landscapes, making it ideal for travelers seeking peace and outdoor activities like hiking and cycling. | Centro Interpretación de los Gorgs, Natural Parks, Rural trails |
| Altorricón | A picturesque village with scenic views and traditional architecture, Altorricón appeals to those interested in rural tourism and local traditions. | Iglesia de San Miguel, Local festivals, Countryside |
| Monzón | A town steeped in history that serves as an economic hub for the region, Monzón attracts visitors interested in both culture and business. | Castillo de Monzón, Parque del Soto, Museo de Ciencias Naturales |
| Cimballa | A small, serene location ideal for rural escapes, appealing to nature lovers and those seeking a break from the urban lifestyle. | Natural environment, Outdoor activities, Local wildlife |
| Lérida | Though slightly outside the immediate region, Lérida is a significant city close to La Litera, offering diverse attractions, shopping, and dining experiences. | La Seu Vella, Castillo de Gardeny, Parque de la Mitjana, Lérida Museum |
Understanding Airbnb License Requirements & STR Laws in La Litera / La Llitera (2026)
Yes, La Litera / La Llitera, Aragon, Spain enforces high STR regulations. Obtaining a license and ensuring compliance is almost certainly required according to current 2026 STR laws. Always verify the latest short term rental regulations and Airbnb license requirements directly with local government authorities for La Litera / La Llitera to ensure full compliance before hosting.
(Source: AirROI data, 2026, based on 42% licensed listings)
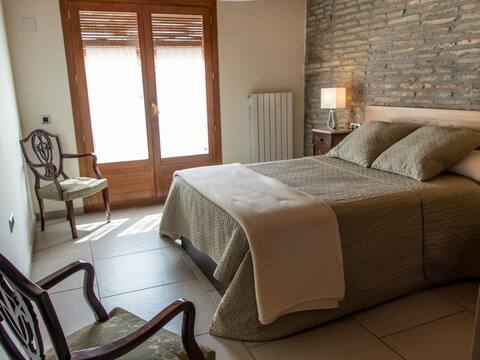
Top Performing Airbnb Properties in La Litera / La Llitera (2026)
Benchmark your potential! Explore examples of top-performing Airbnb properties in La Litera / La Lliterabased on Trailing Twelve Month (TTM) revenue. Analyze their characteristics, revenue, occupancy rate, and ADR to understand what drives success in this market.

Casa Menescal, 19th century manor house
Entire Place • 4 bedrooms

LA ERA Exclusive house with a swimming pool and private estate
Entire Place • 3 bedrooms

Casa Juliana Tourism
Entire Place • 3 bedrooms

Stargazing suite in Alins country house
Private Room • 1 bedroom
Double Apartment with Terrace
Entire Place • 1 bedroom

Silver suite in Alins country house
Private Room • 1 bedroom
Note: Performance varies based on location, size, amenities, seasonality, and management quality. Data reflects the past 12 months.
Top Performing Airbnb Hosts in La Litera / La Llitera (2026)
Learn from the best! This table showcases top-performing Airbnb hosts in La Litera / La Llitera based on the number of properties managed and estimated total revenue over the past year. Analyze their scale and performance metrics.
| Host Name | Properties | Grossing Revenue | Stay Reviews | Avg Rating |
|---|---|---|---|---|
| María Ángeles | 6 | $65,067 | 98 | 5.00/5.0 |
| Iván | 1 | $41,494 | 11 | 4.82/5.0 |
| Eduardo | 1 | $40,026 | 31 | 4.77/5.0 |
| Dolors | 7 | $38,548 | 25 | 4.73/5.0 |
| Daniel | 4 | $35,229 | 42 | 4.91/5.0 |
| David | 1 | $24,345 | 19 | 4.95/5.0 |
| Ana | 1 | $12,443 | 105 | 4.92/5.0 |
| Toñi Casa Plana | 1 | $11,364 | 22 | 4.68/5.0 |
| Luis | 1 | $10,721 | 310 | 4.91/5.0 |
| Milagros | 1 | $10,213 | 130 | 4.80/5.0 |
Analyzing the strategies of top hosts, such as their property selection, pricing, and guest communication, can offer valuable lessons for optimizing your own Airbnb operations in La Litera / La Llitera.
Dive Deeper: Advanced La Litera / La Llitera STR Market Data (2026)
Ready to unlock more insights? AirROI provides access to advanced metrics and comprehensive Airbnb data for La Litera / La Llitera. Explore detailed analytics beyond this report to refine your investment strategy, optimize pricing, and maximize your vacation rental profits.
Explore Advanced MetricsLa Litera / La Llitera Short-Term Rental Market Composition (2026): Property & Room Types
Room Type Distribution
Property Type Distribution
Market Composition Insights for La Litera / La Llitera
- The La Litera / La Llitera Airbnb market composition is heavily skewed towards Private Room listings, which make up 51.5% of the 33 active rentals. This indicates strong guest preference for privacy and space.
- Looking at the property type distribution in La Litera / La Llitera, House properties are the most common (42.4%), reflecting the local real estate landscape.
- Houses represent a significant 42.4% portion, catering likely to families or larger groups.
- The presence of 36.4% Hotel/Boutique listings indicates integration with traditional hospitality.
- Smaller segments like outdoor/unique (combined 3.0%) offer potential for unique stay experiences.
La Litera / La Llitera Airbnb Room Capacity Analysis (2026): Bedroom Distribution
Distribution of Listings by Number of Bedrooms
Room Capacity Insights for La Litera / La Llitera
- The dominant room capacity in La Litera / La Llitera is 1 bedroom listings, making up 63.6% of the market. This suggests a strong demand for properties suitable for couples or solo travelers.
- Together, 1 bedroom and 3 bedrooms properties represent 78.8% of the active Airbnb listings in La Litera / La Llitera, indicating a high concentration in these sizes.
- With over half the market (63.6%) consisting of studios or 1-bedroom units, La Litera / La Llitera is particularly well-suited for individuals or couples.
- A significant 27.4% of listings offer 3+ bedrooms, catering to larger groups and families seeking more space in La Litera / La Llitera.
La Litera / La Llitera Vacation Rental Guest Capacity Trends (2026)
Distribution of Listings by Guest Capacity
Guest Capacity Insights for La Litera / La Llitera
- The most common guest capacity trend in La Litera / La Llitera vacation rentals is listings accommodating 2 guests (33.3%). This suggests the primary traveler segment is likely couples or solo travelers.
- Properties designed for 2 guests and 4 guests dominate the La Litera / La Llitera STR market, accounting for 48.5% of listings.
- 27.3% of properties accommodate 6+ guests, serving the market segment for larger families or group travel in La Litera / La Llitera.
- On average, properties in La Litera / La Llitera are equipped to host 3.6 guests.
La Litera / La Llitera Airbnb Booking Patterns (2026): Available vs. Booked Days
Available Days Distribution
Booked Days Distribution
Booking Pattern Insights for La Litera / La Llitera
- The most common availability pattern in La Litera / La Llitera falls within the 271-366 days range, representing 66.7% of listings. This suggests many properties have significant open periods on their calendars.
- Approximately 90.9% of listings show high availability (181+ days open annually), indicating potential for increased bookings or specific owner usage patterns.
- For booked days, the 31-90 days range is most frequent in La Litera / La Llitera (36.4%), reflecting common guest stay durations or potential owner blocking patterns.
- A notable 9.1% of properties secure long booking periods (181+ days booked per year), highlighting successful long-term rental strategies or significant owner usage.
La Litera / La Llitera Airbnb Minimum Stay Requirements Analysis
Distribution of Listings by Minimum Night Requirement
1 Night
12 listings
36.4% of total
2 Nights
4 listings
12.1% of total
3 Nights
2 listings
6.1% of total
4-6 Nights
1 listings
3% of total
7-29 Nights
1 listings
3% of total
30+ Nights
13 listings
39.4% of total
Key Insights
- The most prevalent minimum stay requirement in La Litera / La Llitera is 30+ Nights, adopted by 39.4% of listings. This highlights the market's preference for longer commitments.
- A significant segment (39.4%) caters to monthly stays (30+ nights) in La Litera / La Llitera, pointing to opportunities in the extended-stay market.
Recommendations
- Align with the market by considering a 30+ Nights minimum stay, as 39.4% of La Litera / La Llitera hosts use this setting.
- Explore offering discounts for stays of 30+ nights to attract the 39.4% of the market seeking extended stays.
- Adjust minimum nights based on seasonality – potentially shorter during low season and longer during peak demand periods in La Litera / La Llitera.
La Litera / La Llitera Airbnb Cancellation Policy Trends Analysis (2026)
Flexible
10 listings
30.3% of total
Moderate
10 listings
30.3% of total
Firm
12 listings
36.4% of total
Strict
1 listings
3% of total
Cancellation Policy Insights for La Litera / La Llitera
- The prevailing Airbnb cancellation policy trend in La Litera / La Llitera is Firm, used by 36.4% of listings.
- There's a relatively balanced mix between guest-friendly (60.6%) and stricter (39.4%) policies, offering choices for different guest needs.
- Strict cancellation policies are quite rare (3%), potentially making listings with this policy less competitive unless justified by high demand or property type.
Recommendations for Hosts
- Consider adopting a Firm policy to align with the 36.4% market standard in La Litera / La Llitera.
- Using a Strict policy might deter some guests, as only 3% of listings use it. Evaluate if potential revenue protection outweighs possible lower booking rates.
- Regularly review your cancellation policy against competitors and market demand shifts in La Litera / La Llitera.
La Litera / La Llitera STR Booking Lead Time Analysis (2026)
Average Booking Lead Time by Month
Booking Lead Time Insights for La Litera / La Llitera
- The overall average booking lead time for vacation rentals in La Litera / La Llitera is 51 days.
- Guests book furthest in advance for stays during September (average 94 days), likely coinciding with peak travel demand or local events.
- The shortest booking windows occur for stays in March (average 26 days), indicating more last-minute travel plans during this time.
- Seasonally, Fall (62 days avg.) sees the longest lead times, while Winter (35 days avg.) has the shortest, reflecting typical travel planning cycles.
Recommendations for Hosts
- Use the overall average lead time (51 days) as a baseline for your pricing and availability strategy in La Litera / La Llitera.
- For September stays, consider implementing length-of-stay discounts or slightly higher rates for bookings made less than 94 days out to capitalize on advance planning.
- Target marketing efforts for the Fall season well in advance (at least 62 days) to capture early planners.
- Monitor your own booking lead times against these La Litera / La Llitera averages to identify opportunities for dynamic pricing adjustments.
Popular & Essential Airbnb Amenities in La Litera / La Llitera (2026)
Amenity Prevalence
Amenity Insights for La Litera / La Llitera
- Essential amenities in La Litera / La Llitera that guests expect include: Wifi. Lacking these (this) could significantly impact bookings.
- Popular amenities like TV, Hangers, Heating are common but not universal. Offering these can provide a competitive edge.
Recommendations for Hosts
- Ensure your listing includes all essential amenities for La Litera / La Llitera: Wifi.
- Prioritize adding missing essentials: Wifi.
- Consider adding popular differentiators like TV or Hangers to increase appeal.
- Highlight unique or less common amenities you offer (e.g., hot tub, dedicated workspace, EV charger) in your listing description and photos.
- Regularly check competitor amenities in La Litera / La Llitera to stay competitive.
La Litera / La Llitera Airbnb Guest Demographics & Profile Analysis (2026)
Guest Profile Summary for La Litera / La Llitera
- The typical guest profile for Airbnb in La Litera / La Llitera consists of a mix of domestic (45%) and international guests, with top international origins including France, typically belonging to the Post-2000s (Gen Z/Alpha) group (50%), primarily speaking English or Spanish.
- Domestic travelers account for 44.8% of guests.
- Key international markets include Spain (44.8%) and France (27.6%).
- Top languages spoken are English (31%) followed by Spanish (22.1%).
- A significant demographic segment is the Post-2000s (Gen Z/Alpha) group, representing 50% of guests.
Recommendations for Hosts
- Balance marketing efforts between domestic and international channels based on the guest mix.
- Tailor amenities and listing descriptions to appeal to the dominant Post-2000s (Gen Z/Alpha) demographic (e.g., highlight fast WiFi, smart home features, local guides).
- Highlight unique local experiences or amenities relevant to the primary guest profile.
- Consider seasonal promotions aligned with peak travel times for key origin markets.
Nearby Short-Term Rental Market Comparison
How does the La Litera / La Llitera Airbnb market stack up against its neighbors? Compare key performance metrics like average monthly revenue, ADR, and occupancy rates in surrounding areas to understand the broader regional STR landscape.
| Market | Active Properties | Monthly Revenue | Daily Rate | Avg. Occupancy |
|---|---|---|---|---|
| Canyelles | 47 | $7,127 | $1152.36 | 35% |
| Vallirana | 10 | $5,639 | $350.46 | 57% |
| la Baronia de Rialb | 16 | $4,527 | $436.71 | 45% |
| la Llacuna | 10 | $4,238 | $584.45 | 24% |
| Aiguamúrcia | 15 | $3,747 | $310.17 | 46% |
| Alcover | 13 | $3,676 | $697.99 | 27% |
| Olivella | 97 | $3,471 | $456.77 | 41% |
| Subirats | 22 | $3,158 | $335.56 | 38% |
| Corbera de Llobregat | 15 | $2,950 | $379.06 | 46% |
| Olèrdola | 14 | $2,908 | $668.38 | 32% |