Nava Airbnb Market Analysis 2026: Short Term Rental Data & Vacation Rental Statistics in Asturias, Spain
Is Airbnb profitable in Nava in 2026? Explore comprehensive Airbnb analytics for Nava, Asturias, Spain to uncover income potential. This 2026 STR market report for Nava, based on AirROI data from February 2025 to January 2026, reveals key trends in the niche market of 18 active listings.
Whether you're considering an Airbnb investment in Nava, optimizing your existing vacation rental, or exploring rental arbitrage opportunities, understanding the Nava Airbnb data is crucial. Navigating the high regulation landscape is key to maximizing your short term rental income potential. Let's dive into the specifics.
Key Nava Airbnb Performance Metrics Overview
Monthly Airbnb Revenue Variations & Income Potential in Nava (2026)
Understanding the monthly revenue variations for Airbnb listings in Nava is key to maximizing your short term rental income potential. Seasonality significantly impacts earnings. Our analysis, based on data from the past 12 months, shows that the peak revenue month for STRs in Nava is typically August, while April often presents the lowest earnings, highlighting opportunities for strategic pricing adjustments during shoulder and low seasons. Explore the typical Airbnb income in Nava across different performance tiers:
- Best-in-class properties (Top 10%) achieve $3,377+ monthly, often utilizing dynamic pricing and superior guest experiences.
- Strong performing properties (Top 25%) earn $2,265 or more, indicating effective management and desirable locations/amenities.
- Typical properties (Median) generate around $1,195 per month, representing the average market performance.
- Entry-level properties (Bottom 25%) see earnings around $632, often with potential for optimization.
Average Monthly Airbnb Earnings Trend in Nava
Nava Airbnb Occupancy Rate Trends (2026)
Maximize your bookings by understanding the Nava STR occupancy trends. Seasonal demand shifts significantly influence how often properties are booked. Typically, Augustsees the highest demand (peak season occupancy), while October experiences the lowest (low season). Effective strategies, like adjusting minimum stays or offering promotions, can boost occupancy during slower periods. Here's how different property tiers perform in Nava:
- Best-in-class properties (Top 10%) achieve 73%+ occupancy, indicating high desirability and potentially optimized availability.
- Strong performing properties (Top 25%) maintain 48% or higher occupancy, suggesting good market fit and guest satisfaction.
- Typical properties (Median) have an occupancy rate around 30%.
- Entry-level properties (Bottom 25%) average 14% occupancy, potentially facing higher vacancy.
Average Monthly Occupancy Rate Trend in Nava
Average Daily Rate (ADR) Airbnb Trends in Nava (2026)
Effective short term rental pricing strategy in Nava involves understanding monthly ADR fluctuations. The Average Daily Rate (ADR) for Airbnb in Nava typically peaks in August and dips lowest during February. Leveraging Airbnb dynamic pricing tools or strategies based on this seasonality can significantly boost revenue. Here's a look at the typical nightly rates achieved:
- Best-in-class properties (Top 10%) command rates of $265+ per night, often due to premium features or locations.
- Strong performing properties (Top 25%) achieve nightly rates of $197 or more.
- Typical properties (Median) charge around $144 per night.
- Entry-level properties (Bottom 25%) earn around $106 per night.
Average Daily Rate (ADR) Trend by Month in Nava
Get Live Nava Market Intelligence 👇

Explore Real-time Analytics
Airbnb Seasonality Analysis & Trends in Nava (2026)
Peak Season (August, July, September)
- Revenue averages $2,594 per month
- Occupancy rates average 52.2%
- Daily rates average $170
Shoulder Season
- Revenue averages $1,356 per month
- Occupancy maintains around 31.1%
- Daily rates hold near $156
Low Season (April, October, November)
- Revenue drops to average $1,017 per month
- Occupancy decreases to average 23.9%
- Daily rates adjust to average $156
Seasonality Insights for Nava
- The Airbnb seasonality in Nava shows highly seasonal trends requiring careful strategy. While the sections above show seasonal averages, it's also insightful to look at the extremes:
- During the high season, the absolute peak month showcases Nava's highest earning potential, with monthly revenues capable of climbing to $3,392, occupancy reaching a high of 65.1%, and ADRs peaking at $175.
- Conversely, the slowest single month of the year, typically falling within the low season, marks the market's lowest point. In this month, revenue might dip to $1,009, occupancy could drop to 23.0%, and ADRs may adjust down to $146.
- Understanding both the seasonal averages and these monthly peaks and troughs in revenue, occupancy, and ADR is crucial for maximizing your Airbnb profit potential in Nava.
Seasonal Strategies for Maximizing Profit
- Peak Season: Maximize revenue through premium pricing and potentially longer minimum stays. Ensure high availability.
- Low Season: Offer competitive pricing, special promotions (e.g., extended stay discounts), and flexible cancellation policies. Target off-season travelers like remote workers or budget-conscious guests.
- Shoulder Seasons: Implement dynamic pricing that balances peak and low rates. Target weekend travelers or specific events. Offer slightly more flexible terms than peak season.
- Regularly analyze your own performance against these Nava seasonality benchmarks and adjust your pricing and availability strategy accordingly.
Best Areas for Airbnb Investment in Nava (2026)
Exploring the top neighborhoods for short-term rentals in Nava? This section highlights key areas, outlining why they are attractive for hosts and guests, along with notable local attractions. Consider these locations based on your target guest profile and investment strategy.
| Neighborhood / Area | Why Host Here? (Target Guests & Appeal) | Key Attractions & Landmarks |
|---|---|---|
| Cangas de Onís | A picturesque town known as the gateway to the Picos de Europa National Park. Popular with nature lovers, hikers, and those seeking outdoor adventures. | Covadonga Lakes, Cangas de Onís Bridge, Basilica de Santa María la Real de Covadonga, Picos de Europa National Park, Sella River |
| Ribadesella | A charming coastal town famous for its beaches and the prehistoric Tito Bustillo Caves. Ideal for summer tourism and known for annual festivals. | Ribadesella Beach, Tito Bustillo Caves, Guía de Isora, Canoeing on River Sella, Local seafood restaurants |
| Lastres | A beautiful fishing village with stunning views and a picturesque harbor, perfect for tourists looking for a quaint seaside experience. | Lastres Beach, The Dolphin Sculpture, Rinconín Beach, Juan de la Cosa Museum, Local markets |
| Llanes | A popular tourist destination in Asturias known for its charming old town and access to beautiful coastline and beaches. | Llanes Beach, Basilica de Santa Maria del Conceyu, Cueva del Ruler, Picos de Europa, Local seafood cuisine |
| Villaviciosa | A historic town surrounded by apple orchards, known for its cider production and proximity to beautiful beaches. | Villaviciosa River Estuary, Sierra del Sueve, Cider Houses, Local Artisan Markets, Beautiful countryside |
| Gijón | A vibrant coastal city with a rich industrial heritage, famous for its beaches, cultural scene, and historical sites. | San Lorenzo Beach, Cerro de Sta Catalina, Gijón Aquarium, Botanical Garden El Rinconin, Cultural fairs |
| Avilés | A historic town with medieval architecture and a strong artistic culture, attracting visitors interested in art and history. | Oscar Niemeyer International Cultural Centre, Avilés old town, Calle de La Fruta, Local art galleries, Ría de Avilés |
| Pola de Siero | A small town known for its scenic landscape and traditional Asturian architecture. Ideal for those looking for rural tourism. | Parque de la Prehistoria de Teverga, Local cider houses, Traditional Asturian architecture, Natural parks, Farming experience |
Understanding Airbnb License Requirements & STR Laws in Nava (2026)
Yes, Nava, Asturias, Spain enforces high STR regulations. Obtaining a license and ensuring compliance is almost certainly required according to current 2026 STR laws. Always verify the latest short term rental regulations and Airbnb license requirements directly with local government authorities for Nava to ensure full compliance before hosting.
(Source: AirROI data, 2026, based on 78% licensed listings)
Top Performing Airbnb Properties in Nava (2026)
Benchmark your potential! Explore examples of top-performing Airbnb properties in Navabased on Trailing Twelve Month (TTM) revenue. Analyze their characteristics, revenue, occupancy rate, and ADR to understand what drives success in this market.
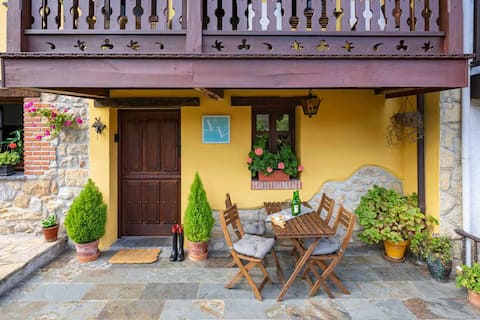
Sunny Rural House for a Quiet Getaway
Entire Place • 3 bedrooms

Casa Tete
Entire Place • 5 bedrooms
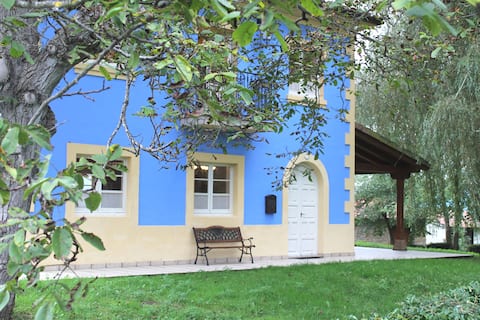
Village House in Monga, Nava, Asturias
Entire Place • 3 bedrooms

Casa Los Campones in Asturias Vv-3585-as
Entire Place • 3 bedrooms

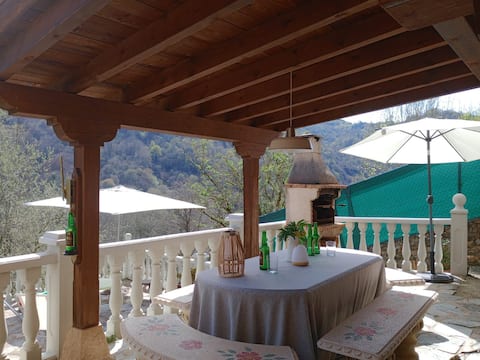
VACATION HOUSE IN THE CIDER REGION
Entire Place • 3 bedrooms
Entre Hórreos
Entire Place • 3 bedrooms
Note: Performance varies based on location, size, amenities, seasonality, and management quality. Data reflects the past 12 months.
Top Performing Airbnb Hosts in Nava (2026)
Learn from the best! This table showcases top-performing Airbnb hosts in Nava based on the number of properties managed and estimated total revenue over the past year. Analyze their scale and performance metrics.
| Host Name | Properties | Grossing Revenue | Stay Reviews | Avg Rating |
|---|---|---|---|---|
| Luis | 1 | $36,600 | 102 | 5.00/5.0 |
| Patricia | 1 | $28,115 | 75 | 4.95/5.0 |
| Seve | 1 | $20,969 | 96 | 4.89/5.0 |
| Analia | 1 | $19,464 | 2 | Not Rated |
| Amparito | 1 | $19,207 | 71 | 4.85/5.0 |
| Alexia | 1 | $17,218 | 8 | 4.63/5.0 |
| Alejandro | 2 | $13,977 | 61 | 4.83/5.0 |
| Francisco | 1 | $11,202 | 35 | 4.89/5.0 |
| Julián | 1 | $10,893 | 3 | 5.00/5.0 |
| Carmen | 1 | $9,544 | 13 | 4.83/5.0 |
Analyzing the strategies of top hosts, such as their property selection, pricing, and guest communication, can offer valuable lessons for optimizing your own Airbnb operations in Nava.
Dive Deeper: Advanced Nava STR Market Data (2026)
Ready to unlock more insights? AirROI provides access to advanced metrics and comprehensive Airbnb data for Nava. Explore detailed analytics beyond this report to refine your investment strategy, optimize pricing, and maximize your vacation rental profits.
Explore Advanced MetricsNava Short-Term Rental Market Composition (2026): Property & Room Types
Room Type Distribution
Property Type Distribution
Market Composition Insights for Nava
- The Nava Airbnb market composition is heavily skewed towards Entire Home/Apt listings, which make up 94.4% of the 18 active rentals. This indicates strong guest preference for privacy and space.
- Looking at the property type distribution in Nava, House properties are the most common (77.8%), reflecting the local real estate landscape.
- Houses represent a significant 77.8% portion, catering likely to families or larger groups.
- The presence of 5.6% Hotel/Boutique listings indicates integration with traditional hospitality.
Nava Airbnb Room Capacity Analysis (2026): Bedroom Distribution
Distribution of Listings by Number of Bedrooms
Room Capacity Insights for Nava
- The dominant room capacity in Nava is 3 bedrooms listings, making up 55.6% of the market. This suggests a strong demand for properties suitable for families or small groups.
- Together, 3 bedrooms and 2 bedrooms properties represent 83.4% of the active Airbnb listings in Nava, indicating a high concentration in these sizes.
- A significant 61.2% of listings offer 3+ bedrooms, catering to larger groups and families seeking more space in Nava.
Nava Vacation Rental Guest Capacity Trends (2026)
Distribution of Listings by Guest Capacity
Guest Capacity Insights for Nava
- The most common guest capacity trend in Nava vacation rentals is listings accommodating 6 guests (33.3%). This suggests the primary traveler segment is likely larger groups.
- Properties designed for 6 guests and 5 guests dominate the Nava STR market, accounting for 55.5% of listings.
- 38.9% of properties accommodate 6+ guests, serving the market segment for larger families or group travel in Nava.
- On average, properties in Nava are equipped to host 4.7 guests.
Nava Airbnb Booking Patterns (2026): Available vs. Booked Days
Available Days Distribution
Booked Days Distribution
Booking Pattern Insights for Nava
- The most common availability pattern in Nava falls within the 271-366 days range, representing 66.7% of listings. This suggests many properties have significant open periods on their calendars.
- Approximately 94.5% of listings show high availability (181+ days open annually), indicating potential for increased bookings or specific owner usage patterns.
- For booked days, the 31-90 days range is most frequent in Nava (44.4%), reflecting common guest stay durations or potential owner blocking patterns.
- A notable 5.6% of properties secure long booking periods (181+ days booked per year), highlighting successful long-term rental strategies or significant owner usage.
Nava Airbnb Minimum Stay Requirements Analysis
Distribution of Listings by Minimum Night Requirement
1 Night
3 listings
16.7% of total
2 Nights
2 listings
11.1% of total
3 Nights
2 listings
11.1% of total
4-6 Nights
3 listings
16.7% of total
30+ Nights
8 listings
44.4% of total
Key Insights
- The most prevalent minimum stay requirement in Nava is 30+ Nights, adopted by 44.4% of listings. This highlights the market's preference for longer commitments.
- A significant segment (44.4%) caters to monthly stays (30+ nights) in Nava, pointing to opportunities in the extended-stay market.
Recommendations
- Align with the market by considering a 30+ Nights minimum stay, as 44.4% of Nava hosts use this setting.
- If feasible, allowing 1-night stays, especially midweek or during low season, could capture last-minute bookings, as only 16.7% currently do.
- Explore offering discounts for stays of 30+ nights to attract the 44.4% of the market seeking extended stays.
- Adjust minimum nights based on seasonality – potentially shorter during low season and longer during peak demand periods in Nava.
Nava Airbnb Cancellation Policy Trends Analysis (2026)
Limited
1 listings
5.6% of total
Moderate
10 listings
55.6% of total
Firm
5 listings
27.8% of total
Strict
2 listings
11.1% of total
Cancellation Policy Insights for Nava
- The prevailing Airbnb cancellation policy trend in Nava is Moderate, used by 55.6% of listings.
- There's a relatively balanced mix between guest-friendly (55.6%) and stricter (38.9%) policies, offering choices for different guest needs.
Recommendations for Hosts
- Consider adopting a Moderate policy to align with the 55.6% market standard in Nava.
- Using a Strict policy might deter some guests, as only 11.1% of listings use it. Evaluate if potential revenue protection outweighs possible lower booking rates.
- Regularly review your cancellation policy against competitors and market demand shifts in Nava.
Nava STR Booking Lead Time Analysis (2026)
Average Booking Lead Time by Month
Booking Lead Time Insights for Nava
- The overall average booking lead time for vacation rentals in Nava is 71 days.
- Guests book furthest in advance for stays during August (average 163 days), likely coinciding with peak travel demand or local events.
- The shortest booking windows occur for stays in February (average 11 days), indicating more last-minute travel plans during this time.
- Seasonally, Summer (119 days avg.) sees the longest lead times, while Winter (30 days avg.) has the shortest, reflecting typical travel planning cycles.
Recommendations for Hosts
- Use the overall average lead time (71 days) as a baseline for your pricing and availability strategy in Nava.
- For August stays, consider implementing length-of-stay discounts or slightly higher rates for bookings made less than 163 days out to capitalize on advance planning.
- During February, focus on last-minute booking availability and promotions, as guests book with very short notice (11 days avg.).
- Target marketing efforts for the Summer season well in advance (at least 119 days) to capture early planners.
- Monitor your own booking lead times against these Nava averages to identify opportunities for dynamic pricing adjustments.
Popular & Essential Airbnb Amenities in Nava (2026)
Amenity Prevalence
Amenity Insights for Nava
- Essential amenities in Nava that guests expect include: TV, Kitchen. Lacking these (any) could significantly impact bookings.
- Popular amenities like Fire extinguisher, Heating, Washer are common but not universal. Offering these can provide a competitive edge.
Recommendations for Hosts
- Ensure your listing includes all essential amenities for Nava: TV, Kitchen.
- Consider adding popular differentiators like Fire extinguisher or Heating to increase appeal.
- Highlight unique or less common amenities you offer (e.g., hot tub, dedicated workspace, EV charger) in your listing description and photos.
- Regularly check competitor amenities in Nava to stay competitive.
Nava Airbnb Guest Demographics & Profile Analysis (2026)
Guest Profile Summary for Nava
- The typical guest profile for Airbnb in Nava consists of primarily domestic travelers (67%), often arriving from nearby Madrid, typically belonging to the Post-2000s (Gen Z/Alpha) group (50%), primarily speaking English or Spanish.
- Domestic travelers account for 66.7% of guests.
- Key international markets include Spain (66.7%) and United States (12.3%).
- Top languages spoken are English (39.5%) followed by Spanish (36.8%).
- A significant demographic segment is the Post-2000s (Gen Z/Alpha) group, representing 50% of guests.
Recommendations for Hosts
- Target domestic marketing efforts towards travelers from Madrid and Almería.
- Tailor amenities and listing descriptions to appeal to the dominant Post-2000s (Gen Z/Alpha) demographic (e.g., highlight fast WiFi, smart home features, local guides).
- Highlight unique local experiences or amenities relevant to the primary guest profile.
- Consider seasonal promotions aligned with peak travel times for key origin markets.
Nearby Short-Term Rental Market Comparison
How does the Nava Airbnb market stack up against its neighbors? Compare key performance metrics like average monthly revenue, ADR, and occupancy rates in surrounding areas to understand the broader regional STR landscape.
| Market | Active Properties | Monthly Revenue | Daily Rate | Avg. Occupancy |
|---|---|---|---|---|
| Hermandad de Campoo de Suso | 30 | $2,144 | $393.46 | 24% |
| Llanera | 14 | $2,037 | $274.76 | 39% |
| Camaleño | 96 | $1,417 | $146.42 | 42% |
| Reocín | 41 | $1,406 | $238.07 | 38% |
| Mazcuerras | 22 | $1,403 | $214.82 | 29% |
| Villaviciosa | 242 | $1,399 | $196.93 | 36% |
| Molledo | 15 | $1,373 | $219.83 | 30% |
| Potes | 72 | $1,307 | $140.84 | 38% |
| Alfoz de Lloredo | 74 | $1,286 | $207.68 | 34% |
| Suances | 231 | $1,282 | $190.90 | 36% |