Firgas Airbnb Market Analysis 2026: Short Term Rental Data & Vacation Rental Statistics in Canary Islands, Spain
Is Airbnb profitable in Firgas in 2026? Explore comprehensive Airbnb analytics for Firgas, Canary Islands, Spain to uncover income potential. This 2026 STR market report for Firgas, based on AirROI data from February 2025 to January 2026, reveals key trends in the niche market of 20 active listings.
Whether you're considering an Airbnb investment in Firgas, optimizing your existing vacation rental, or exploring rental arbitrage opportunities, understanding the Firgas Airbnb data is crucial. Navigating the high regulation landscape is key to maximizing your short term rental income potential. Let's dive into the specifics.
Key Firgas Airbnb Performance Metrics Overview
Monthly Airbnb Revenue Variations & Income Potential in Firgas (2026)
Understanding the monthly revenue variations for Airbnb listings in Firgas is key to maximizing your short term rental income potential. Seasonality significantly impacts earnings. Our analysis, based on data from the past 12 months, shows that the peak revenue month for STRs in Firgas is typically August, while November often presents the lowest earnings, highlighting opportunities for strategic pricing adjustments during shoulder and low seasons. Explore the typical Airbnb income in Firgas across different performance tiers:
- Best-in-class properties (Top 10%) achieve $3,828+ monthly, often utilizing dynamic pricing and superior guest experiences.
- Strong performing properties (Top 25%) earn $1,930 or more, indicating effective management and desirable locations/amenities.
- Typical properties (Median) generate around $850 per month, representing the average market performance.
- Entry-level properties (Bottom 25%) see earnings around $392, often with potential for optimization.
Average Monthly Airbnb Earnings Trend in Firgas
Firgas Airbnb Occupancy Rate Trends (2026)
Maximize your bookings by understanding the Firgas STR occupancy trends. Seasonal demand shifts significantly influence how often properties are booked. Typically, Februarysees the highest demand (peak season occupancy), while January experiences the lowest (low season). Effective strategies, like adjusting minimum stays or offering promotions, can boost occupancy during slower periods. Here's how different property tiers perform in Firgas:
- Best-in-class properties (Top 10%) achieve 71%+ occupancy, indicating high desirability and potentially optimized availability.
- Strong performing properties (Top 25%) maintain 49% or higher occupancy, suggesting good market fit and guest satisfaction.
- Typical properties (Median) have an occupancy rate around 27%.
- Entry-level properties (Bottom 25%) average 11% occupancy, potentially facing higher vacancy.
Average Monthly Occupancy Rate Trend in Firgas
Average Daily Rate (ADR) Airbnb Trends in Firgas (2026)
Effective short term rental pricing strategy in Firgas involves understanding monthly ADR fluctuations. The Average Daily Rate (ADR) for Airbnb in Firgas typically peaks in December and dips lowest during March. Leveraging Airbnb dynamic pricing tools or strategies based on this seasonality can significantly boost revenue. Here's a look at the typical nightly rates achieved:
- Best-in-class properties (Top 10%) command rates of $316+ per night, often due to premium features or locations.
- Strong performing properties (Top 25%) achieve nightly rates of $241 or more.
- Typical properties (Median) charge around $108 per night.
- Entry-level properties (Bottom 25%) earn around $48 per night.
Average Daily Rate (ADR) Trend by Month in Firgas
Get Live Firgas Market Intelligence 👇

Explore Real-time Analytics
Airbnb Seasonality Analysis & Trends in Firgas (2026)
Peak Season (August, December, March)
- Revenue averages $2,175 per month
- Occupancy rates average 39.0%
- Daily rates average $173
Shoulder Season
- Revenue averages $1,330 per month
- Occupancy maintains around 33.6%
- Daily rates hold near $167
Low Season (May, October, November)
- Revenue drops to average $762 per month
- Occupancy decreases to average 27.9%
- Daily rates adjust to average $184
Seasonality Insights for Firgas
- The Airbnb seasonality in Firgas shows highly seasonal trends requiring careful strategy. While the sections above show seasonal averages, it's also insightful to look at the extremes:
- During the high season, the absolute peak month showcases Firgas's highest earning potential, with monthly revenues capable of climbing to $2,559, occupancy reaching a high of 52.5%, and ADRs peaking at $210.
- Conversely, the slowest single month of the year, typically falling within the low season, marks the market's lowest point. In this month, revenue might dip to $503, occupancy could drop to 21.1%, and ADRs may adjust down to $150.
- Understanding both the seasonal averages and these monthly peaks and troughs in revenue, occupancy, and ADR is crucial for maximizing your Airbnb profit potential in Firgas.
Seasonal Strategies for Maximizing Profit
- Peak Season: Maximize revenue through premium pricing and potentially longer minimum stays. Ensure high availability.
- Low Season: Offer competitive pricing, special promotions (e.g., extended stay discounts), and flexible cancellation policies. Target off-season travelers like remote workers or budget-conscious guests.
- Shoulder Seasons: Implement dynamic pricing that balances peak and low rates. Target weekend travelers or specific events. Offer slightly more flexible terms than peak season.
- Regularly analyze your own performance against these Firgas seasonality benchmarks and adjust your pricing and availability strategy accordingly.
Best Areas for Airbnb Investment in Firgas (2026)
Exploring the top neighborhoods for short-term rentals in Firgas? This section highlights key areas, outlining why they are attractive for hosts and guests, along with notable local attractions. Consider these locations based on your target guest profile and investment strategy.
| Neighborhood / Area | Why Host Here? (Target Guests & Appeal) | Key Attractions & Landmarks |
|---|---|---|
| Las Maravillas | A scenic area known for its lush vegetation and natural beauty, ideal for those seeking a rural retreat. It offers picturesque views and tranquility, making it perfect for nature lovers. | Caldera de Bandama, Mount Teide National Park, Local hiking trails |
| Firgas Town Center | The charming town center features historic architecture and a relaxed atmosphere. Visitors can explore local shops, cafes, and cultural sites, making it appealing for a local experience. | Firgas Waterfall, Church of San Roque, Local festivals and events |
| Cruz de Tejeda | A popular viewpoint with stunning views of the surrounding mountains and valleys. It's a hub for hikers and outdoor enthusiasts, making it a great location for adventure seekers. | Roque Nublo, Various hiking routes, Natural parks |
| Tamadaba Natural Park | An area of outstanding natural beauty, perfect for eco-tourism. It's a desirable spot for guests looking to connect with nature and enjoy outdoor activities. | Tamadaba Pine Forest, Hiking paths, Stargazing opportunities |
| Santa Maria de Guia | A vibrant town known for its rich culture and culinary scene. This location is popular among tourists looking to experience local traditions and gastronomy. | Guía Cheese Museum, Local festivals, Charming local markets |
| Moya | A picturesque village with stunning landscapes, it's ideal for those wanting to experience traditional Canarian life while enjoying beautiful views and hiking opportunities. | Moya Botanical Garden, San Bartolomé de Moya Church, Local hiking trails |
| Arucas | Known for its rum distilleries and impressive neo-Gothic church, this town offers a mix of cultural heritage and local tourism. It appeals to visitors seeking a blend of relaxation and exploration. | Arucas Rum Distillery, Church of San Juan Bautista, Cueva de Arucas |
| Valleseco | A tranquil mountain village with a friendly community and beautiful natural surroundings. It's perfect for those looking for a peaceful getaway in nature. | Valleseco Ecological Farm, Local hiking routes, Picnic areas |
Understanding Airbnb License Requirements & STR Laws in Firgas (2026)
Yes, Firgas, Canary Islands, Spain enforces high STR regulations. Obtaining a license and ensuring compliance is almost certainly required according to current 2026 STR laws. Always verify the latest short term rental regulations and Airbnb license requirements directly with local government authorities for Firgas to ensure full compliance before hosting.
(Source: AirROI data, 2026, based on 55% licensed listings)
Top Performing Airbnb Properties in Firgas (2026)
Benchmark your potential! Explore examples of top-performing Airbnb properties in Firgasbased on Trailing Twelve Month (TTM) revenue. Analyze their characteristics, revenue, occupancy rate, and ADR to understand what drives success in this market.
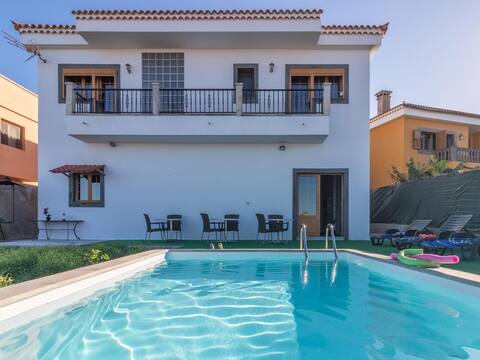
Villa de Pino
Entire Place • 4 bedrooms
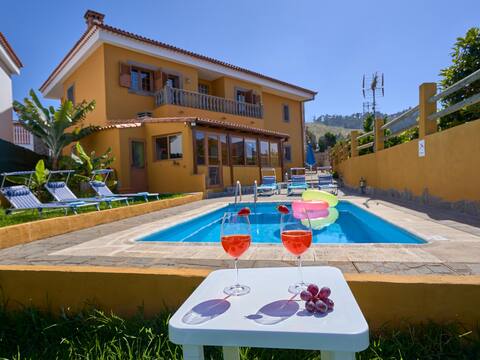
Villa Mami Yaya
Entire Place • 5 bedrooms

Barreto Caves
Entire Place • 6 bedrooms

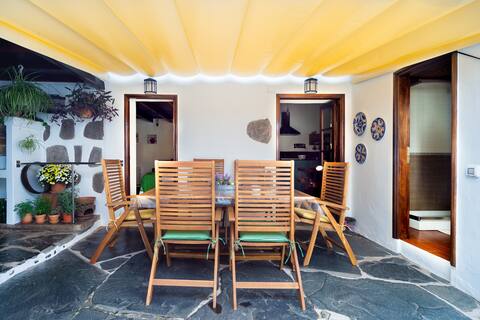
Exclusive silence
Entire Place • 6 bedrooms

Buen Lugar Chicken House
Entire Place • 6 bedrooms
Iconic House La Cuadra
Entire Place • 5 bedrooms
Note: Performance varies based on location, size, amenities, seasonality, and management quality. Data reflects the past 12 months.
Top Performing Airbnb Hosts in Firgas (2026)
Learn from the best! This table showcases top-performing Airbnb hosts in Firgas based on the number of properties managed and estimated total revenue over the past year. Analyze their scale and performance metrics.
| Host Name | Properties | Grossing Revenue | Stay Reviews | Avg Rating |
|---|---|---|---|---|
| Airam | 2 | $87,214 | 71 | 4.66/5.0 |
| Cuevas De Barreto | 1 | $22,922 | 43 | 4.98/5.0 |
| Holidu | 2 | $18,425 | 43 | 4.65/5.0 |
| Barbora | 5 | $15,857 | 232 | 4.72/5.0 |
| Stefan | 1 | $13,724 | 4 | 5.00/5.0 |
| Oliver | 1 | $11,585 | 22 | 5.00/5.0 |
| Casitas Canarias | 1 | $10,243 | 8 | 4.75/5.0 |
| Mario | 1 | $9,398 | 0 | Not Rated |
| Joaquín | 1 | $9,251 | 149 | 4.93/5.0 |
| Juan Carlos | 1 | $6,238 | 4 | 4.75/5.0 |
Analyzing the strategies of top hosts, such as their property selection, pricing, and guest communication, can offer valuable lessons for optimizing your own Airbnb operations in Firgas.
Dive Deeper: Advanced Firgas STR Market Data (2026)
Ready to unlock more insights? AirROI provides access to advanced metrics and comprehensive Airbnb data for Firgas. Explore detailed analytics beyond this report to refine your investment strategy, optimize pricing, and maximize your vacation rental profits.
Explore Advanced MetricsFirgas Short-Term Rental Market Composition (2026): Property & Room Types
Room Type Distribution
Property Type Distribution
Market Composition Insights for Firgas
- The Firgas Airbnb market composition is heavily skewed towards Entire Home/Apt listings, which make up 90% of the 20 active rentals. This indicates strong guest preference for privacy and space.
- Looking at the property type distribution in Firgas, House properties are the most common (65%), reflecting the local real estate landscape.
- Houses represent a significant 65% portion, catering likely to families or larger groups.
Firgas Airbnb Room Capacity Analysis (2026): Bedroom Distribution
Distribution of Listings by Number of Bedrooms
Room Capacity Insights for Firgas
- The dominant room capacity in Firgas is 1 bedroom listings, making up 30% of the market. This suggests a strong demand for properties suitable for couples or solo travelers.
- Together, 1 bedroom and 5+ bedrooms properties represent 55.0% of the active Airbnb listings in Firgas, indicating a high concentration in these sizes.
- A significant 50.0% of listings offer 3+ bedrooms, catering to larger groups and families seeking more space in Firgas.
Firgas Vacation Rental Guest Capacity Trends (2026)
Distribution of Listings by Guest Capacity
Guest Capacity Insights for Firgas
- The most common guest capacity trend in Firgas vacation rentals is listings accommodating 8+ guests (40%). This suggests the primary traveler segment is likely larger groups.
- Properties designed for 8+ guests and 4 guests dominate the Firgas STR market, accounting for 55.0% of listings.
- 45.0% of properties accommodate 6+ guests, serving the market segment for larger families or group travel in Firgas.
- On average, properties in Firgas are equipped to host 5.2 guests.
Firgas Airbnb Booking Patterns (2026): Available vs. Booked Days
Available Days Distribution
Booked Days Distribution
Booking Pattern Insights for Firgas
- The most common availability pattern in Firgas falls within the 271-366 days range, representing 65% of listings. This suggests many properties have significant open periods on their calendars.
- Approximately 85.0% of listings show high availability (181+ days open annually), indicating potential for increased bookings or specific owner usage patterns.
- For booked days, the 31-90 days range is most frequent in Firgas (35%), reflecting common guest stay durations or potential owner blocking patterns.
- A notable 15.0% of properties secure long booking periods (181+ days booked per year), highlighting successful long-term rental strategies or significant owner usage.
Firgas Airbnb Minimum Stay Requirements Analysis
Distribution of Listings by Minimum Night Requirement
1 Night
6 listings
30% of total
2 Nights
3 listings
15% of total
3 Nights
3 listings
15% of total
4-6 Nights
5 listings
25% of total
30+ Nights
3 listings
15% of total
Key Insights
- The most prevalent minimum stay requirement in Firgas is 1 Night, adopted by 30% of listings. This highlights the market's preference for shorter, flexible bookings.
- A significant segment (15%) caters to monthly stays (30+ nights) in Firgas, pointing to opportunities in the extended-stay market.
Recommendations
- Align with the market by considering a 1 Night minimum stay, as 30% of Firgas hosts use this setting.
- Explore offering discounts for stays of 30+ nights to attract the 15% of the market seeking extended stays.
- Adjust minimum nights based on seasonality – potentially shorter during low season and longer during peak demand periods in Firgas.
Firgas Airbnb Cancellation Policy Trends Analysis (2026)
Flexible
5 listings
26.3% of total
Moderate
7 listings
36.8% of total
Firm
7 listings
36.8% of total
Cancellation Policy Insights for Firgas
- The prevailing Airbnb cancellation policy trend in Firgas is Moderate, used by 36.8% of listings.
- There's a relatively balanced mix between guest-friendly (63.1%) and stricter (36.8%) policies, offering choices for different guest needs.
Recommendations for Hosts
- Consider adopting a Moderate policy to align with the 36.8% market standard in Firgas.
- Regularly review your cancellation policy against competitors and market demand shifts in Firgas.
Firgas STR Booking Lead Time Analysis (2026)
Average Booking Lead Time by Month
Booking Lead Time Insights for Firgas
- The overall average booking lead time for vacation rentals in Firgas is 65 days.
- Guests book furthest in advance for stays during January (average 113 days), likely coinciding with peak travel demand or local events.
- The shortest booking windows occur for stays in May (average 28 days), indicating more last-minute travel plans during this time.
- Seasonally, Winter (81 days avg.) sees the longest lead times, while Spring (44 days avg.) has the shortest, reflecting typical travel planning cycles.
Recommendations for Hosts
- Use the overall average lead time (65 days) as a baseline for your pricing and availability strategy in Firgas.
- For January stays, consider implementing length-of-stay discounts or slightly higher rates for bookings made less than 113 days out to capitalize on advance planning.
- Target marketing efforts for the Winter season well in advance (at least 81 days) to capture early planners.
- Monitor your own booking lead times against these Firgas averages to identify opportunities for dynamic pricing adjustments.
Popular & Essential Airbnb Amenities in Firgas (2026)
Amenity Prevalence
Amenity Insights for Firgas
- Essential amenities in Firgas that guests expect include: Kitchen, Wifi. Lacking these (any) could significantly impact bookings.
- Popular amenities like BBQ grill, Bed linens, Free parking on premises are common but not universal. Offering these can provide a competitive edge.
Recommendations for Hosts
- Ensure your listing includes all essential amenities for Firgas: Kitchen, Wifi.
- Prioritize adding missing essentials: Kitchen, Wifi.
- Consider adding popular differentiators like BBQ grill or Bed linens to increase appeal.
- Highlight unique or less common amenities you offer (e.g., hot tub, dedicated workspace, EV charger) in your listing description and photos.
- Regularly check competitor amenities in Firgas to stay competitive.
Firgas Airbnb Guest Demographics & Profile Analysis (2026)
Guest Profile Summary for Firgas
- The typical guest profile for Airbnb in Firgas consists of predominantly international visitors (83%), with top international origins including France, typically belonging to the Post-2000s (Gen Z/Alpha) group (50%), primarily speaking English or German.
- Domestic travelers account for 17.3% of guests.
- Key international markets include Germany (25%) and France (17.3%).
- Top languages spoken are English (36%) followed by German (13.3%).
- A significant demographic segment is the Post-2000s (Gen Z/Alpha) group, representing 50% of guests.
Recommendations for Hosts
- Focus marketing internationally, particularly towards travelers from France.
- Tailor amenities and listing descriptions to appeal to the dominant Post-2000s (Gen Z/Alpha) demographic (e.g., highlight fast WiFi, smart home features, local guides).
- Highlight unique local experiences or amenities relevant to the primary guest profile.
- Consider seasonal promotions aligned with peak travel times for key origin markets.
Nearby Short-Term Rental Market Comparison
How does the Firgas Airbnb market stack up against its neighbors? Compare key performance metrics like average monthly revenue, ADR, and occupancy rates in surrounding areas to understand the broader regional STR landscape.
| Market | Active Properties | Monthly Revenue | Daily Rate | Avg. Occupancy |
|---|---|---|---|---|
| El Sauzal | 96 | $2,763 | $285.50 | 48% |
| Adeje | 3,055 | $2,317 | $209.15 | 49% |
| La Victoria de Acentejo | 25 | $2,232 | $220.99 | 49% |
| Santa Úrsula | 139 | $2,219 | $196.44 | 49% |
| Callao Salvaje | 16 | $2,142 | $217.09 | 49% |
| Amarilla Golf | 11 | $2,109 | $215.55 | 46% |
| Chayofa | 12 | $1,965 | $242.73 | 50% |
| San Miguel de Abona | 700 | $1,879 | $171.11 | 47% |
| El Rosario | 228 | $1,757 | $144.21 | 52% |
| San Bartolomé de Tirajana | 2,777 | $1,756 | $175.79 | 47% |