Laredo Airbnb Market Analysis 2026: Short Term Rental Data & Vacation Rental Statistics in Cantabria, Spain
Is Airbnb profitable in Laredo in 2026? Explore comprehensive Airbnb analytics for Laredo, Cantabria, Spain to uncover income potential. This 2026 STR market report for Laredo, based on AirROI data from February 2025 to January 2026, reveals key trends in the niche market of 150 active listings.
Whether you're considering an Airbnb investment in Laredo, optimizing your existing vacation rental, or exploring rental arbitrage opportunities, understanding the Laredo Airbnb data is crucial. Navigating the high regulation landscape is key to maximizing your short term rental income potential. Let's dive into the specifics.
Key Laredo Airbnb Performance Metrics Overview
Monthly Airbnb Revenue Variations & Income Potential in Laredo (2026)
Understanding the monthly revenue variations for Airbnb listings in Laredo is key to maximizing your short term rental income potential. Seasonality significantly impacts earnings. Our analysis, based on data from the past 12 months, shows that the peak revenue month for STRs in Laredo is typically August, while January often presents the lowest earnings, highlighting opportunities for strategic pricing adjustments during shoulder and low seasons. Explore the typical Airbnb income in Laredo across different performance tiers:
- Best-in-class properties (Top 10%) achieve $3,080+ monthly, often utilizing dynamic pricing and superior guest experiences.
- Strong performing properties (Top 25%) earn $1,923 or more, indicating effective management and desirable locations/amenities.
- Typical properties (Median) generate around $1,117 per month, representing the average market performance.
- Entry-level properties (Bottom 25%) see earnings around $469, often with potential for optimization.
Average Monthly Airbnb Earnings Trend in Laredo
Laredo Airbnb Occupancy Rate Trends (2026)
Maximize your bookings by understanding the Laredo STR occupancy trends. Seasonal demand shifts significantly influence how often properties are booked. Typically, Augustsees the highest demand (peak season occupancy), while January experiences the lowest (low season). Effective strategies, like adjusting minimum stays or offering promotions, can boost occupancy during slower periods. Here's how different property tiers perform in Laredo:
- Best-in-class properties (Top 10%) achieve 69%+ occupancy, indicating high desirability and potentially optimized availability.
- Strong performing properties (Top 25%) maintain 49% or higher occupancy, suggesting good market fit and guest satisfaction.
- Typical properties (Median) have an occupancy rate around 29%.
- Entry-level properties (Bottom 25%) average 11% occupancy, potentially facing higher vacancy.
Average Monthly Occupancy Rate Trend in Laredo
Average Daily Rate (ADR) Airbnb Trends in Laredo (2026)
Effective short term rental pricing strategy in Laredo involves understanding monthly ADR fluctuations. The Average Daily Rate (ADR) for Airbnb in Laredo typically peaks in August and dips lowest during February. Leveraging Airbnb dynamic pricing tools or strategies based on this seasonality can significantly boost revenue. Here's a look at the typical nightly rates achieved:
- Best-in-class properties (Top 10%) command rates of $242+ per night, often due to premium features or locations.
- Strong performing properties (Top 25%) achieve nightly rates of $163 or more.
- Typical properties (Median) charge around $123 per night.
- Entry-level properties (Bottom 25%) earn around $95 per night.
Average Daily Rate (ADR) Trend by Month in Laredo
Get Live Laredo Market Intelligence 👇

Explore Real-time Analytics
Airbnb Seasonality Analysis & Trends in Laredo (2026)
Peak Season (August, July, September)
- Revenue averages $2,547 per month
- Occupancy rates average 47.6%
- Daily rates average $161
Shoulder Season
- Revenue averages $1,199 per month
- Occupancy maintains around 30.5%
- Daily rates hold near $145
Low Season (January, February, December)
- Revenue drops to average $716 per month
- Occupancy decreases to average 21.6%
- Daily rates adjust to average $145
Seasonality Insights for Laredo
- The Airbnb seasonality in Laredo shows highly seasonal trends requiring careful strategy. While the sections above show seasonal averages, it's also insightful to look at the extremes:
- During the high season, the absolute peak month showcases Laredo's highest earning potential, with monthly revenues capable of climbing to $3,213, occupancy reaching a high of 56.0%, and ADRs peaking at $166.
- Conversely, the slowest single month of the year, typically falling within the low season, marks the market's lowest point. In this month, revenue might dip to $573, occupancy could drop to 17.5%, and ADRs may adjust down to $136.
- Understanding both the seasonal averages and these monthly peaks and troughs in revenue, occupancy, and ADR is crucial for maximizing your Airbnb profit potential in Laredo.
Seasonal Strategies for Maximizing Profit
- Peak Season: Maximize revenue through premium pricing and potentially longer minimum stays. Ensure high availability.
- Low Season: Offer competitive pricing, special promotions (e.g., extended stay discounts), and flexible cancellation policies. Target off-season travelers like remote workers or budget-conscious guests.
- Shoulder Seasons: Implement dynamic pricing that balances peak and low rates. Target weekend travelers or specific events. Offer slightly more flexible terms than peak season.
- Regularly analyze your own performance against these Laredo seasonality benchmarks and adjust your pricing and availability strategy accordingly.
Best Areas for Airbnb Investment in Laredo (2026)
Exploring the top neighborhoods for short-term rentals in Laredo? This section highlights key areas, outlining why they are attractive for hosts and guests, along with notable local attractions. Consider these locations based on your target guest profile and investment strategy.
| Neighborhood / Area | Why Host Here? (Target Guests & Appeal) | Key Attractions & Landmarks |
|---|---|---|
| Centro Histórico | The historic center of Laredo, known for its beautiful architecture and rich history. A hub for tourists exploring the town's cultural heritage and charming streets. | Church of Santa María de la Asunción, Laredo Beach, Plaza de la Constitución, Museo de la Ciudad, San Julián Castle |
| La Salvé | A popular beach area known for its extensive sandy beach and vibrant summer atmosphere. Ideal for families and beachgoers looking for a sun-soaked experience in Laredo. | La Salvé Beach, Water sports activities, Beachfront restaurants, Coastal promenade, Campsite areas |
| Laredo Marina | The marina area attracts visitors interested in boating and water sports. The picturesque views and proximity to the sea make it a sought-after location. | Laredo Marina, Boat rentals, Fishing excursions, Scenic views, Nearby seafood restaurants |
| Pueblo de Laredo | Traditional neighborhoods that offer an authentic experience of local culture and life in Laredo. These areas are popular with travelers wanting to immerse themselves in local customs. | Local tapas bars, Artisan shops, Cultural festivals, Historic architecture, Traditional markets |
| Omoño Beach | A quieter beach location that offers a more relaxed alternative to La Salvé, appealing to visitors looking for peace and natural beauty. | Omoño Beach, Walking trails, Natural scenery, Birdwatching opportunities, Snorkeling spots |
| Monte Buciero | A natural area providing stunning views of the coastline and great hiking opportunities. Attracts nature lovers and hikers looking for outdoor activities. | Hiking trails, Natural parks, Panoramic viewpoints, Picnic areas, Flora and fauna observation |
| Paseo de la Playa | Famed for its beautiful promenade along the beachfront, lively in the evenings and ideal for strolling, cycling, or enjoying local restaurants. | Seaside promenade, Restaurants and cafes, Street performers, Sunset views, Skate parks |
| San Andrés | A residential area with a local feel, offering affordable accommodations and a more authentic experience for longer stays. | Local parks, Public transportation access, Community events, Nearby shops and services, Affordable dining options |
Understanding Airbnb License Requirements & STR Laws in Laredo (2026)
Yes, Laredo, Cantabria, Spain enforces high STR regulations. Obtaining a license and ensuring compliance is almost certainly required according to current 2026 STR laws. Always verify the latest short term rental regulations and Airbnb license requirements directly with local government authorities for Laredo to ensure full compliance before hosting.
(Source: AirROI data, 2026, based on 52% licensed listings)
Top Performing Airbnb Properties in Laredo (2026)
Benchmark your potential! Explore examples of top-performing Airbnb properties in Laredobased on Trailing Twelve Month (TTM) revenue. Analyze their characteristics, revenue, occupancy rate, and ADR to understand what drives success in this market.
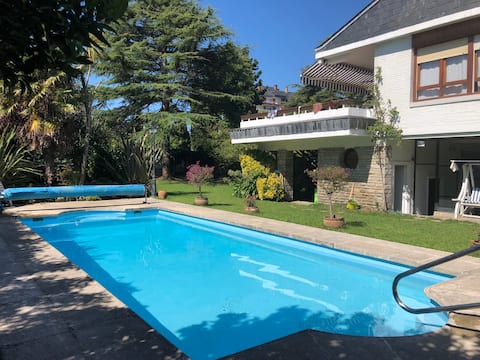
CasaMar Chalet with pool and garden
Entire Place • 5 bedrooms

Casona Cántabra in Laredo
Entire Place • 4 bedrooms
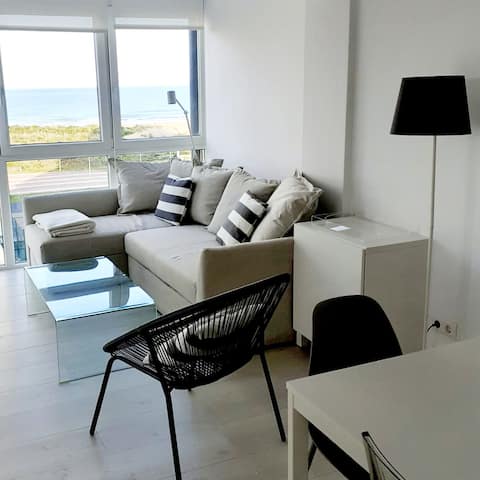
Apartment beachfront
Entire Place • 3 bedrooms

Beach 100 meters away. Spacious villa. Laredo
Entire Place • 4 bedrooms

Magnificent views - Alto de Laredo
Entire Place • 4 bedrooms
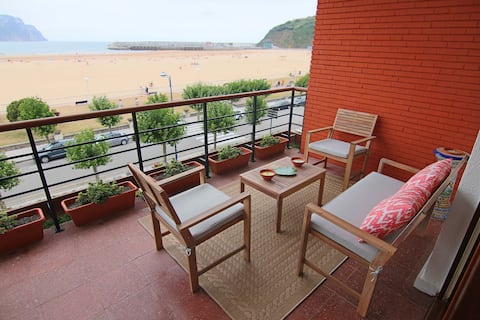
Renovated apartment overlooking Laredo Beach.
Entire Place • 3 bedrooms
Note: Performance varies based on location, size, amenities, seasonality, and management quality. Data reflects the past 12 months.
Top Performing Airbnb Hosts in Laredo (2026)
Learn from the best! This table showcases top-performing Airbnb hosts in Laredo based on the number of properties managed and estimated total revenue over the past year. Analyze their scale and performance metrics.
| Host Name | Properties | Grossing Revenue | Stay Reviews | Avg Rating |
|---|---|---|---|---|
| Turistaria | 5 | $65,938 | 77 | 4.15/5.0 |
| Marcela | 1 | $49,841 | 6 | 5.00/5.0 |
| Arantza Del Norte | 9 | $48,336 | 101 | 3.72/5.0 |
| Ilse Marie | 1 | $48,075 | 16 | 5.00/5.0 |
| Cristina | 1 | $38,802 | 27 | 4.96/5.0 |
| Maria | 2 | $38,098 | 104 | 4.80/5.0 |
| Juan Ramón | 1 | $36,275 | 7 | 4.86/5.0 |
| Maria | 1 | $32,448 | 31 | 4.71/5.0 |
| Gloria | 1 | $31,394 | 21 | 4.90/5.0 |
| Inmohost | 2 | $29,755 | 14 | 4.21/5.0 |
Analyzing the strategies of top hosts, such as their property selection, pricing, and guest communication, can offer valuable lessons for optimizing your own Airbnb operations in Laredo.
Dive Deeper: Advanced Laredo STR Market Data (2026)
Ready to unlock more insights? AirROI provides access to advanced metrics and comprehensive Airbnb data for Laredo. Explore detailed analytics beyond this report to refine your investment strategy, optimize pricing, and maximize your vacation rental profits.
Explore Advanced MetricsLaredo Short-Term Rental Market Composition (2026): Property & Room Types
Room Type Distribution
Property Type Distribution
Market Composition Insights for Laredo
- The Laredo Airbnb market composition is heavily skewed towards Entire Home/Apt listings, which make up 84.7% of the 150 active rentals. This indicates strong guest preference for privacy and space.
- Looking at the property type distribution in Laredo, Apartment/Condo properties are the most common (77.3%), reflecting the local real estate landscape.
- The presence of 7.3% Hotel/Boutique listings indicates integration with traditional hospitality.
- Smaller segments like outdoor/unique (combined 0.7%) offer potential for unique stay experiences.
Laredo Airbnb Room Capacity Analysis (2026): Bedroom Distribution
Distribution of Listings by Number of Bedrooms
Room Capacity Insights for Laredo
- The dominant room capacity in Laredo is 2 bedrooms listings, making up 37.3% of the market. This suggests a strong demand for properties suitable for couples or solo travelers.
- Together, 2 bedrooms and 1 bedroom properties represent 64.6% of the active Airbnb listings in Laredo, indicating a high concentration in these sizes.
- A significant 25.9% of listings offer 3+ bedrooms, catering to larger groups and families seeking more space in Laredo.
Laredo Vacation Rental Guest Capacity Trends (2026)
Distribution of Listings by Guest Capacity
Guest Capacity Insights for Laredo
- The most common guest capacity trend in Laredo vacation rentals is listings accommodating 4 guests (38.7%). This suggests the primary traveler segment is likely small families or groups.
- Properties designed for 4 guests and 6 guests dominate the Laredo STR market, accounting for 54.0% of listings.
- 22.7% of properties accommodate 6+ guests, serving the market segment for larger families or group travel in Laredo.
- On average, properties in Laredo are equipped to host 4.1 guests.
Laredo Airbnb Booking Patterns (2026): Available vs. Booked Days
Available Days Distribution
Booked Days Distribution
Booking Pattern Insights for Laredo
- The most common availability pattern in Laredo falls within the 271-366 days range, representing 66% of listings. This suggests many properties have significant open periods on their calendars.
- Approximately 95.3% of listings show high availability (181+ days open annually), indicating potential for increased bookings or specific owner usage patterns.
- For booked days, the 31-90 days range is most frequent in Laredo (38%), reflecting common guest stay durations or potential owner blocking patterns.
- A notable 6.0% of properties secure long booking periods (181+ days booked per year), highlighting successful long-term rental strategies or significant owner usage.
Laredo Airbnb Minimum Stay Requirements Analysis
Distribution of Listings by Minimum Night Requirement
1 Night
17 listings
11.3% of total
2 Nights
12 listings
8% of total
3 Nights
9 listings
6% of total
4-6 Nights
25 listings
16.7% of total
7-29 Nights
11 listings
7.3% of total
30+ Nights
76 listings
50.7% of total
Key Insights
- The most prevalent minimum stay requirement in Laredo is 30+ Nights, adopted by 50.7% of listings. This highlights the market's preference for longer commitments.
- Very short stays (1-2 nights) are less common (19.3%), suggesting hosts prefer slightly longer bookings to optimize turnover.
- A significant segment (50.7%) caters to monthly stays (30+ nights) in Laredo, pointing to opportunities in the extended-stay market.
Recommendations
- Align with the market by considering a 30+ Nights minimum stay, as 50.7% of Laredo hosts use this setting.
- If feasible, allowing 1-night stays, especially midweek or during low season, could capture last-minute bookings, as only 11.3% currently do.
- Explore offering discounts for stays of 30+ nights to attract the 50.7% of the market seeking extended stays.
- Adjust minimum nights based on seasonality – potentially shorter during low season and longer during peak demand periods in Laredo.
Laredo Airbnb Cancellation Policy Trends Analysis (2026)
Limited
1 listings
0.7% of total
Super Strict 30 Days
1 listings
0.7% of total
Flexible
31 listings
20.9% of total
Moderate
41 listings
27.7% of total
Firm
52 listings
35.1% of total
Strict
22 listings
14.9% of total
Cancellation Policy Insights for Laredo
- The prevailing Airbnb cancellation policy trend in Laredo is Firm, used by 35.1% of listings.
- There's a relatively balanced mix between guest-friendly (48.6%) and stricter (50.0%) policies, offering choices for different guest needs.
Recommendations for Hosts
- Consider adopting a Firm policy to align with the 35.1% market standard in Laredo.
- Using a Strict policy might deter some guests, as only 14.9% of listings use it. Evaluate if potential revenue protection outweighs possible lower booking rates.
- Regularly review your cancellation policy against competitors and market demand shifts in Laredo.
Laredo STR Booking Lead Time Analysis (2026)
Average Booking Lead Time by Month
Booking Lead Time Insights for Laredo
- The overall average booking lead time for vacation rentals in Laredo is 63 days.
- Guests book furthest in advance for stays during August (average 115 days), likely coinciding with peak travel demand or local events.
- The shortest booking windows occur for stays in February (average 20 days), indicating more last-minute travel plans during this time.
- Seasonally, Summer (86 days avg.) sees the longest lead times, while Winter (30 days avg.) has the shortest, reflecting typical travel planning cycles.
Recommendations for Hosts
- Use the overall average lead time (63 days) as a baseline for your pricing and availability strategy in Laredo.
- For August stays, consider implementing length-of-stay discounts or slightly higher rates for bookings made less than 115 days out to capitalize on advance planning.
- Target marketing efforts for the Summer season well in advance (at least 86 days) to capture early planners.
- Monitor your own booking lead times against these Laredo averages to identify opportunities for dynamic pricing adjustments.
Popular & Essential Airbnb Amenities in Laredo (2026)
Amenity Prevalence
Amenity Insights for Laredo
- Essential amenities in Laredo that guests expect include: TV. Lacking these (this) could significantly impact bookings.
- Popular amenities like Kitchen, Washer, Hot water are common but not universal. Offering these can provide a competitive edge.
Recommendations for Hosts
- Ensure your listing includes all essential amenities for Laredo: TV.
- Prioritize adding missing essentials: TV.
- Consider adding popular differentiators like Kitchen or Washer to increase appeal.
- Highlight unique or less common amenities you offer (e.g., hot tub, dedicated workspace, EV charger) in your listing description and photos.
- Regularly check competitor amenities in Laredo to stay competitive.
Laredo Airbnb Guest Demographics & Profile Analysis (2026)
Guest Profile Summary for Laredo
- The typical guest profile for Airbnb in Laredo consists of a mix of domestic (62%) and international guests, often arriving from nearby Madrid, typically belonging to the Post-2000s (Gen Z/Alpha) group (50%), primarily speaking English or Spanish.
- Domestic travelers account for 62.1% of guests.
- Key international markets include Spain (62.1%) and France (11.5%).
- Top languages spoken are English (33.2%) followed by Spanish (31.3%).
- A significant demographic segment is the Post-2000s (Gen Z/Alpha) group, representing 50% of guests.
Recommendations for Hosts
- Target domestic marketing efforts towards travelers from Madrid and Vitoria-Gasteiz.
- Tailor amenities and listing descriptions to appeal to the dominant Post-2000s (Gen Z/Alpha) demographic (e.g., highlight fast WiFi, smart home features, local guides).
- Highlight unique local experiences or amenities relevant to the primary guest profile.
- Consider seasonal promotions aligned with peak travel times for key origin markets.
Nearby Short-Term Rental Market Comparison
How does the Laredo Airbnb market stack up against its neighbors? Compare key performance metrics like average monthly revenue, ADR, and occupancy rates in surrounding areas to understand the broader regional STR landscape.
| Market | Active Properties | Monthly Revenue | Daily Rate | Avg. Occupancy |
|---|---|---|---|---|
| Dima | 11 | $3,301 | $331.95 | 52% |
| Lasarte-Oria | 19 | $2,656 | $197.35 | 43% |
| Gautegiz Arteaga | 15 | $2,600 | $312.72 | 35% |
| Gatika | 10 | $2,596 | $437.05 | 33% |
| Quintanilla Vivar | 14 | $2,434 | $255.43 | 37% |
| Labastida/Bastida | 12 | $2,374 | $220.54 | 33% |
| Getaria | 39 | $2,358 | $223.12 | 34% |
| Bilbao | 1,267 | $2,337 | $187.22 | 48% |
| Merindad de Sotoscueva | 11 | $2,194 | $245.63 | 38% |
| Hermandad de Campoo de Suso | 30 | $2,144 | $393.46 | 24% |