Toro Airbnb Market Analysis 2026: Short Term Rental Data & Vacation Rental Statistics in Castile and León, Spain
Is Airbnb profitable in Toro in 2026? Explore comprehensive Airbnb analytics for Toro, Castile and León, Spain to uncover income potential. This 2026 STR market report for Toro, based on AirROI data from December 2024 to November 2025, reveals key trends in the niche market of 19 active listings.
Whether you're considering an Airbnb investment in Toro, optimizing your existing vacation rental, or exploring rental arbitrage opportunities, understanding the Toro Airbnb data is crucial. Navigating the high regulation landscape is key to maximizing your short term rental income potential. Let's dive into the specifics.
Key Toro Airbnb Performance Metrics Overview
Monthly Airbnb Revenue Variations & Income Potential in Toro (2026)
Understanding the monthly revenue variations for Airbnb listings in Toro is key to maximizing your short term rental income potential. Seasonality significantly impacts earnings. Our analysis, based on data from the past 12 months, shows that the peak revenue month for STRs in Toro is typically May, while November often presents the lowest earnings, highlighting opportunities for strategic pricing adjustments during shoulder and low seasons. Explore the typical Airbnb income in Toro across different performance tiers:
- Best-in-class properties (Top 10%) achieve $2,488+ monthly, often utilizing dynamic pricing and superior guest experiences.
- Strong performing properties (Top 25%) earn $1,357 or more, indicating effective management and desirable locations/amenities.
- Typical properties (Median) generate around $559 per month, representing the average market performance.
- Entry-level properties (Bottom 25%) see earnings around $383, often with potential for optimization.
Average Monthly Airbnb Earnings Trend in Toro
Toro Airbnb Occupancy Rate Trends (2026)
Maximize your bookings by understanding the Toro STR occupancy trends. Seasonal demand shifts significantly influence how often properties are booked. Typically, Maysees the highest demand (peak season occupancy), while July experiences the lowest (low season). Effective strategies, like adjusting minimum stays or offering promotions, can boost occupancy during slower periods. Here's how different property tiers perform in Toro:
- Best-in-class properties (Top 10%) achieve 53%+ occupancy, indicating high desirability and potentially optimized availability.
- Strong performing properties (Top 25%) maintain 38% or higher occupancy, suggesting good market fit and guest satisfaction.
- Typical properties (Median) have an occupancy rate around 21%.
- Entry-level properties (Bottom 25%) average 13% occupancy, potentially facing higher vacancy.
Average Monthly Occupancy Rate Trend in Toro
Average Daily Rate (ADR) Airbnb Trends in Toro (2026)
Effective short term rental pricing strategy in Toro involves understanding monthly ADR fluctuations. The Average Daily Rate (ADR) for Airbnb in Toro typically peaks in August and dips lowest during February. Leveraging Airbnb dynamic pricing tools or strategies based on this seasonality can significantly boost revenue. Here's a look at the typical nightly rates achieved:
- Best-in-class properties (Top 10%) command rates of $278+ per night, often due to premium features or locations.
- Strong performing properties (Top 25%) achieve nightly rates of $157 or more.
- Typical properties (Median) charge around $106 per night.
- Entry-level properties (Bottom 25%) earn around $71 per night.
Average Daily Rate (ADR) Trend by Month in Toro
Get Live Toro Market Intelligence 👇

Explore Real-time Analytics
Airbnb Seasonality Analysis & Trends in Toro (2025)
Peak Season (May, October, December)
- Revenue averages $1,432 per month
- Occupancy rates average 36.0%
- Daily rates average $133
Shoulder Season
- Revenue averages $952 per month
- Occupancy maintains around 25.4%
- Daily rates hold near $131
Low Season (June, July, November)
- Revenue drops to average $556 per month
- Occupancy decreases to average 18.2%
- Daily rates adjust to average $137
Seasonality Insights for Toro
- The Airbnb seasonality in Toro shows highly seasonal trends requiring careful strategy. While the sections above show seasonal averages, it's also insightful to look at the extremes:
- During the high season, the absolute peak month showcases Toro's highest earning potential, with monthly revenues capable of climbing to $1,763, occupancy reaching a high of 52.2%, and ADRs peaking at $141.
- Conversely, the slowest single month of the year, typically falling within the low season, marks the market's lowest point. In this month, revenue might dip to $452, occupancy could drop to 15.6%, and ADRs may adjust down to $126.
- Understanding both the seasonal averages and these monthly peaks and troughs in revenue, occupancy, and ADR is crucial for maximizing your Airbnb profit potential in Toro.
Seasonal Strategies for Maximizing Profit
- Peak Season: Maximize revenue through premium pricing and potentially longer minimum stays. Ensure high availability.
- Low Season: Offer competitive pricing, special promotions (e.g., extended stay discounts), and flexible cancellation policies. Target off-season travelers like remote workers or budget-conscious guests.
- Shoulder Seasons: Implement dynamic pricing that balances peak and low rates. Target weekend travelers or specific events. Offer slightly more flexible terms than peak season.
- Regularly analyze your own performance against these Toro seasonality benchmarks and adjust your pricing and availability strategy accordingly.
Best Areas for Airbnb Investment in Toro (2026)
Exploring the top neighborhoods for short-term rentals in Toro? This section highlights key areas, outlining why they are attractive for hosts and guests, along with notable local attractions. Consider these locations based on your target guest profile and investment strategy.
| Neighborhood / Area | Why Host Here? (Target Guests & Appeal) | Key Attractions & Landmarks |
|---|---|---|
| Plaza Mayor | The heart of Toro, with its bustling atmosphere and historical significance. A prime location for tourists wanting to experience the local culture, shops, and cuisine. | Plaza Mayor, Iglesia de San Salvador, Museo del Vino, Bodega La Italiana, Paseo de los Templarios |
| Castle of Toro | An iconic landmark offering stunning views and rich history. A great spot for history enthusiasts and photographers. | Castillo de Toro, Convent of San Francisco, Church of San Pedro, Museo de la Semana Santa |
| Bodega La Italiana | Famous for its wines and great for wine tourism. Attracts many visitors seeking to explore the local wine culture. | Bodega La Italiana, Wine tasting tours, Toro Wine Route, Cultural events, Local gastronomy |
| Historic Center | Offers cobbled streets and charming architecture, providing an authentic ambiance for guests. Ideal for those seeking a picturesque stay. | Iglesia de San Sebastián, Casa de los Condes de Requena, Templar Church, Local artisan shops, Historical landmarks |
| Parque de los Reyes | A peaceful park that serves as a green escape for visitors and locals alike. Attracts families and those looking to relax in nature. | Beautiful gardens, Play areas, Relaxing walking paths, Local flowers, Outdoor events |
| Cultural Events Area | Hosting various festivals and cultural events throughout the year, making it a lively spot for tourists. | Toro Wine Festival, Semana Santa, Local art exhibitions, Food fairs, Traditional music performances |
| Local Gastronomy District | Known for its excellent restaurants and tapas bars. Perfect for food lovers looking to experience Toro's culinary delights. | Local tapas bars, Restaurants featuring traditional dishes, Cooking classes, Food tours, Wine pairing experiences |
| Winery District | Surrounded by esteemed wineries, offering tours and tastings that attract wine enthusiasts from all over. | Various wineries, Vineyard tours, Wine tasting experiences, Stunning vineyard landscapes, Culinary pairings with wine |
Understanding Airbnb License Requirements & STR Laws in Toro (2026)
Yes, Toro, Castile and León, Spain enforces high STR regulations. Obtaining a license and ensuring compliance is almost certainly required according to current 2026 STR laws. Always verify the latest short term rental regulations and Airbnb license requirements directly with local government authorities for Toro to ensure full compliance before hosting.
(Source: AirROI data, 2026, based on 32% licensed listings)
Top Performing Airbnb Properties in Toro (2026)
Benchmark your potential! Explore examples of top-performing Airbnb properties in Torobased on Trailing Twelve Month (TTM) revenue. Analyze their characteristics, revenue, occupancy rate, and ADR to understand what drives success in this market.

Beautiful and cozy newly built house
Entire Place • 3 bedrooms
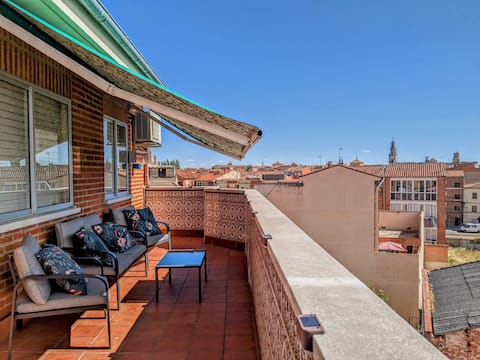
Penthouse in downtown Toro with garage
Entire Place • 2 bedrooms
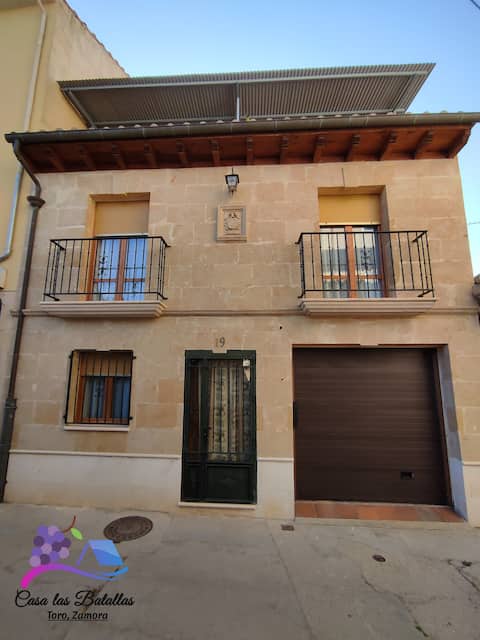
Casa las Batallas
Entire Place • 4 bedrooms
Penthouse in Toro - Parque de La Golosina
Entire Place • 2 bedrooms
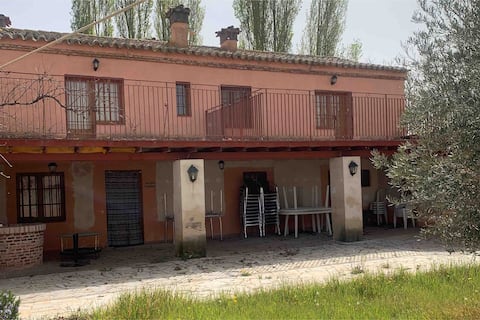
Rural apartments
Entire Place • 8 bedrooms
Rural Apartments Maíces-Garzas-Pinare
Entire Place • 7 bedrooms
Note: Performance varies based on location, size, amenities, seasonality, and management quality. Data reflects the past 12 months.
Top Performing Airbnb Hosts in Toro (2026)
Learn from the best! This table showcases top-performing Airbnb hosts in Toro based on the number of properties managed and estimated total revenue over the past year. Analyze their scale and performance metrics.
| Host Name | Properties | Grossing Revenue | Stay Reviews | Avg Rating |
|---|---|---|---|---|
| Beatriz | 1 | $27,944 | 21 | 4.90/5.0 |
| Pablo José | 4 | $13,912 | 6 | Not Rated |
| Manuel De La Torre | 8 | $13,519 | 72 | 4.88/5.0 |
| Raquel | 1 | $11,943 | 13 | 4.92/5.0 |
| José | 1 | $10,676 | 8 | 5.00/5.0 |
| Manuel | 1 | $10,503 | 24 | 4.92/5.0 |
| Nicola | 2 | $6,086 | 3 | 5.00/5.0 |
| Manuela | 1 | $4,518 | 133 | 4.77/5.0 |
Analyzing the strategies of top hosts, such as their property selection, pricing, and guest communication, can offer valuable lessons for optimizing your own Airbnb operations in Toro.
Dive Deeper: Advanced Toro STR Market Data (2026)
Ready to unlock more insights? AirROI provides access to advanced metrics and comprehensive Airbnb data for Toro. Explore detailed analytics beyond this report to refine your investment strategy, optimize pricing, and maximize your vacation rental profits.
Explore Advanced MetricsToro Short-Term Rental Market Composition (2026): Property & Room Types
Room Type Distribution
Property Type Distribution
Market Composition Insights for Toro
- The Toro Airbnb market composition is heavily skewed towards Entire Home/Apt listings, which make up 63.2% of the 19 active rentals. This indicates strong guest preference for privacy and space.
- However, a notable 36.8% share for Private Rooms suggests opportunities for budget-conscious travelers or hosts renting out spare rooms.
- Looking at the property type distribution in Toro, Apartment/Condo properties are the most common (57.9%), reflecting the local real estate landscape.
- Houses represent a significant 15.8% portion, catering likely to families or larger groups.
- The presence of 26.3% Hotel/Boutique listings indicates integration with traditional hospitality.
Toro Airbnb Room Capacity Analysis (2026): Bedroom Distribution
Distribution of Listings by Number of Bedrooms
Room Capacity Insights for Toro
- The dominant room capacity in Toro is 2 bedrooms listings, making up 36.8% of the market. This suggests a strong demand for properties suitable for couples or solo travelers.
- Together, 2 bedrooms and 1 bedroom properties represent 68.4% of the active Airbnb listings in Toro, indicating a high concentration in these sizes.
- A significant 26.3% of listings offer 3+ bedrooms, catering to larger groups and families seeking more space in Toro.
Toro Vacation Rental Guest Capacity Trends (2026)
Distribution of Listings by Guest Capacity
Guest Capacity Insights for Toro
- The most common guest capacity trend in Toro vacation rentals is listings accommodating 2 guests (21.1%). This suggests the primary traveler segment is likely couples or solo travelers.
- Properties designed for 2 guests and 5 guests dominate the Toro STR market, accounting for 42.2% of listings.
- 26.3% of properties accommodate 6+ guests, serving the market segment for larger families or group travel in Toro.
- On average, properties in Toro are equipped to host 4.1 guests.
Toro Airbnb Booking Patterns (2026): Available vs. Booked Days
Available Days Distribution
Booked Days Distribution
Booking Pattern Insights for Toro
- The most common availability pattern in Toro falls within the 271-366 days range, representing 89.5% of listings. This suggests many properties have significant open periods on their calendars.
- Approximately 94.8% of listings show high availability (181+ days open annually), indicating potential for increased bookings or specific owner usage patterns.
- For booked days, the 1-30 days range is most frequent in Toro (63.2%), reflecting common guest stay durations or potential owner blocking patterns.
- A notable 5.3% of properties secure long booking periods (181+ days booked per year), highlighting successful long-term rental strategies or significant owner usage.
Toro Airbnb Minimum Stay Requirements Analysis
Distribution of Listings by Minimum Night Requirement
1 Night
9 listings
47.4% of total
2 Nights
7 listings
36.8% of total
30+ Nights
3 listings
15.8% of total
Key Insights
- The most prevalent minimum stay requirement in Toro is 1 Night, adopted by 47.4% of listings. This highlights the market's preference for shorter, flexible bookings.
- A strong majority (84.2%) of the Toro Airbnb data shows acceptance of very short stays (1-2 nights), indicating a dynamic, high-turnover market.
- A significant segment (15.8%) caters to monthly stays (30+ nights) in Toro, pointing to opportunities in the extended-stay market.
Recommendations
- Align with the market by considering a 1 Night minimum stay, as 47.4% of Toro hosts use this setting.
- Explore offering discounts for stays of 30+ nights to attract the 15.8% of the market seeking extended stays.
- Adjust minimum nights based on seasonality – potentially shorter during low season and longer during peak demand periods in Toro.
Toro Airbnb Cancellation Policy Trends Analysis (2026)
Flexible
4 listings
22.2% of total
Moderate
5 listings
27.8% of total
Firm
1 listings
5.6% of total
Strict
8 listings
44.4% of total
Cancellation Policy Insights for Toro
- The prevailing Airbnb cancellation policy trend in Toro is Strict, used by 44.4% of listings.
- There's a relatively balanced mix between guest-friendly (50.0%) and stricter (50.0%) policies, offering choices for different guest needs.
Recommendations for Hosts
- Consider adopting a Strict policy to align with the 44.4% market standard in Toro.
- With 44.4% using Strict terms, this is a viable option in Toro, particularly for high-value properties or during peak demand periods.
- Regularly review your cancellation policy against competitors and market demand shifts in Toro.
Toro STR Booking Lead Time Analysis (2026)
Average Booking Lead Time by Month
Booking Lead Time Insights for Toro
- The overall average booking lead time for vacation rentals in Toro is 45 days.
- Guests book furthest in advance for stays during May (average 87 days), likely coinciding with peak travel demand or local events.
- The shortest booking windows occur for stays in January (average 20 days), indicating more last-minute travel plans during this time.
- Seasonally, Fall (75 days avg.) sees the longest lead times, while Winter (38 days avg.) has the shortest, reflecting typical travel planning cycles.
Recommendations for Hosts
- Use the overall average lead time (45 days) as a baseline for your pricing and availability strategy in Toro.
- For May stays, consider implementing length-of-stay discounts or slightly higher rates for bookings made less than 87 days out to capitalize on advance planning.
- Target marketing efforts for the Fall season well in advance (at least 75 days) to capture early planners.
- Monitor your own booking lead times against these Toro averages to identify opportunities for dynamic pricing adjustments.
Popular & Essential Airbnb Amenities in Toro (2026)
Amenity Prevalence
Amenity Insights for Toro
- Essential amenities in Toro that guests expect include: TV. Lacking these (this) could significantly impact bookings.
- Popular amenities like Essentials, Heating, Hot water are common but not universal. Offering these can provide a competitive edge.
- Warning: Wifi is not universally provided but is considered essential globally. Ensure reliable Wifi is offered.
Recommendations for Hosts
- Ensure your listing includes all essential amenities for Toro: TV.
- Consider adding popular differentiators like Essentials or Heating to increase appeal.
- Highlight unique or less common amenities you offer (e.g., hot tub, dedicated workspace, EV charger) in your listing description and photos.
- Regularly check competitor amenities in Toro to stay competitive.
Toro Airbnb Guest Demographics & Profile Analysis (2026)
Guest Profile Summary for Toro
- The typical guest profile for Airbnb in Toro consists of a mix of domestic (57%) and international guests, often arriving from nearby Madrid, typically belonging to the Post-2000s (Gen Z/Alpha) group (50%), primarily speaking Spanish or English.
- Domestic travelers account for 57.1% of guests.
- Key international markets include Spain (57.1%) and Belgium (9.5%).
- Top languages spoken are Spanish (36.8%) followed by English (31.6%).
- A significant demographic segment is the Post-2000s (Gen Z/Alpha) group, representing 50% of guests.
Recommendations for Hosts
- Balance marketing efforts between domestic and international channels based on the guest mix.
- Tailor amenities and listing descriptions to appeal to the dominant Post-2000s (Gen Z/Alpha) demographic (e.g., highlight fast WiFi, smart home features, local guides).
- Highlight unique local experiences or amenities relevant to the primary guest profile.
- Consider seasonal promotions aligned with peak travel times for key origin markets.
Nearby Short-Term Rental Market Comparison
How does the Toro Airbnb market stack up against its neighbors? Compare key performance metrics like average monthly revenue, ADR, and occupancy rates in surrounding areas to understand the broader regional STR landscape.
| Market | Active Properties | Monthly Revenue | Daily Rate | Avg. Occupancy |
|---|---|---|---|---|
| Robledo de Chavela | 24 | $3,356 | $291.69 | 40% |
| Alpedrete | 14 | $2,886 | $285.77 | 35% |
| Santa Cruz del Retamar | 12 | $2,863 | $455.40 | 28% |
| El Espinar | 34 | $2,846 | $342.03 | 34% |
| Pelayos de la Presa | 12 | $2,834 | $283.10 | 36% |
| Méntrida | 13 | $2,792 | $367.49 | 31% |
| Valdemorillo | 22 | $2,737 | $383.85 | 37% |
| Ortigosa del Monte | 12 | $2,712 | $329.83 | 35% |
| Collado Mediano | 14 | $2,658 | $228.21 | 38% |
| Navacerrada | 21 | $2,604 | $316.89 | 31% |