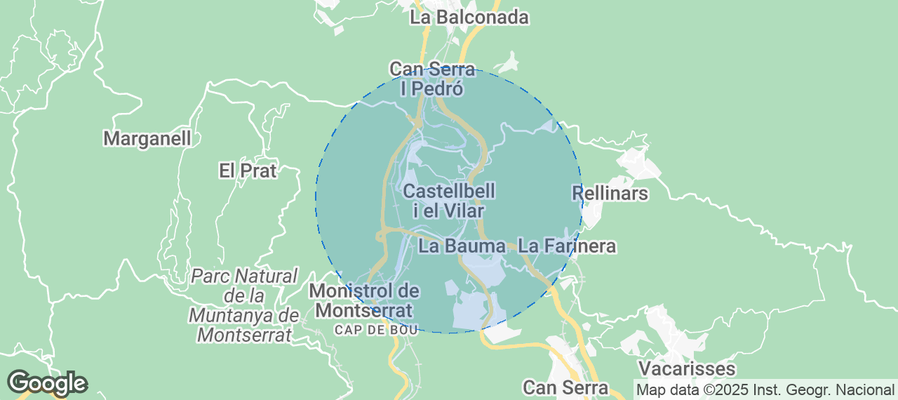
Castellbell i el Vilar Airbnb Market Analysis 2026: Short Term Rental Data & Vacation Rental Statistics in Catalonia, Spain
Is Airbnb profitable in Castellbell i el Vilar in 2026? Explore comprehensive Airbnb analytics for Castellbell i el Vilar, Catalonia, Spain to uncover income potential. This 2026 STR market report for Castellbell i el Vilar, based on AirROI data from March 2024 to February 2025, reveals key trends in the niche market of 17 active listings.
Whether you're considering an Airbnb investment in Castellbell i el Vilar, optimizing your existing vacation rental, or exploring rental arbitrage opportunities, understanding the Castellbell i el Vilar Airbnb data is crucial. Navigating the high regulation landscape is key to maximizing your short term rental income potential. Let's dive into the specifics.
Key Castellbell i el Vilar Airbnb Performance Metrics Overview
Monthly Airbnb Revenue Variations & Income Potential in Castellbell i el Vilar (2026)
Understanding the monthly revenue variations for Airbnb listings in Castellbell i el Vilar is key to maximizing your short term rental income potential. Seasonality significantly impacts earnings. Our analysis, based on data from the past 12 months, shows that the peak revenue month for STRs in Castellbell i el Vilar is typically August, while January often presents the lowest earnings, highlighting opportunities for strategic pricing adjustments during shoulder and low seasons. Explore the typical Airbnb income in Castellbell i el Vilar across different performance tiers:
- Best-in-class properties (Top 10%) achieve $4,668+ monthly, often utilizing dynamic pricing and superior guest experiences.
- Strong performing properties (Top 25%) earn $2,512 or more, indicating effective management and desirable locations/amenities.
- Typical properties (Median) generate around $1,439 per month, representing the average market performance.
- Entry-level properties (Bottom 25%) see earnings around $808, often with potential for optimization.
Average Monthly Airbnb Earnings Trend in Castellbell i el Vilar
Castellbell i el Vilar Airbnb Occupancy Rate Trends (2026)
Maximize your bookings by understanding the Castellbell i el Vilar STR occupancy trends. Seasonal demand shifts significantly influence how often properties are booked. Typically, Octobersees the highest demand (peak season occupancy), while April experiences the lowest (low season). Effective strategies, like adjusting minimum stays or offering promotions, can boost occupancy during slower periods. Here's how different property tiers perform in Castellbell i el Vilar:
- Best-in-class properties (Top 10%) achieve 70%+ occupancy, indicating high desirability and potentially optimized availability.
- Strong performing properties (Top 25%) maintain 51% or higher occupancy, suggesting good market fit and guest satisfaction.
- Typical properties (Median) have an occupancy rate around 34%.
- Entry-level properties (Bottom 25%) average 20% occupancy, potentially facing higher vacancy.
Average Monthly Occupancy Rate Trend in Castellbell i el Vilar
Average Daily Rate (ADR) Airbnb Trends in Castellbell i el Vilar (2026)
Effective short term rental pricing strategy in Castellbell i el Vilar involves understanding monthly ADR fluctuations. The Average Daily Rate (ADR) for Airbnb in Castellbell i el Vilar typically peaks in August and dips lowest during May. Leveraging Airbnb dynamic pricing tools or strategies based on this seasonality can significantly boost revenue. Here's a look at the typical nightly rates achieved:
- Best-in-class properties (Top 10%) command rates of $395+ per night, often due to premium features or locations.
- Strong performing properties (Top 25%) achieve nightly rates of $206 or more.
- Typical properties (Median) charge around $128 per night.
- Entry-level properties (Bottom 25%) earn around $85 per night.
Average Daily Rate (ADR) Trend by Month in Castellbell i el Vilar
Get Live Castellbell i el Vilar Market Intelligence 👇
Explore Real-time Analytics
Airbnb Seasonality Analysis & Trends in Castellbell i el Vilar (2025)
Peak Season (August, July, May)
- Revenue averages $3,329 per month
- Occupancy rates average 48.5%
- Daily rates average $217
Shoulder Season
- Revenue averages $1,985 per month
- Occupancy maintains around 35.0%
- Daily rates hold near $182
Low Season (January, September, November)
- Revenue drops to average $1,445 per month
- Occupancy decreases to average 31.3%
- Daily rates adjust to average $187
Seasonality Insights for Castellbell i el Vilar
- The Airbnb seasonality in Castellbell i el Vilar shows highly seasonal trends requiring careful strategy. While the sections above show seasonal averages, it's also insightful to look at the extremes:
- During the high season, the absolute peak month showcases Castellbell i el Vilar's highest earning potential, with monthly revenues capable of climbing to $4,192, occupancy reaching a high of 51.1%, and ADRs peaking at $250.
- Conversely, the slowest single month of the year, typically falling within the low season, marks the market's lowest point. In this month, revenue might dip to $1,189, occupancy could drop to 24.0%, and ADRs may adjust down to $171.
- Understanding both the seasonal averages and these monthly peaks and troughs in revenue, occupancy, and ADR is crucial for maximizing your Airbnb profit potential in Castellbell i el Vilar.
Seasonal Strategies for Maximizing Profit
- Peak Season: Maximize revenue through premium pricing and potentially longer minimum stays. Ensure high availability.
- Low Season: Offer competitive pricing, special promotions (e.g., extended stay discounts), and flexible cancellation policies. Target off-season travelers like remote workers or budget-conscious guests.
- Shoulder Seasons: Implement dynamic pricing that balances peak and low rates. Target weekend travelers or specific events. Offer slightly more flexible terms than peak season.
- Regularly analyze your own performance against these Castellbell i el Vilar seasonality benchmarks and adjust your pricing and availability strategy accordingly.
Best Areas for Airbnb Investment in Castellbell i el Vilar (2026)
Exploring the top neighborhoods for short-term rentals in Castellbell i el Vilar? This section highlights key areas, outlining why they are attractive for hosts and guests, along with notable local attractions. Consider these locations based on your target guest profile and investment strategy.
| Neighborhood / Area | Why Host Here? (Target Guests & Appeal) | Key Attractions & Landmarks |
|---|---|---|
| Castellbell i el Vilar Center | The central area of Castellbell i el Vilar offers easy access to local amenities and is close to transportation links. It attracts visitors who are looking to explore both the town and nearby attractions. | Parc Natural de Sant Llorenç del Munt i l'Obac, Castell de Castellbell, Coves del Salnitre, local shops and cafes |
| Nearby Montserrat | The famous Montserrat mountain and monastery attract many tourists. Investing in Airbnb properties near this area can capture visitors looking for proximity to this iconic site. | Montserrat Monastery, Sant Joan Funicular, Sant Jeroni hiking trail, Santa Maria de Montserrat Museum |
| Sant Vicenç de Castellet | A nearby town with a charming environment, offering a quiet retreat for travelers. It's ideal for those who enjoy rural tourism and nature. | Parc de la kawasan, Sant Vicenç de Castellet train station, local parks and hiking trails |
| Vacation Homes in Nature | The surroundings of Castellbell i el Vilar provide opportunities for nature lovers looking for vacation homes, featuring beautiful landscapes and hiking paths. | Natural parks, beautiful hiking trails, scenic views |
| Cultural Excursions to Manresa | Manresa is a nearby larger city known for its rich history and culture. Guests may prefer staying near Castellbell i el Vilar for easy access to this cultural hub. | Basílica de Santa Maria de la Seu, Cova de Sant Ignasi, Manresa Museum, local historical tours |
| Rural Experiences | There is a growing trend for rural tourism, where guests seek authentic experiences in the countryside, making rural properties an attractive investment opportunity. | Countryside tours, local farmer markets, traditional cuisine experiences |
| Festival and Events Hub | Castellbell i el Vilar hosts various local festivals that attract visitors throughout the year. Accommodations nearby can cater to event-goers looking for convenience. | Local cultural festivals, markets, community events |
| Proximity to the City of Barcelona | Given its distance from Barcelona, Castellbell i el Vilar serves as a quieter alternative for visitors attending events in the big city, providing an appealing retreat. | Easy train access to Barcelona, day trips to the city, exploring nearby countryside |
Understanding Airbnb License Requirements & STR Laws in Castellbell i el Vilar (2026)
Yes, Castellbell i el Vilar, Catalonia, Spain enforces high STR regulations. Obtaining a license and ensuring compliance is almost certainly required according to current 2026 STR laws. Always verify the latest short term rental regulations and Airbnb license requirements directly with local government authorities for Castellbell i el Vilar to ensure full compliance before hosting.
(Source: AirROI data, 2026, based on 59% licensed listings)
Top Performing Airbnb Properties in Castellbell i el Vilar (2026)
Benchmark your potential! Explore examples of top-performing Airbnb properties in Castellbell i el Vilarbased on Trailing Twelve Month (TTM) revenue. Analyze their characteristics, revenue, occupancy rate, and ADR to understand what drives success in this market.

Masia Can Castanyola
Entire Place • 8 bedrooms

Fantastic house with land, at the foot of Montserrat
Entire Place • 4 bedrooms

Apartament with spectacular landscape
Entire Place • 2 bedrooms

Apartment near Montserrat with train access
Entire Place • 2 bedrooms
Amazing loft at the foot of Montserrat,
Entire Place • 1 bedroom
Stylish loft in Montserrat
Entire Place • 1 bedroom
Note: Performance varies based on location, size, amenities, seasonality, and management quality. Data reflects the past 12 months.
Top Performing Airbnb Hosts in Castellbell i el Vilar (2026)
Learn from the best! This table showcases top-performing Airbnb hosts in Castellbell i el Vilar based on the number of properties managed and estimated total revenue over the past year. Analyze their scale and performance metrics.
| Host Name | Properties | Grossing Revenue | Stay Reviews | Avg Rating |
|---|---|---|---|---|
| Jordi | 1 | $93,069 | 54 | 4.72/5.0 |
| Olga | 4 | $62,466 | 220 | 4.93/5.0 |
| Alba | 1 | $53,967 | 73 | 4.78/5.0 |
| Joan | 1 | $37,319 | 121 | 4.65/5.0 |
| Carles | 4 | $37,058 | 397 | 4.88/5.0 |
| Michael | 2 | $27,813 | 36 | 2.44/5.0 |
| Homerez | 1 | $12,849 | 11 | 4.64/5.0 |
| Host #146787374 | 1 | $10,784 | 13 | 4.46/5.0 |
| Cristhian | 1 | $7,299 | 6 | 4.33/5.0 |
| Host #19083971 | 1 | $1,584 | 68 | 4.99/5.0 |
Analyzing the strategies of top hosts, such as their property selection, pricing, and guest communication, can offer valuable lessons for optimizing your own Airbnb operations in Castellbell i el Vilar.
Dive Deeper: Advanced Castellbell i el Vilar STR Market Data (2026)
Ready to unlock more insights? AirROI provides access to advanced metrics and comprehensive Airbnb data for Castellbell i el Vilar. Explore detailed analytics beyond this report to refine your investment strategy, optimize pricing, and maximize your vacation rental profits.
Explore Advanced MetricsCastellbell i el Vilar Short-Term Rental Market Composition (2026): Property & Room Types
Room Type Distribution
Property Type Distribution
Market Composition Insights for Castellbell i el Vilar
- The Castellbell i el Vilar Airbnb market composition is heavily skewed towards Entire Home/Apt listings, which make up 88.2% of the 17 active rentals. This indicates strong guest preference for privacy and space.
- Looking at the property type distribution in Castellbell i el Vilar, House properties are the most common (52.9%), reflecting the local real estate landscape.
- Houses represent a significant 52.9% portion, catering likely to families or larger groups.
Castellbell i el Vilar Airbnb Room Capacity Analysis (2026): Bedroom Distribution
Distribution of Listings by Number of Bedrooms
Room Capacity Insights for Castellbell i el Vilar
- The dominant room capacity in Castellbell i el Vilar is 1 bedroom listings, making up 47.1% of the market. This suggests a strong demand for properties suitable for couples or solo travelers.
- Together, 1 bedroom and 2 bedrooms properties represent 76.5% of the active Airbnb listings in Castellbell i el Vilar, indicating a high concentration in these sizes.
Castellbell i el Vilar Vacation Rental Guest Capacity Trends (2026)
Distribution of Listings by Guest Capacity
Guest Capacity Insights for Castellbell i el Vilar
- The most common guest capacity trend in Castellbell i el Vilar vacation rentals is listings accommodating 2 guests (35.3%). This suggests the primary traveler segment is likely couples or solo travelers.
- Properties designed for 2 guests and 6 guests dominate the Castellbell i el Vilar STR market, accounting for 58.8% of listings.
- 41.1% of properties accommodate 6+ guests, serving the market segment for larger families or group travel in Castellbell i el Vilar.
- On average, properties in Castellbell i el Vilar are equipped to host 4.2 guests.
Castellbell i el Vilar Airbnb Booking Patterns (2026): Available vs. Booked Days
Available Days Distribution
Booked Days Distribution
Booking Pattern Insights for Castellbell i el Vilar
- The most common availability pattern in Castellbell i el Vilar falls within the 181-270 days range, representing 52.9% of listings. This suggests many properties have significant open periods on their calendars.
- Approximately 82.3% of listings show high availability (181+ days open annually), indicating potential for increased bookings or specific owner usage patterns.
- For booked days, the 91-180 days range is most frequent in Castellbell i el Vilar (52.9%), reflecting common guest stay durations or potential owner blocking patterns.
- A notable 17.7% of properties secure long booking periods (181+ days booked per year), highlighting successful long-term rental strategies or significant owner usage.
Castellbell i el Vilar Airbnb Minimum Stay Requirements Analysis
Distribution of Listings by Minimum Night Requirement
1 Night
6 listings
42.9% of total
2 Nights
6 listings
42.9% of total
3 Nights
1 listings
7.1% of total
30+ Nights
1 listings
7.1% of total
Key Insights
- The most prevalent minimum stay requirement in Castellbell i el Vilar is 1 Night, adopted by 42.9% of listings. This highlights the market's preference for shorter, flexible bookings.
- A strong majority (85.8%) of the Castellbell i el Vilar Airbnb data shows acceptance of very short stays (1-2 nights), indicating a dynamic, high-turnover market.
Recommendations
- Align with the market by considering a 1 Night minimum stay, as 42.9% of Castellbell i el Vilar hosts use this setting.
- Explore offering discounts for stays of 30+ nights to attract the 7.1% of the market seeking extended stays.
- Adjust minimum nights based on seasonality – potentially shorter during low season and longer during peak demand periods in Castellbell i el Vilar.
Castellbell i el Vilar Airbnb Cancellation Policy Trends Analysis (2026)
Flexible
2 listings
12.5% of total
Moderate
7 listings
43.8% of total
Firm
1 listings
6.3% of total
Strict
6 listings
37.5% of total
Cancellation Policy Insights for Castellbell i el Vilar
- The prevailing Airbnb cancellation policy trend in Castellbell i el Vilar is Moderate, used by 43.8% of listings.
- There's a relatively balanced mix between guest-friendly (56.3%) and stricter (43.8%) policies, offering choices for different guest needs.
Recommendations for Hosts
- Consider adopting a Moderate policy to align with the 43.8% market standard in Castellbell i el Vilar.
- With 37.5% using Strict terms, this is a viable option in Castellbell i el Vilar, particularly for high-value properties or during peak demand periods.
- Regularly review your cancellation policy against competitors and market demand shifts in Castellbell i el Vilar.
Castellbell i el Vilar STR Booking Lead Time Analysis (2026)
Average Booking Lead Time by Month
Booking Lead Time Insights for Castellbell i el Vilar
- The overall average booking lead time for vacation rentals in Castellbell i el Vilar is 56 days.
- Guests book furthest in advance for stays during July (average 92 days), likely coinciding with peak travel demand or local events.
- The shortest booking windows occur for stays in October (average 24 days), indicating more last-minute travel plans during this time.
- Seasonally, Summer (74 days avg.) sees the longest lead times, while Fall (41 days avg.) has the shortest, reflecting typical travel planning cycles.
Recommendations for Hosts
- Use the overall average lead time (56 days) as a baseline for your pricing and availability strategy in Castellbell i el Vilar.
- For July stays, consider implementing length-of-stay discounts or slightly higher rates for bookings made less than 92 days out to capitalize on advance planning.
- Target marketing efforts for the Summer season well in advance (at least 74 days) to capture early planners.
- Monitor your own booking lead times against these Castellbell i el Vilar averages to identify opportunities for dynamic pricing adjustments.
Popular & Essential Airbnb Amenities in Castellbell i el Vilar (2026)
Amenity Prevalence
Amenity Insights for Castellbell i el Vilar
- Essential amenities in Castellbell i el Vilar that guests expect include: Hot water, Coffee maker, Free parking on premises, Wifi, Dishes and silverware, Heating. Lacking these (any) could significantly impact bookings.
- Popular amenities like Essentials, Cooking basics, Cleaning products are common but not universal. Offering these can provide a competitive edge.
Recommendations for Hosts
- Ensure your listing includes all essential amenities for Castellbell i el Vilar: Hot water, Coffee maker, Free parking on premises, Wifi, Dishes and silverware, Heating.
- Consider adding popular differentiators like Essentials or Cooking basics to increase appeal.
- Highlight unique or less common amenities you offer (e.g., hot tub, dedicated workspace, EV charger) in your listing description and photos.
- Regularly check competitor amenities in Castellbell i el Vilar to stay competitive.
Castellbell i el Vilar Airbnb Guest Demographics & Profile Analysis (2026)
Guest Profile Summary for Castellbell i el Vilar
- The typical guest profile for Airbnb in Castellbell i el Vilar consists of a mix of domestic (36%) and international guests, with top international origins including France, typically belonging to the Post-2000s (Gen Z/Alpha) group (50%), primarily speaking English or Spanish.
- Domestic travelers account for 35.8% of guests.
- Key international markets include Spain (35.8%) and France (10.8%).
- Top languages spoken are English (36.8%) followed by Spanish (23.2%).
- A significant demographic segment is the Post-2000s (Gen Z/Alpha) group, representing 50% of guests.
Recommendations for Hosts
- Focus marketing internationally, particularly towards travelers from France.
- Tailor amenities and listing descriptions to appeal to the dominant Post-2000s (Gen Z/Alpha) demographic (e.g., highlight fast WiFi, smart home features, local guides).
- Highlight unique local experiences or amenities relevant to the primary guest profile.
- Consider seasonal promotions aligned with peak travel times for key origin markets.
Nearby Short-Term Rental Market Comparison
How does the Castellbell i el Vilar Airbnb market stack up against its neighbors? Compare key performance metrics like average monthly revenue, ADR, and occupancy rates in surrounding areas to understand the broader regional STR landscape.
| Market | Active Properties | Monthly Revenue | Daily Rate | Avg. Occupancy |
|---|---|---|---|---|
| Canyelles | 50 | $6,026 | $1007.52 | 37% |
| Teià | 25 | $5,702 | $361.95 | 45% |
| Arenys de Munt | 29 | $5,429 | $516.53 | 43% |
| Tiana | 12 | $5,137 | $299.44 | 49% |
| Amer | 10 | $5,007 | $377.46 | 39% |
| Cornellà del Terri | 17 | $4,895 | $458.00 | 41% |
| Premià de Dalt | 27 | $4,834 | $346.54 | 49% |
| Cabrils | 52 | $4,731 | $444.34 | 48% |
| la Baronia de Rialb | 14 | $4,627 | $404.52 | 42% |
| Porqueres | 12 | $4,617 | $453.47 | 36% |