Cornudella de Montsant Airbnb Market Analysis 2026: Short Term Rental Data & Vacation Rental Statistics in Catalonia, Spain
Is Airbnb profitable in Cornudella de Montsant in 2026? Explore comprehensive Airbnb analytics for Cornudella de Montsant, Catalonia, Spain to uncover income potential. This 2026 STR market report for Cornudella de Montsant, based on AirROI data from February 2025 to January 2026, reveals key trends in the niche market of 56 active listings.
Whether you're considering an Airbnb investment in Cornudella de Montsant, optimizing your existing vacation rental, or exploring rental arbitrage opportunities, understanding the Cornudella de Montsant Airbnb data is crucial. Navigating the high regulation landscape is key to maximizing your short term rental income potential. Let's dive into the specifics.
Key Cornudella de Montsant Airbnb Performance Metrics Overview
Monthly Airbnb Revenue Variations & Income Potential in Cornudella de Montsant (2026)
Understanding the monthly revenue variations for Airbnb listings in Cornudella de Montsant is key to maximizing your short term rental income potential. Seasonality significantly impacts earnings. Our analysis, based on data from the past 12 months, shows that the peak revenue month for STRs in Cornudella de Montsant is typically August, while January often presents the lowest earnings, highlighting opportunities for strategic pricing adjustments during shoulder and low seasons. Explore the typical Airbnb income in Cornudella de Montsant across different performance tiers:
- Best-in-class properties (Top 10%) achieve $2,284+ monthly, often utilizing dynamic pricing and superior guest experiences.
- Strong performing properties (Top 25%) earn $1,767 or more, indicating effective management and desirable locations/amenities.
- Typical properties (Median) generate around $1,199 per month, representing the average market performance.
- Entry-level properties (Bottom 25%) see earnings around $710, often with potential for optimization.
Average Monthly Airbnb Earnings Trend in Cornudella de Montsant
Cornudella de Montsant Airbnb Occupancy Rate Trends (2026)
Maximize your bookings by understanding the Cornudella de Montsant STR occupancy trends. Seasonal demand shifts significantly influence how often properties are booked. Typically, Augustsees the highest demand (peak season occupancy), while January experiences the lowest (low season). Effective strategies, like adjusting minimum stays or offering promotions, can boost occupancy during slower periods. Here's how different property tiers perform in Cornudella de Montsant:
- Best-in-class properties (Top 10%) achieve 77%+ occupancy, indicating high desirability and potentially optimized availability.
- Strong performing properties (Top 25%) maintain 63% or higher occupancy, suggesting good market fit and guest satisfaction.
- Typical properties (Median) have an occupancy rate around 42%.
- Entry-level properties (Bottom 25%) average 22% occupancy, potentially facing higher vacancy.
Average Monthly Occupancy Rate Trend in Cornudella de Montsant
Average Daily Rate (ADR) Airbnb Trends in Cornudella de Montsant (2026)
Effective short term rental pricing strategy in Cornudella de Montsant involves understanding monthly ADR fluctuations. The Average Daily Rate (ADR) for Airbnb in Cornudella de Montsant typically peaks in January and dips lowest during February. Leveraging Airbnb dynamic pricing tools or strategies based on this seasonality can significantly boost revenue. Here's a look at the typical nightly rates achieved:
- Best-in-class properties (Top 10%) command rates of $241+ per night, often due to premium features or locations.
- Strong performing properties (Top 25%) achieve nightly rates of $134 or more.
- Typical properties (Median) charge around $98 per night.
- Entry-level properties (Bottom 25%) earn around $75 per night.
Average Daily Rate (ADR) Trend by Month in Cornudella de Montsant
Get Live Cornudella de Montsant Market Intelligence 👇

Explore Real-time Analytics
Airbnb Seasonality Analysis & Trends in Cornudella de Montsant (2026)
Peak Season (August, November, March)
- Revenue averages $1,796 per month
- Occupancy rates average 55.8%
- Daily rates average $124
Shoulder Season
- Revenue averages $1,323 per month
- Occupancy maintains around 42.4%
- Daily rates hold near $124
Low Season (January, May, June)
- Revenue drops to average $1,053 per month
- Occupancy decreases to average 33.5%
- Daily rates adjust to average $126
Seasonality Insights for Cornudella de Montsant
- The Airbnb seasonality in Cornudella de Montsant shows highly seasonal trends requiring careful strategy. While the sections above show seasonal averages, it's also insightful to look at the extremes:
- During the high season, the absolute peak month showcases Cornudella de Montsant's highest earning potential, with monthly revenues capable of climbing to $2,139, occupancy reaching a high of 59.5%, and ADRs peaking at $132.
- Conversely, the slowest single month of the year, typically falling within the low season, marks the market's lowest point. In this month, revenue might dip to $976, occupancy could drop to 30.3%, and ADRs may adjust down to $117.
- Understanding both the seasonal averages and these monthly peaks and troughs in revenue, occupancy, and ADR is crucial for maximizing your Airbnb profit potential in Cornudella de Montsant.
Seasonal Strategies for Maximizing Profit
- Peak Season: Maximize revenue through premium pricing and potentially longer minimum stays. Ensure high availability.
- Low Season: Offer competitive pricing, special promotions (e.g., extended stay discounts), and flexible cancellation policies. Target off-season travelers like remote workers or budget-conscious guests.
- Shoulder Seasons: Implement dynamic pricing that balances peak and low rates. Target weekend travelers or specific events. Offer slightly more flexible terms than peak season.
- Regularly analyze your own performance against these Cornudella de Montsant seasonality benchmarks and adjust your pricing and availability strategy accordingly.
Best Areas for Airbnb Investment in Cornudella de Montsant (2026)
Exploring the top neighborhoods for short-term rentals in Cornudella de Montsant? This section highlights key areas, outlining why they are attractive for hosts and guests, along with notable local attractions. Consider these locations based on your target guest profile and investment strategy.
| Neighborhood / Area | Why Host Here? (Target Guests & Appeal) | Key Attractions & Landmarks |
|---|---|---|
| Cornudella de Montsant | A picturesque village known for its beautiful landscapes, wine culture and proximity to the Montsant mountain range. This quaint location attracts outdoor enthusiasts and wine lovers. | Montsant Natural Park, Celler de Capçanes, Ermita de Sant Joan, Cooperativa Agrícola de Cornudella, Cami dels Degotalls, Mirador de la Llibertat |
| Siurana | A historic medieval village perched on a cliff, famous for its stunning views and rock climbing opportunities. Perfect for tourists seeking adventure and history alike. | Castle of Siurana, The Siurana rock climbing area, Church of Santa Maria, The reservoir of Siurana, Picturesque viewpoints, Local artisanal shops |
| Falset | The capital of the Priorat wine region, known for its rich gastronomy and wine production. Ideal for wine tourism and gourmet experiences. | Castell de Falset, Wine cellars & tastings, Priorat Wine Route, Local markets, Falset's historic town center, Monastery of Saint Mary |
| Tivissa | A charming town surrounded by vineyards and olive groves, with a rich history and beautiful landscapes. Great for those seeking tranquility and nature. | Tivissa's medieval castle, The Roman remains, Natural routes and trails, Local olive oil tastings, St. Andrew's Church, Scenic countryside views |
| La Morera de Montsant | An idyllic small village ideal for nature lovers and hikers, located at the entrance of the Montsant Natural Park, offering serene surroundings. | Montsant Natural Park, Hiking trails, Local gastronomic experiences, The village's quaint architecture, Panoramic views from the surrounding hills, Cultural events in the village |
| Porrera | Known for its rich wine production and beautiful surroundings, attracting wine enthusiasts and nature lovers alike. | Wine cellars and tours, The enchanting landscapes, Local festivals, Mountain biking trails, Cultural visits and tastings, The scenic countryside |
| Rocafort de Queralt | A lesser-known gem with traditional Catalan architecture and surrounded by nature. Perfect for a rustic and peaceful getaway. | Rocafort Castle, Traditional Catalan lifestyle, Walking and hiking paths, Local cuisine, Stunning rural views, Artisan shops |
| Capçanes | A quaint village known for its excellent wines and beautiful natural setting, appealing to those interested in wine and outdoor activities. | Capçanes Wine Cellars, Nature trails, Community events, The charming village square, Local winery tours, Scenic grapevines |
Understanding Airbnb License Requirements & STR Laws in Cornudella de Montsant (2026)
Yes, Cornudella de Montsant, Catalonia, Spain enforces high STR regulations. Obtaining a license and ensuring compliance is almost certainly required according to current 2026 STR laws. Always verify the latest short term rental regulations and Airbnb license requirements directly with local government authorities for Cornudella de Montsant to ensure full compliance before hosting.
(Source: AirROI data, 2026, based on 93% licensed listings)
Top Performing Airbnb Properties in Cornudella de Montsant (2026)
Benchmark your potential! Explore examples of top-performing Airbnb properties in Cornudella de Montsantbased on Trailing Twelve Month (TTM) revenue. Analyze their characteristics, revenue, occupancy rate, and ADR to understand what drives success in this market.
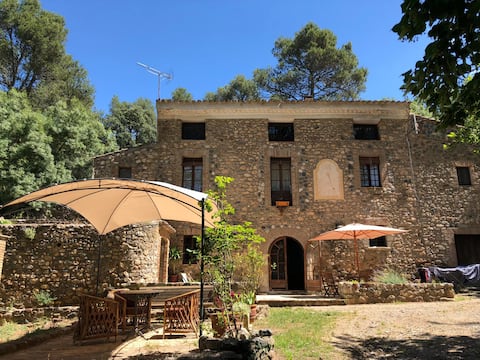
Molí dels Aubins: The dream come true
Entire Place • 7 bedrooms
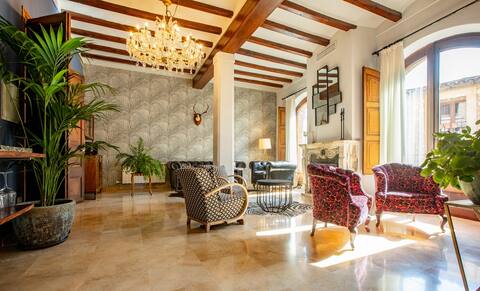
The Palauet del Priorat DOLORS
Private Room • 1 bedroom

Apartments la Rambla - Llicorella - 2/4 people
Entire Place • 1 bedroom
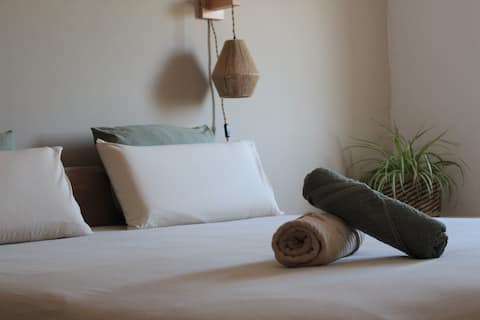
L'indret Apartment
Entire Place • 2 bedrooms

Apartments la Rambla - Esperó de Bolós
Entire Place • 1 bedroom
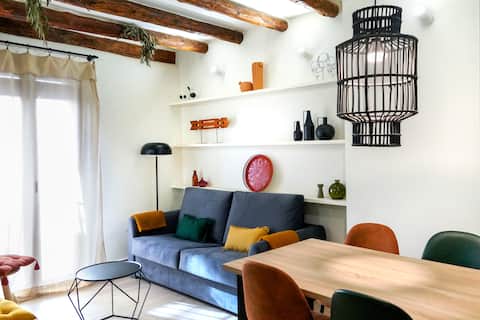
La Rambla Apartments - Arbequina - 4/6 people
Entire Place • 2 bedrooms
Note: Performance varies based on location, size, amenities, seasonality, and management quality. Data reflects the past 12 months.
Top Performing Airbnb Hosts in Cornudella de Montsant (2026)
Learn from the best! This table showcases top-performing Airbnb hosts in Cornudella de Montsant based on the number of properties managed and estimated total revenue over the past year. Analyze their scale and performance metrics.
| Host Name | Properties | Grossing Revenue | Stay Reviews | Avg Rating |
|---|---|---|---|---|
| Roques I Ones | 5 | $103,152 | 301 | 4.90/5.0 |
| Dolors | 5 | $84,793 | 73 | 4.91/5.0 |
| Víctor | 1 | $67,166 | 29 | 4.86/5.0 |
| Nira I Montse | 3 | $45,244 | 364 | 4.77/5.0 |
| Luciana | 3 | $33,425 | 84 | 4.63/5.0 |
| Mariona | 2 | $32,565 | 172 | 4.72/5.0 |
| Aga | 3 | $31,071 | 88 | 4.73/5.0 |
| Caroline | 2 | $26,636 | 110 | 4.86/5.0 |
| Helena | 3 | $26,354 | 147 | 4.18/5.0 |
| Betlem | 2 | $24,879 | 98 | 4.92/5.0 |
Analyzing the strategies of top hosts, such as their property selection, pricing, and guest communication, can offer valuable lessons for optimizing your own Airbnb operations in Cornudella de Montsant.
Dive Deeper: Advanced Cornudella de Montsant STR Market Data (2026)
Ready to unlock more insights? AirROI provides access to advanced metrics and comprehensive Airbnb data for Cornudella de Montsant. Explore detailed analytics beyond this report to refine your investment strategy, optimize pricing, and maximize your vacation rental profits.
Explore Advanced MetricsCornudella de Montsant Short-Term Rental Market Composition (2026): Property & Room Types
Room Type Distribution
Property Type Distribution
Market Composition Insights for Cornudella de Montsant
- The Cornudella de Montsant Airbnb market composition is heavily skewed towards Entire Home/Apt listings, which make up 91.1% of the 56 active rentals. This indicates strong guest preference for privacy and space.
- Looking at the property type distribution in Cornudella de Montsant, Apartment/Condo properties are the most common (55.4%), reflecting the local real estate landscape.
- Houses represent a significant 32.1% portion, catering likely to families or larger groups.
- The presence of 8.9% Hotel/Boutique listings indicates integration with traditional hospitality.
- Smaller segments like unique stays, outdoor/unique (combined 3.6%) offer potential for unique stay experiences.
Cornudella de Montsant Airbnb Room Capacity Analysis (2026): Bedroom Distribution
Distribution of Listings by Number of Bedrooms
Room Capacity Insights for Cornudella de Montsant
- The dominant room capacity in Cornudella de Montsant is 2 bedrooms listings, making up 44.6% of the market. This suggests a strong demand for properties suitable for couples or solo travelers.
- Together, 2 bedrooms and 1 bedroom properties represent 78.5% of the active Airbnb listings in Cornudella de Montsant, indicating a high concentration in these sizes.
Cornudella de Montsant Vacation Rental Guest Capacity Trends (2026)
Distribution of Listings by Guest Capacity
Guest Capacity Insights for Cornudella de Montsant
- The most common guest capacity trend in Cornudella de Montsant vacation rentals is listings accommodating 4 guests (33.9%). This suggests the primary traveler segment is likely small families or groups.
- Properties designed for 4 guests and 2 guests dominate the Cornudella de Montsant STR market, accounting for 53.5% of listings.
- 25.0% of properties accommodate 6+ guests, serving the market segment for larger families or group travel in Cornudella de Montsant.
- On average, properties in Cornudella de Montsant are equipped to host 4.3 guests.
Cornudella de Montsant Airbnb Booking Patterns (2026): Available vs. Booked Days
Available Days Distribution
Booked Days Distribution
Booking Pattern Insights for Cornudella de Montsant
- The most common availability pattern in Cornudella de Montsant falls within the 271-366 days range, representing 41.1% of listings. This suggests many properties have significant open periods on their calendars.
- Approximately 73.2% of listings show high availability (181+ days open annually), indicating potential for increased bookings or specific owner usage patterns.
- For booked days, the 31-90 days range is most frequent in Cornudella de Montsant (33.9%), reflecting common guest stay durations or potential owner blocking patterns.
- A notable 32.2% of properties secure long booking periods (181+ days booked per year), highlighting successful long-term rental strategies or significant owner usage.
Cornudella de Montsant Airbnb Minimum Stay Requirements Analysis
Distribution of Listings by Minimum Night Requirement
1 Night
9 listings
16.1% of total
2 Nights
11 listings
19.6% of total
3 Nights
7 listings
12.5% of total
4-6 Nights
7 listings
12.5% of total
30+ Nights
22 listings
39.3% of total
Key Insights
- The most prevalent minimum stay requirement in Cornudella de Montsant is 30+ Nights, adopted by 39.3% of listings. This highlights the market's preference for longer commitments.
- A significant segment (39.3%) caters to monthly stays (30+ nights) in Cornudella de Montsant, pointing to opportunities in the extended-stay market.
Recommendations
- Align with the market by considering a 30+ Nights minimum stay, as 39.3% of Cornudella de Montsant hosts use this setting.
- If feasible, allowing 1-night stays, especially midweek or during low season, could capture last-minute bookings, as only 16.1% currently do.
- Explore offering discounts for stays of 30+ nights to attract the 39.3% of the market seeking extended stays.
- Adjust minimum nights based on seasonality – potentially shorter during low season and longer during peak demand periods in Cornudella de Montsant.
Cornudella de Montsant Airbnb Cancellation Policy Trends Analysis (2026)
Flexible
11 listings
19.6% of total
Moderate
21 listings
37.5% of total
Firm
15 listings
26.8% of total
Strict
9 listings
16.1% of total
Cancellation Policy Insights for Cornudella de Montsant
- The prevailing Airbnb cancellation policy trend in Cornudella de Montsant is Moderate, used by 37.5% of listings.
- There's a relatively balanced mix between guest-friendly (57.1%) and stricter (42.9%) policies, offering choices for different guest needs.
Recommendations for Hosts
- Consider adopting a Moderate policy to align with the 37.5% market standard in Cornudella de Montsant.
- Regularly review your cancellation policy against competitors and market demand shifts in Cornudella de Montsant.
Cornudella de Montsant STR Booking Lead Time Analysis (2026)
Average Booking Lead Time by Month
Booking Lead Time Insights for Cornudella de Montsant
- The overall average booking lead time for vacation rentals in Cornudella de Montsant is 48 days.
- Guests book furthest in advance for stays during August (average 62 days), likely coinciding with peak travel demand or local events.
- The shortest booking windows occur for stays in June (average 27 days), indicating more last-minute travel plans during this time.
- Seasonally, Fall (56 days avg.) sees the longest lead times, while Summer (40 days avg.) has the shortest, reflecting typical travel planning cycles.
Recommendations for Hosts
- Use the overall average lead time (48 days) as a baseline for your pricing and availability strategy in Cornudella de Montsant.
- For August stays, consider implementing length-of-stay discounts or slightly higher rates for bookings made less than 62 days out to capitalize on advance planning.
- Target marketing efforts for the Fall season well in advance (at least 56 days) to capture early planners.
- Monitor your own booking lead times against these Cornudella de Montsant averages to identify opportunities for dynamic pricing adjustments.
Popular & Essential Airbnb Amenities in Cornudella de Montsant (2026)
Amenity Prevalence
Amenity Insights for Cornudella de Montsant
- Popular amenities like Heating, Hot water, Essentials are common but not universal. Offering these can provide a competitive edge.
- Warning: Wifi is not universally provided but is considered essential globally. Ensure reliable Wifi is offered.
Recommendations for Hosts
- Consider adding popular differentiators like Heating or Hot water to increase appeal.
- Highlight unique or less common amenities you offer (e.g., hot tub, dedicated workspace, EV charger) in your listing description and photos.
- Regularly check competitor amenities in Cornudella de Montsant to stay competitive.
Cornudella de Montsant Airbnb Guest Demographics & Profile Analysis (2026)
Guest Profile Summary for Cornudella de Montsant
- The typical guest profile for Airbnb in Cornudella de Montsant consists of predominantly international visitors (79%), with top international origins including France, typically belonging to the Post-2000s (Gen Z/Alpha) group (50%), primarily speaking English or Spanish.
- Domestic travelers account for 21.3% of guests.
- Key international markets include Spain (21.3%) and France (18.2%).
- Top languages spoken are English (35.8%) followed by Spanish (18.9%).
- A significant demographic segment is the Post-2000s (Gen Z/Alpha) group, representing 50% of guests.
Recommendations for Hosts
- Focus marketing internationally, particularly towards travelers from France.
- Tailor amenities and listing descriptions to appeal to the dominant Post-2000s (Gen Z/Alpha) demographic (e.g., highlight fast WiFi, smart home features, local guides).
- Highlight unique local experiences or amenities relevant to the primary guest profile.
- Consider seasonal promotions aligned with peak travel times for key origin markets.
Nearby Short-Term Rental Market Comparison
How does the Cornudella de Montsant Airbnb market stack up against its neighbors? Compare key performance metrics like average monthly revenue, ADR, and occupancy rates in surrounding areas to understand the broader regional STR landscape.
| Market | Active Properties | Monthly Revenue | Daily Rate | Avg. Occupancy |
|---|---|---|---|---|
| Canyelles | 47 | $7,127 | $1152.36 | 35% |
| Vallirana | 10 | $5,639 | $350.46 | 57% |
| la Baronia de Rialb | 16 | $4,527 | $436.71 | 45% |
| la Llacuna | 10 | $4,238 | $584.45 | 24% |
| Aiguamúrcia | 15 | $3,747 | $310.17 | 46% |
| Alcover | 13 | $3,676 | $697.99 | 27% |
| Olivella | 97 | $3,471 | $456.77 | 41% |
| Subirats | 22 | $3,158 | $335.56 | 38% |
| Corbera de Llobregat | 15 | $2,950 | $379.06 | 46% |
| Olèrdola | 14 | $2,908 | $668.38 | 32% |