Mont-ras Airbnb Market Analysis 2026: Short Term Rental Data & Vacation Rental Statistics in Catalonia, Spain
Is Airbnb profitable in Mont-ras in 2026? Explore comprehensive Airbnb analytics for Mont-ras, Catalonia, Spain to uncover income potential. This 2026 STR market report for Mont-ras, based on AirROI data from February 2025 to January 2026, reveals key trends in the niche market of 27 active listings.
Whether you're considering an Airbnb investment in Mont-ras, optimizing your existing vacation rental, or exploring rental arbitrage opportunities, understanding the Mont-ras Airbnb data is crucial. Navigating the high regulation landscape is key to maximizing your short term rental income potential. Let's dive into the specifics.
Key Mont-ras Airbnb Performance Metrics Overview
Monthly Airbnb Revenue Variations & Income Potential in Mont-ras (2026)
Understanding the monthly revenue variations for Airbnb listings in Mont-ras is key to maximizing your short term rental income potential. Seasonality significantly impacts earnings. Our analysis, based on data from the past 12 months, shows that the peak revenue month for STRs in Mont-ras is typically August, while January often presents the lowest earnings, highlighting opportunities for strategic pricing adjustments during shoulder and low seasons. Explore the typical Airbnb income in Mont-ras across different performance tiers:
- Best-in-class properties (Top 10%) achieve $7,273+ monthly, often utilizing dynamic pricing and superior guest experiences.
- Strong performing properties (Top 25%) earn $4,154 or more, indicating effective management and desirable locations/amenities.
- Typical properties (Median) generate around $1,753 per month, representing the average market performance.
- Entry-level properties (Bottom 25%) see earnings around $1,013, often with potential for optimization.
Average Monthly Airbnb Earnings Trend in Mont-ras
Mont-ras Airbnb Occupancy Rate Trends (2026)
Maximize your bookings by understanding the Mont-ras STR occupancy trends. Seasonal demand shifts significantly influence how often properties are booked. Typically, Augustsees the highest demand (peak season occupancy), while January experiences the lowest (low season). Effective strategies, like adjusting minimum stays or offering promotions, can boost occupancy during slower periods. Here's how different property tiers perform in Mont-ras:
- Best-in-class properties (Top 10%) achieve 64%+ occupancy, indicating high desirability and potentially optimized availability.
- Strong performing properties (Top 25%) maintain 45% or higher occupancy, suggesting good market fit and guest satisfaction.
- Typical properties (Median) have an occupancy rate around 25%.
- Entry-level properties (Bottom 25%) average 15% occupancy, potentially facing higher vacancy.
Average Monthly Occupancy Rate Trend in Mont-ras
Average Daily Rate (ADR) Airbnb Trends in Mont-ras (2026)
Effective short term rental pricing strategy in Mont-ras involves understanding monthly ADR fluctuations. The Average Daily Rate (ADR) for Airbnb in Mont-ras typically peaks in August and dips lowest during March. Leveraging Airbnb dynamic pricing tools or strategies based on this seasonality can significantly boost revenue. Here's a look at the typical nightly rates achieved:
- Best-in-class properties (Top 10%) command rates of $499+ per night, often due to premium features or locations.
- Strong performing properties (Top 25%) achieve nightly rates of $319 or more.
- Typical properties (Median) charge around $228 per night.
- Entry-level properties (Bottom 25%) earn around $197 per night.
Average Daily Rate (ADR) Trend by Month in Mont-ras
Get Live Mont-ras Market Intelligence 👇

Explore Real-time Analytics
Airbnb Seasonality Analysis & Trends in Mont-ras (2026)
Peak Season (August, July, April)
- Revenue averages $5,471 per month
- Occupancy rates average 51.2%
- Daily rates average $298
Shoulder Season
- Revenue averages $3,118 per month
- Occupancy maintains around 32.2%
- Daily rates hold near $274
Low Season (January, November, December)
- Revenue drops to average $587 per month
- Occupancy decreases to average 10.8%
- Daily rates adjust to average $285
Seasonality Insights for Mont-ras
- The Airbnb seasonality in Mont-ras shows highly seasonal trends requiring careful strategy. While the sections above show seasonal averages, it's also insightful to look at the extremes:
- During the high season, the absolute peak month showcases Mont-ras's highest earning potential, with monthly revenues capable of climbing to $7,304, occupancy reaching a high of 66.4%, and ADRs peaking at $324.
- Conversely, the slowest single month of the year, typically falling within the low season, marks the market's lowest point. In this month, revenue might dip to $417, occupancy could drop to 5.9%, and ADRs may adjust down to $253.
- Understanding both the seasonal averages and these monthly peaks and troughs in revenue, occupancy, and ADR is crucial for maximizing your Airbnb profit potential in Mont-ras.
Seasonal Strategies for Maximizing Profit
- Peak Season: Maximize revenue through premium pricing and potentially longer minimum stays. Ensure high availability.
- Low Season: Offer competitive pricing, special promotions (e.g., extended stay discounts), and flexible cancellation policies. Target off-season travelers like remote workers or budget-conscious guests.
- Shoulder Seasons: Implement dynamic pricing that balances peak and low rates. Target weekend travelers or specific events. Offer slightly more flexible terms than peak season.
- Regularly analyze your own performance against these Mont-ras seasonality benchmarks and adjust your pricing and availability strategy accordingly.
Best Areas for Airbnb Investment in Mont-ras (2026)
Exploring the top neighborhoods for short-term rentals in Mont-ras? This section highlights key areas, outlining why they are attractive for hosts and guests, along with notable local attractions. Consider these locations based on your target guest profile and investment strategy.
| Neighborhood / Area | Why Host Here? (Target Guests & Appeal) | Key Attractions & Landmarks |
|---|---|---|
| Mont-ras Old Town | Charming village atmosphere with traditional Catalan architecture. A great location for tourists looking for an authentic experience in the heart of Catalonia, close to local markets and eateries. | Mont-ras Church, Local artisan shops, Catalan cuisine restaurants |
| Baix Empordà | Beautiful agricultural area surrounding Mont-ras, offering stunning landscapes and a taste of rural Catalonia. Ideal for visitors wanting to explore the countryside and enjoy outdoor activities. | Empordà vineyard tours, Walking and cycling paths, Natural parks nearby |
| Palafrugell | Nearest larger town with a vibrant market and coastal access. Popular among tourists looking for a mix of cultural attractions and beach activities. | Palafrugell Market, Cap Roig Botanical Garden, Beaches of Llafranc and Calella |
| Calella de Palafrugell | Picturesque seaside village known for its beautiful beaches and coves. Attracts visitors looking for relaxation and water sports. | Beautiful beaches, Walking trails along the coast, Restaurants with sea views |
| Tamariu | Small coastal village with stunning views and clear waters. Perfect for families and couples seeking a peaceful beach getaway. | Tamariu Beach, Scenic coastal walks, Secluded coves |
| Begur | Charming hilltop town with medieval origins and stunning coastal views. Offers a mix of beach access and cultural exploration. | Begur Castle, Beautiful beaches nearby, Vibrant local markets |
| Pals | Medieval town known for its preserved architecture and historical significance. Attracts visitors interested in history and culture. | Pals old town, Historical sites, Local wineries |
| Costa Brava | Renowned coastline known for its breathtaking scenery and tourist attractions. A prime destination for beach lovers and adventure seekers. | Cliffs and beaches, Water sports activities, Cultural festivals |
Understanding Airbnb License Requirements & STR Laws in Mont-ras (2026)
Yes, Mont-ras, Catalonia, Spain enforces high STR regulations. Obtaining a license and ensuring compliance is almost certainly required according to current 2026 STR laws. Always verify the latest short term rental regulations and Airbnb license requirements directly with local government authorities for Mont-ras to ensure full compliance before hosting.
(Source: AirROI data, 2026, based on 70% licensed listings)
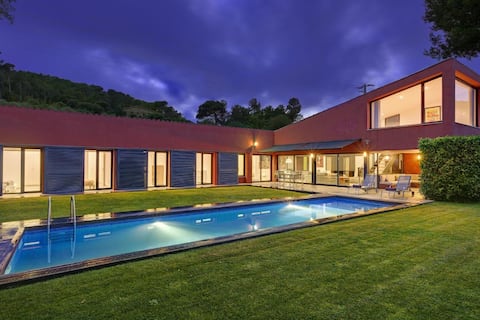
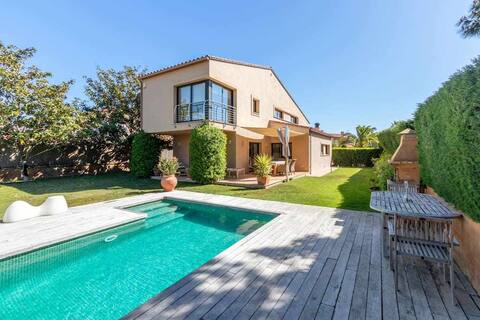
Top Performing Airbnb Properties in Mont-ras (2026)
Benchmark your potential! Explore examples of top-performing Airbnb properties in Mont-rasbased on Trailing Twelve Month (TTM) revenue. Analyze their characteristics, revenue, occupancy rate, and ADR to understand what drives success in this market.

Masia Moli de Can Burjats with pool and fireplace
Entire Place • 6 bedrooms
Villa Can Burjats (Costa Brava)
Entire Place • 4 bedrooms
Beautiful villa on the Costa Brava
Entire Place • 4 bedrooms

RocaClara: Country chalet Urb. Torre Simona
Entire Place • 4 bedrooms
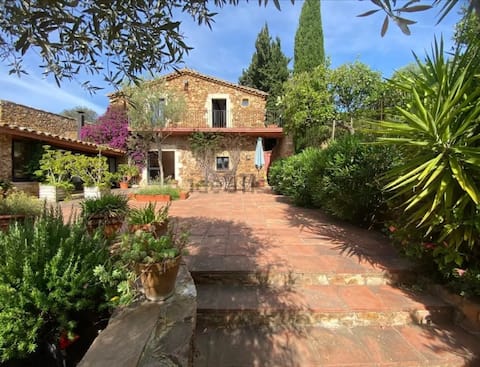
Masia Catalana in Mont-ras
Entire Place • 2 bedrooms
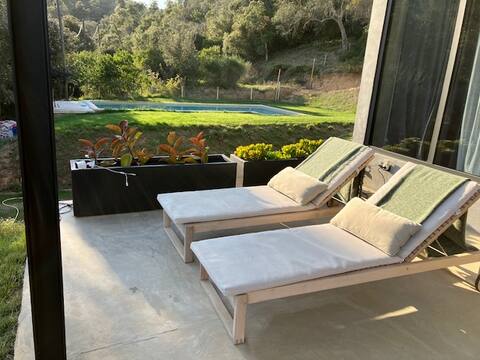
Magnificent villa on the Costa Brava
Entire Place • 3 bedrooms
Note: Performance varies based on location, size, amenities, seasonality, and management quality. Data reflects the past 12 months.
Top Performing Airbnb Hosts in Mont-ras (2026)
Learn from the best! This table showcases top-performing Airbnb hosts in Mont-ras based on the number of properties managed and estimated total revenue over the past year. Analyze their scale and performance metrics.
| Host Name | Properties | Grossing Revenue | Stay Reviews | Avg Rating |
|---|---|---|---|---|
| Wehost Apartments | 1 | $142,432 | 16 | 4.81/5.0 |
| Patrick | 1 | $61,238 | 29 | 4.93/5.0 |
| Amarava Host | 1 | $43,273 | 5 | 5.00/5.0 |
| Juan | 3 | $42,261 | 12 | 4.90/5.0 |
| Alessandro | 4 | $40,285 | 77 | 4.84/5.0 |
| Federico | 1 | $39,267 | 12 | 4.92/5.0 |
| Jorge | 1 | $38,735 | 10 | 4.50/5.0 |
| Joan Jordi | 6 | $38,214 | 126 | 4.80/5.0 |
| Monica | 1 | $35,691 | 18 | 4.78/5.0 |
| Adrian | 1 | $35,390 | 35 | 4.97/5.0 |
Analyzing the strategies of top hosts, such as their property selection, pricing, and guest communication, can offer valuable lessons for optimizing your own Airbnb operations in Mont-ras.
Dive Deeper: Advanced Mont-ras STR Market Data (2026)
Ready to unlock more insights? AirROI provides access to advanced metrics and comprehensive Airbnb data for Mont-ras. Explore detailed analytics beyond this report to refine your investment strategy, optimize pricing, and maximize your vacation rental profits.
Explore Advanced MetricsMont-ras Short-Term Rental Market Composition (2026): Property & Room Types
Room Type Distribution
Property Type Distribution
Market Composition Insights for Mont-ras
- The Mont-ras Airbnb market composition is heavily skewed towards Entire Home/Apt listings, which make up 70.4% of the 27 active rentals. This indicates strong guest preference for privacy and space.
- Looking at the property type distribution in Mont-ras, House properties are the most common (48.1%), reflecting the local real estate landscape.
- Houses represent a significant 48.1% portion, catering likely to families or larger groups.
- The presence of 37% Hotel/Boutique listings indicates integration with traditional hospitality.
Mont-ras Airbnb Room Capacity Analysis (2026): Bedroom Distribution
Distribution of Listings by Number of Bedrooms
Room Capacity Insights for Mont-ras
- The dominant room capacity in Mont-ras is 1 bedroom listings, making up 40.7% of the market. This suggests a strong demand for properties suitable for couples or solo travelers.
- Together, 1 bedroom and 4 bedrooms properties represent 70.3% of the active Airbnb listings in Mont-ras, indicating a high concentration in these sizes.
- A significant 44.4% of listings offer 3+ bedrooms, catering to larger groups and families seeking more space in Mont-ras.
Mont-ras Vacation Rental Guest Capacity Trends (2026)
Distribution of Listings by Guest Capacity
Guest Capacity Insights for Mont-ras
- The most common guest capacity trend in Mont-ras vacation rentals is listings accommodating 2 guests (40.7%). This suggests the primary traveler segment is likely couples or solo travelers.
- Properties designed for 2 guests and 8+ guests dominate the Mont-ras STR market, accounting for 70.3% of listings.
- A significant 40.7% of listings cater specifically to 1-2 guests, highlighting strong demand from couples and solo travelers in Mont-ras.
- 44.4% of properties accommodate 6+ guests, serving the market segment for larger families or group travel in Mont-ras.
- On average, properties in Mont-ras are equipped to host 4.6 guests.
Mont-ras Airbnb Booking Patterns (2026): Available vs. Booked Days
Available Days Distribution
Booked Days Distribution
Booking Pattern Insights for Mont-ras
- The most common availability pattern in Mont-ras falls within the 271-366 days range, representing 66.7% of listings. This suggests many properties have significant open periods on their calendars.
- Approximately 100.0% of listings show high availability (181+ days open annually), indicating potential for increased bookings or specific owner usage patterns.
- For booked days, the 31-90 days range is most frequent in Mont-ras (40.7%), reflecting common guest stay durations or potential owner blocking patterns.
- A notable 3.7% of properties secure long booking periods (181+ days booked per year), highlighting successful long-term rental strategies or significant owner usage.
Mont-ras Airbnb Minimum Stay Requirements Analysis
Distribution of Listings by Minimum Night Requirement
2 Nights
9 listings
33.3% of total
3 Nights
1 listings
3.7% of total
4-6 Nights
4 listings
14.8% of total
30+ Nights
13 listings
48.1% of total
Key Insights
- The most prevalent minimum stay requirement in Mont-ras is 30+ Nights, adopted by 48.1% of listings. This highlights the market's preference for longer commitments.
- A significant segment (48.1%) caters to monthly stays (30+ nights) in Mont-ras, pointing to opportunities in the extended-stay market.
Recommendations
- Align with the market by considering a 30+ Nights minimum stay, as 48.1% of Mont-ras hosts use this setting.
- A 2-night minimum appears standard (33.3%). Consider this for weekends or peak periods.
- Explore offering discounts for stays of 30+ nights to attract the 48.1% of the market seeking extended stays.
- Adjust minimum nights based on seasonality – potentially shorter during low season and longer during peak demand periods in Mont-ras.
Mont-ras Airbnb Cancellation Policy Trends Analysis (2026)
Super Strict 30 Days
1 listings
3.7% of total
Flexible
1 listings
3.7% of total
Moderate
7 listings
25.9% of total
Firm
14 listings
51.9% of total
Strict
4 listings
14.8% of total
Cancellation Policy Insights for Mont-ras
- The prevailing Airbnb cancellation policy trend in Mont-ras is Firm, used by 51.9% of listings.
- A majority (66.7%) of hosts in Mont-ras utilize Firm or Strict policies, indicating a market where hosts prioritize booking security.
Recommendations for Hosts
- Consider adopting a Firm policy to align with the 51.9% market standard in Mont-ras.
- Using a Strict policy might deter some guests, as only 14.8% of listings use it. Evaluate if potential revenue protection outweighs possible lower booking rates.
- Regularly review your cancellation policy against competitors and market demand shifts in Mont-ras.
Mont-ras STR Booking Lead Time Analysis (2026)
Average Booking Lead Time by Month
Booking Lead Time Insights for Mont-ras
- The overall average booking lead time for vacation rentals in Mont-ras is 65 days.
- Guests book furthest in advance for stays during June (average 81 days), likely coinciding with peak travel demand or local events.
- The shortest booking windows occur for stays in January (average 2 days), indicating more last-minute travel plans during this time.
- Seasonally, Summer (77 days avg.) sees the longest lead times, while Winter (32 days avg.) has the shortest, reflecting typical travel planning cycles.
Recommendations for Hosts
- Use the overall average lead time (65 days) as a baseline for your pricing and availability strategy in Mont-ras.
- For June stays, consider implementing length-of-stay discounts or slightly higher rates for bookings made less than 81 days out to capitalize on advance planning.
- During January, focus on last-minute booking availability and promotions, as guests book with very short notice (2 days avg.).
- Target marketing efforts for the Summer season well in advance (at least 77 days) to capture early planners.
- Monitor your own booking lead times against these Mont-ras averages to identify opportunities for dynamic pricing adjustments.
Popular & Essential Airbnb Amenities in Mont-ras (2026)
Amenity Prevalence
Amenity Insights for Mont-ras
- Essential amenities in Mont-ras that guests expect include: Wifi, Hot water. Lacking these (any) could significantly impact bookings.
- Popular amenities like TV, Free parking on premises, Hangers are common but not universal. Offering these can provide a competitive edge.
- A pool is a highly desired but not standard amenity, making it a key feature for attracting guests seeking leisure in Mont-ras.
Recommendations for Hosts
- Ensure your listing includes all essential amenities for Mont-ras: Wifi, Hot water.
- Prioritize adding missing essentials: Wifi, Hot water.
- Consider adding popular differentiators like TV or Free parking on premises to increase appeal.
- Highlight unique or less common amenities you offer (e.g., hot tub, dedicated workspace, EV charger) in your listing description and photos.
- Regularly check competitor amenities in Mont-ras to stay competitive.
Mont-ras Airbnb Guest Demographics & Profile Analysis (2026)
Guest Profile Summary for Mont-ras
- The typical guest profile for Airbnb in Mont-ras consists of predominantly international visitors (74%), with top international origins including Spain, typically belonging to the Post-2000s (Gen Z/Alpha) group (50%), primarily speaking English or French.
- Domestic travelers account for 25.9% of guests.
- Key international markets include France (30.9%) and Spain (25.9%).
- Top languages spoken are English (35.4%) followed by French (23.1%).
- A significant demographic segment is the Post-2000s (Gen Z/Alpha) group, representing 50% of guests.
Recommendations for Hosts
- Focus marketing internationally, particularly towards travelers from Spain.
- Tailor amenities and listing descriptions to appeal to the dominant Post-2000s (Gen Z/Alpha) demographic (e.g., highlight fast WiFi, smart home features, local guides).
- Highlight unique local experiences or amenities relevant to the primary guest profile.
- Consider seasonal promotions aligned with peak travel times for key origin markets.
Nearby Short-Term Rental Market Comparison
How does the Mont-ras Airbnb market stack up against its neighbors? Compare key performance metrics like average monthly revenue, ADR, and occupancy rates in surrounding areas to understand the broader regional STR landscape.
| Market | Active Properties | Monthly Revenue | Daily Rate | Avg. Occupancy |
|---|---|---|---|---|
| Vall-llobrega | 18 | $10,253 | $778.88 | 45% |
| Cornellà del Terri | 15 | $6,458 | $584.61 | 40% |
| Tiana | 15 | $5,135 | $362.37 | 45% |
| Sant Vicenç de Montalt | 40 | $5,005 | $422.72 | 39% |
| Amer | 11 | $4,949 | $462.57 | 38% |
| Sant Andreu de Llavaneres | 45 | $4,931 | $450.05 | 41% |
| Teià | 25 | $4,821 | $394.46 | 40% |
| Premià de Dalt | 31 | $4,548 | $337.99 | 47% |
| Alella | 39 | $4,534 | $496.22 | 47% |
| Vilanant | 12 | $4,526 | $404.10 | 36% |