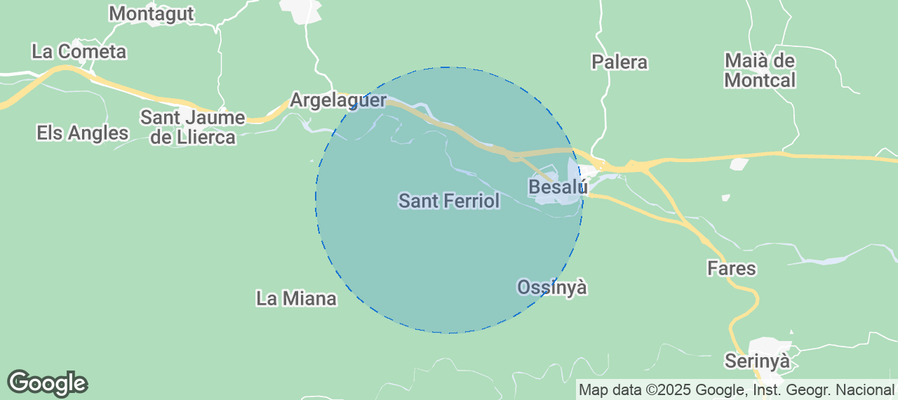
Sant Ferriol Airbnb Market Analysis 2026: Short Term Rental Data & Vacation Rental Statistics in Catalonia, Spain
Is Airbnb profitable in Sant Ferriol in 2026? Explore comprehensive Airbnb analytics for Sant Ferriol, Catalonia, Spain to uncover income potential. This 2026 STR market report for Sant Ferriol, based on AirROI data from February 2025 to January 2026, reveals key trends in the niche market of 18 active listings.
Whether you're considering an Airbnb investment in Sant Ferriol, optimizing your existing vacation rental, or exploring rental arbitrage opportunities, understanding the Sant Ferriol Airbnb data is crucial. Navigating the high regulation landscape is key to maximizing your short term rental income potential. Let's dive into the specifics.
Key Sant Ferriol Airbnb Performance Metrics Overview
Monthly Airbnb Revenue Variations & Income Potential in Sant Ferriol (2026)
Understanding the monthly revenue variations for Airbnb listings in Sant Ferriol is key to maximizing your short term rental income potential. Seasonality significantly impacts earnings. Our analysis, based on data from the past 12 months, shows that the peak revenue month for STRs in Sant Ferriol is typically August, while February often presents the lowest earnings, highlighting opportunities for strategic pricing adjustments during shoulder and low seasons. Explore the typical Airbnb income in Sant Ferriol across different performance tiers:
- Best-in-class properties (Top 10%) achieve $12,583+ monthly, often utilizing dynamic pricing and superior guest experiences.
- Strong performing properties (Top 25%) earn $5,562 or more, indicating effective management and desirable locations/amenities.
- Typical properties (Median) generate around $1,941 per month, representing the average market performance.
- Entry-level properties (Bottom 25%) see earnings around $1,308, often with potential for optimization.
Average Monthly Airbnb Earnings Trend in Sant Ferriol
Sant Ferriol Airbnb Occupancy Rate Trends (2026)
Maximize your bookings by understanding the Sant Ferriol STR occupancy trends. Seasonal demand shifts significantly influence how often properties are booked. Typically, Augustsees the highest demand (peak season occupancy), while February experiences the lowest (low season). Effective strategies, like adjusting minimum stays or offering promotions, can boost occupancy during slower periods. Here's how different property tiers perform in Sant Ferriol:
- Best-in-class properties (Top 10%) achieve 74%+ occupancy, indicating high desirability and potentially optimized availability.
- Strong performing properties (Top 25%) maintain 57% or higher occupancy, suggesting good market fit and guest satisfaction.
- Typical properties (Median) have an occupancy rate around 39%.
- Entry-level properties (Bottom 25%) average 25% occupancy, potentially facing higher vacancy.
Average Monthly Occupancy Rate Trend in Sant Ferriol
Average Daily Rate (ADR) Airbnb Trends in Sant Ferriol (2026)
Effective short term rental pricing strategy in Sant Ferriol involves understanding monthly ADR fluctuations. The Average Daily Rate (ADR) for Airbnb in Sant Ferriol typically peaks in August and dips lowest during February. Leveraging Airbnb dynamic pricing tools or strategies based on this seasonality can significantly boost revenue. Here's a look at the typical nightly rates achieved:
- Best-in-class properties (Top 10%) command rates of $906+ per night, often due to premium features or locations.
- Strong performing properties (Top 25%) achieve nightly rates of $333 or more.
- Typical properties (Median) charge around $147 per night.
- Entry-level properties (Bottom 25%) earn around $96 per night.
Average Daily Rate (ADR) Trend by Month in Sant Ferriol
Get Live Sant Ferriol Market Intelligence 👇
Explore Real-time Analytics
Airbnb Seasonality Analysis & Trends in Sant Ferriol (2026)
Peak Season (August, July, June)
- Revenue averages $7,508 per month
- Occupancy rates average 59.9%
- Daily rates average $331
Shoulder Season
- Revenue averages $4,148 per month
- Occupancy maintains around 41.6%
- Daily rates hold near $310
Low Season (January, February, March)
- Revenue drops to average $2,043 per month
- Occupancy decreases to average 27.5%
- Daily rates adjust to average $290
Seasonality Insights for Sant Ferriol
- The Airbnb seasonality in Sant Ferriol shows highly seasonal trends requiring careful strategy. While the sections above show seasonal averages, it's also insightful to look at the extremes:
- During the high season, the absolute peak month showcases Sant Ferriol's highest earning potential, with monthly revenues capable of climbing to $8,743, occupancy reaching a high of 68.4%, and ADRs peaking at $333.
- Conversely, the slowest single month of the year, typically falling within the low season, marks the market's lowest point. In this month, revenue might dip to $1,546, occupancy could drop to 21.4%, and ADRs may adjust down to $278.
- Understanding both the seasonal averages and these monthly peaks and troughs in revenue, occupancy, and ADR is crucial for maximizing your Airbnb profit potential in Sant Ferriol.
Seasonal Strategies for Maximizing Profit
- Peak Season: Maximize revenue through premium pricing and potentially longer minimum stays. Ensure high availability.
- Low Season: Offer competitive pricing, special promotions (e.g., extended stay discounts), and flexible cancellation policies. Target off-season travelers like remote workers or budget-conscious guests.
- Shoulder Seasons: Implement dynamic pricing that balances peak and low rates. Target weekend travelers or specific events. Offer slightly more flexible terms than peak season.
- Regularly analyze your own performance against these Sant Ferriol seasonality benchmarks and adjust your pricing and availability strategy accordingly.
Best Areas for Airbnb Investment in Sant Ferriol (2026)
Exploring the top neighborhoods for short-term rentals in Sant Ferriol? This section highlights key areas, outlining why they are attractive for hosts and guests, along with notable local attractions. Consider these locations based on your target guest profile and investment strategy.
| Neighborhood / Area | Why Host Here? (Target Guests & Appeal) | Key Attractions & Landmarks |
|---|---|---|
| Sant Ferriol Center | The heart of Sant Ferriol, offering easy access to local amenities, shops, and restaurants. It's a charming area that attracts visitors looking for an authentic experience of rural Catalonia. | Local cafes, Cultural heritage sites, Artisan shops, Weekly markets, Historical landmarks |
| Besalú | Just a short distance from Sant Ferriol, Besalú is famous for its medieval architecture and picturesque town center. It attracts tourists interested in history and culture. | Besalú Bridge, Monastery of Sant Pere, Jewish Quarter, Besalú Castle, Local festivals |
| La Garrotxa Natural Park | A stunning natural area surrounding Sant Ferriol, ideal for nature lovers and those seeking outdoor activities. The park is known for its volcanic landscapes and hiking trails. | Volcanic craters, Hiking trails, Biodiversity, Natural hot springs, Scenic views |
| Castellfollit de la Roca | A dramatic village built on a basalt cliff, offering breathtaking views and unique photo opportunities. It attracts tourists curious about picturesque landscapes. | Basalt cliffs, Church of San Salvador, Panoramic viewpoints, Scenic walks, Local artisan shops |
| Olot | The nearest large town, known for its arts and culture scene, and as a gateway to the Garrotxa region. Attracts visitors looking for urban amenities while being close to nature. | Museu de la Garrotxa, Parc Nou, Shopping streets, Cultural events, Local gastronomy |
| Riu Fluvià | The scenic river area offers opportunities for outdoor recreation such as kayaking and cycling. It's perfect for adventure seekers and families. | Kayaking, Cycling routes, Fishing spots, Picnic areas, Natural beauty |
| Camprodon Valley | Known for its stunning landscapes and ski resorts, this valley is a favorite for winter sports enthusiasts and nature lovers year-round. | Ski resorts, Hiking paths, Flora and fauna, Mountain views, Local cuisine |
| Vall de Núria | A mountainous area with a sanctuary and access to nature trails, appealing to both religious tourists and outdoor enthusiasts looking for scenic beauty. | Núria Sanctuary, Scenic train rides, Hiking networks, Winter sports, Natural lakes |
Understanding Airbnb License Requirements & STR Laws in Sant Ferriol (2026)
Yes, Sant Ferriol, Catalonia, Spain enforces high STR regulations. Obtaining a license and ensuring compliance is almost certainly required according to current 2026 STR laws. Always verify the latest short term rental regulations and Airbnb license requirements directly with local government authorities for Sant Ferriol to ensure full compliance before hosting.
(Source: AirROI data, 2026, based on 67% licensed listings)
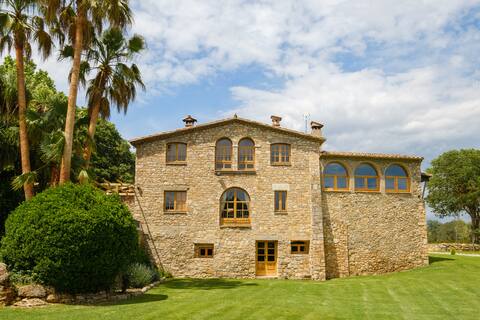
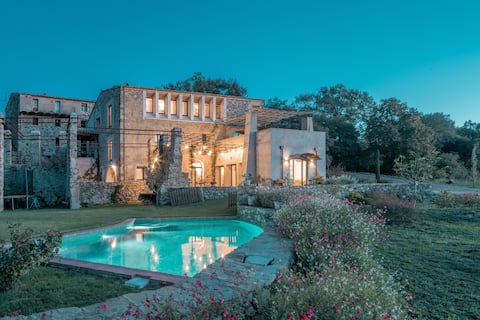
Top Performing Airbnb Properties in Sant Ferriol (2026)
Benchmark your potential! Explore examples of top-performing Airbnb properties in Sant Ferriolbased on Trailing Twelve Month (TTM) revenue. Analyze their characteristics, revenue, occupancy rate, and ADR to understand what drives success in this market.
Mas Cufí
Entire Place • 8 bedrooms
Luxurious Spanish Villa surrounded by nature
Entire Place • 7 bedrooms

Arc de Can Puig Luxury home in Sant Ferriol-Besalú
Entire Place • 7 bedrooms

Charming Isolated House in the Forest in Catalonia
Entire Place • 5 bedrooms

Apartment 10-14pax L'ARCADA DE FARES
Private Room • 5 bedrooms

B&B Can Jan
Private Room • N/A
Note: Performance varies based on location, size, amenities, seasonality, and management quality. Data reflects the past 12 months.
Top Performing Airbnb Hosts in Sant Ferriol (2026)
Learn from the best! This table showcases top-performing Airbnb hosts in Sant Ferriol based on the number of properties managed and estimated total revenue over the past year. Analyze their scale and performance metrics.
| Host Name | Properties | Grossing Revenue | Stay Reviews | Avg Rating |
|---|---|---|---|---|
| David | 1 | $251,600 | 14 | 5.00/5.0 |
| Neus | 5 | $129,848 | 151 | 4.78/5.0 |
| Grady | 1 | $120,072 | 13 | 5.00/5.0 |
| Xavier | 1 | $119,353 | 30 | 5.00/5.0 |
| Ruth | 1 | $90,530 | 47 | 4.93/5.0 |
| Kaire | 4 | $49,634 | 511 | 4.92/5.0 |
| Faustina | 2 | $45,068 | 266 | 4.85/5.0 |
| Josep Maria | 2 | $30,157 | 216 | 4.90/5.0 |
| Kevin | 1 | $25,008 | 40 | 4.95/5.0 |
Analyzing the strategies of top hosts, such as their property selection, pricing, and guest communication, can offer valuable lessons for optimizing your own Airbnb operations in Sant Ferriol.
Dive Deeper: Advanced Sant Ferriol STR Market Data (2026)
Ready to unlock more insights? AirROI provides access to advanced metrics and comprehensive Airbnb data for Sant Ferriol. Explore detailed analytics beyond this report to refine your investment strategy, optimize pricing, and maximize your vacation rental profits.
Explore Advanced MetricsSant Ferriol Short-Term Rental Market Composition (2026): Property & Room Types
Room Type Distribution
Property Type Distribution
Market Composition Insights for Sant Ferriol
- The Sant Ferriol Airbnb market composition is heavily skewed towards Entire Home/Apt listings, which make up 88.9% of the 18 active rentals. This indicates strong guest preference for privacy and space.
- Looking at the property type distribution in Sant Ferriol, Apartment/Condo properties are the most common (50%), reflecting the local real estate landscape.
- Houses represent a significant 33.3% portion, catering likely to families or larger groups.
- The presence of 5.6% Hotel/Boutique listings indicates integration with traditional hospitality.
Sant Ferriol Airbnb Room Capacity Analysis (2026): Bedroom Distribution
Distribution of Listings by Number of Bedrooms
Room Capacity Insights for Sant Ferriol
- The dominant room capacity in Sant Ferriol is 1 bedroom listings, making up 38.9% of the market. This suggests a strong demand for properties suitable for couples or solo travelers.
- Together, 1 bedroom and 5+ bedrooms properties represent 72.2% of the active Airbnb listings in Sant Ferriol, indicating a high concentration in these sizes.
- A significant 33.3% of listings offer 3+ bedrooms, catering to larger groups and families seeking more space in Sant Ferriol.
Sant Ferriol Vacation Rental Guest Capacity Trends (2026)
Distribution of Listings by Guest Capacity
Guest Capacity Insights for Sant Ferriol
- The most common guest capacity trend in Sant Ferriol vacation rentals is listings accommodating 8+ guests (33.3%). This suggests the primary traveler segment is likely larger groups.
- Properties designed for 8+ guests and 2 guests dominate the Sant Ferriol STR market, accounting for 61.1% of listings.
- 44.4% of properties accommodate 6+ guests, serving the market segment for larger families or group travel in Sant Ferriol.
- On average, properties in Sant Ferriol are equipped to host 4.8 guests.
Sant Ferriol Airbnb Booking Patterns (2026): Available vs. Booked Days
Available Days Distribution
Booked Days Distribution
Booking Pattern Insights for Sant Ferriol
- The most common availability pattern in Sant Ferriol falls within the 181-270 days range, representing 50% of listings. This suggests many properties have significant open periods on their calendars.
- Approximately 72.2% of listings show high availability (181+ days open annually), indicating potential for increased bookings or specific owner usage patterns.
- For booked days, the 91-180 days range is most frequent in Sant Ferriol (50%), reflecting common guest stay durations or potential owner blocking patterns.
- A notable 27.8% of properties secure long booking periods (181+ days booked per year), highlighting successful long-term rental strategies or significant owner usage.
Sant Ferriol Airbnb Minimum Stay Requirements Analysis
Distribution of Listings by Minimum Night Requirement
2 Nights
4 listings
22.2% of total
3 Nights
1 listings
5.6% of total
30+ Nights
13 listings
72.2% of total
Key Insights
- The most prevalent minimum stay requirement in Sant Ferriol is 30+ Nights, adopted by 72.2% of listings. This highlights the market's preference for longer commitments.
- A significant segment (72.2%) caters to monthly stays (30+ nights) in Sant Ferriol, pointing to opportunities in the extended-stay market.
Recommendations
- Align with the market by considering a 30+ Nights minimum stay, as 72.2% of Sant Ferriol hosts use this setting.
- Explore offering discounts for stays of 30+ nights to attract the 72.2% of the market seeking extended stays.
- Adjust minimum nights based on seasonality – potentially shorter during low season and longer during peak demand periods in Sant Ferriol.
Sant Ferriol Airbnb Cancellation Policy Trends Analysis (2026)
Flexible
5 listings
27.8% of total
Moderate
1 listings
5.6% of total
Firm
10 listings
55.6% of total
Strict
2 listings
11.1% of total
Cancellation Policy Insights for Sant Ferriol
- The prevailing Airbnb cancellation policy trend in Sant Ferriol is Firm, used by 55.6% of listings.
- A majority (66.7%) of hosts in Sant Ferriol utilize Firm or Strict policies, indicating a market where hosts prioritize booking security.
Recommendations for Hosts
- Consider adopting a Firm policy to align with the 55.6% market standard in Sant Ferriol.
- Using a Strict policy might deter some guests, as only 11.1% of listings use it. Evaluate if potential revenue protection outweighs possible lower booking rates.
- Regularly review your cancellation policy against competitors and market demand shifts in Sant Ferriol.
Sant Ferriol STR Booking Lead Time Analysis (2026)
Average Booking Lead Time by Month
Booking Lead Time Insights for Sant Ferriol
- The overall average booking lead time for vacation rentals in Sant Ferriol is 105 days.
- Guests book furthest in advance for stays during September (average 152 days), likely coinciding with peak travel demand or local events.
- The shortest booking windows occur for stays in February (average 50 days), indicating more last-minute travel plans during this time.
- Seasonally, Fall (135 days avg.) sees the longest lead times, while Winter (74 days avg.) has the shortest, reflecting typical travel planning cycles.
Recommendations for Hosts
- Use the overall average lead time (105 days) as a baseline for your pricing and availability strategy in Sant Ferriol.
- For September stays, consider implementing length-of-stay discounts or slightly higher rates for bookings made less than 152 days out to capitalize on advance planning.
- Target marketing efforts for the Fall season well in advance (at least 135 days) to capture early planners.
- Monitor your own booking lead times against these Sant Ferriol averages to identify opportunities for dynamic pricing adjustments.
Popular & Essential Airbnb Amenities in Sant Ferriol (2026)
Amenity Prevalence
Amenity Insights for Sant Ferriol
- Essential amenities in Sant Ferriol that guests expect include: Wifi. Lacking these (this) could significantly impact bookings.
- Popular amenities like Refrigerator, Dishes and silverware, Heating are common but not universal. Offering these can provide a competitive edge.
Recommendations for Hosts
- Ensure your listing includes all essential amenities for Sant Ferriol: Wifi.
- Consider adding popular differentiators like Refrigerator or Dishes and silverware to increase appeal.
- Highlight unique or less common amenities you offer (e.g., hot tub, dedicated workspace, EV charger) in your listing description and photos.
- Regularly check competitor amenities in Sant Ferriol to stay competitive.
Sant Ferriol Airbnb Guest Demographics & Profile Analysis (2026)
Guest Profile Summary for Sant Ferriol
- The typical guest profile for Airbnb in Sant Ferriol consists of a mix of domestic (35%) and international guests, with top international origins including France, typically belonging to the Post-2000s (Gen Z/Alpha) group (50%), primarily speaking English or Spanish.
- Domestic travelers account for 35.0% of guests.
- Key international markets include Spain (35%) and France (22.5%).
- Top languages spoken are English (32.9%) followed by Spanish (23.4%).
- A significant demographic segment is the Post-2000s (Gen Z/Alpha) group, representing 50% of guests.
Recommendations for Hosts
- Focus marketing internationally, particularly towards travelers from France.
- Tailor amenities and listing descriptions to appeal to the dominant Post-2000s (Gen Z/Alpha) demographic (e.g., highlight fast WiFi, smart home features, local guides).
- Highlight unique local experiences or amenities relevant to the primary guest profile.
- Consider seasonal promotions aligned with peak travel times for key origin markets.
Nearby Short-Term Rental Market Comparison
How does the Sant Ferriol Airbnb market stack up against its neighbors? Compare key performance metrics like average monthly revenue, ADR, and occupancy rates in surrounding areas to understand the broader regional STR landscape.
| Market | Active Properties | Monthly Revenue | Daily Rate | Avg. Occupancy |
|---|---|---|---|---|
| Vall-llobrega | 18 | $10,253 | $778.88 | 45% |
| Canyelles | 47 | $7,127 | $1152.36 | 35% |
| Cornellà del Terri | 15 | $6,458 | $584.61 | 40% |
| Vallirana | 10 | $5,639 | $350.46 | 57% |
| Tiana | 15 | $5,135 | $362.37 | 45% |
| Sant Vicenç de Montalt | 40 | $5,005 | $422.72 | 39% |
| Amer | 11 | $4,949 | $462.57 | 38% |
| Sant Andreu de Llavaneres | 45 | $4,931 | $450.05 | 41% |
| Teià | 25 | $4,821 | $394.46 | 40% |
| Premià de Dalt | 31 | $4,548 | $337.99 | 47% |