Vall-llobrega Airbnb Market Analysis 2026: Short Term Rental Data & Vacation Rental Statistics in Catalonia, Spain
Is Airbnb profitable in Vall-llobrega in 2026? Explore comprehensive Airbnb analytics for Vall-llobrega, Catalonia, Spain to uncover income potential. This 2026 STR market report for Vall-llobrega, based on AirROI data from February 2025 to January 2026, reveals key trends in the niche market of 18 active listings.
Whether you're considering an Airbnb investment in Vall-llobrega, optimizing your existing vacation rental, or exploring rental arbitrage opportunities, understanding the Vall-llobrega Airbnb data is crucial. Navigating the high regulation landscape is key to maximizing your short term rental income potential. Let's dive into the specifics.
Key Vall-llobrega Airbnb Performance Metrics Overview
Monthly Airbnb Revenue Variations & Income Potential in Vall-llobrega (2026)
Understanding the monthly revenue variations for Airbnb listings in Vall-llobrega is key to maximizing your short term rental income potential. Seasonality significantly impacts earnings. Our analysis, based on data from the past 12 months, shows that the peak revenue month for STRs in Vall-llobrega is typically August, while February often presents the lowest earnings, highlighting opportunities for strategic pricing adjustments during shoulder and low seasons. Explore the typical Airbnb income in Vall-llobrega across different performance tiers:
- Best-in-class properties (Top 10%) achieve $46,896+ monthly, often utilizing dynamic pricing and superior guest experiences.
- Strong performing properties (Top 25%) earn $16,250 or more, indicating effective management and desirable locations/amenities.
- Typical properties (Median) generate around $5,535 per month, representing the average market performance.
- Entry-level properties (Bottom 25%) see earnings around $3,098, often with potential for optimization.
Average Monthly Airbnb Earnings Trend in Vall-llobrega
Vall-llobrega Airbnb Occupancy Rate Trends (2026)
Maximize your bookings by understanding the Vall-llobrega STR occupancy trends. Seasonal demand shifts significantly influence how often properties are booked. Typically, Augustsees the highest demand (peak season occupancy), while January experiences the lowest (low season). Effective strategies, like adjusting minimum stays or offering promotions, can boost occupancy during slower periods. Here's how different property tiers perform in Vall-llobrega:
- Best-in-class properties (Top 10%) achieve 76%+ occupancy, indicating high desirability and potentially optimized availability.
- Strong performing properties (Top 25%) maintain 65% or higher occupancy, suggesting good market fit and guest satisfaction.
- Typical properties (Median) have an occupancy rate around 42%.
- Entry-level properties (Bottom 25%) average 23% occupancy, potentially facing higher vacancy.
Average Monthly Occupancy Rate Trend in Vall-llobrega
Average Daily Rate (ADR) Airbnb Trends in Vall-llobrega (2026)
Effective short term rental pricing strategy in Vall-llobrega involves understanding monthly ADR fluctuations. The Average Daily Rate (ADR) for Airbnb in Vall-llobrega typically peaks in August and dips lowest during March. Leveraging Airbnb dynamic pricing tools or strategies based on this seasonality can significantly boost revenue. Here's a look at the typical nightly rates achieved:
- Best-in-class properties (Top 10%) command rates of $1,994+ per night, often due to premium features or locations.
- Strong performing properties (Top 25%) achieve nightly rates of $986 or more.
- Typical properties (Median) charge around $446 per night.
- Entry-level properties (Bottom 25%) earn around $254 per night.
Average Daily Rate (ADR) Trend by Month in Vall-llobrega
Get Live Vall-llobrega Market Intelligence 👇

Explore Real-time Analytics
Airbnb Seasonality Analysis & Trends in Vall-llobrega (2026)
Peak Season (August, July, June)
- Revenue averages $25,729 per month
- Occupancy rates average 67.9%
- Daily rates average $869
Shoulder Season
- Revenue averages $12,603 per month
- Occupancy maintains around 45.6%
- Daily rates hold near $693
Low Season (January, February, December)
- Revenue drops to average $4,899 per month
- Occupancy decreases to average 23.4%
- Daily rates adjust to average $674
Seasonality Insights for Vall-llobrega
- The Airbnb seasonality in Vall-llobrega shows highly seasonal trends requiring careful strategy. While the sections above show seasonal averages, it's also insightful to look at the extremes:
- During the high season, the absolute peak month showcases Vall-llobrega's highest earning potential, with monthly revenues capable of climbing to $30,664, occupancy reaching a high of 79.0%, and ADRs peaking at $908.
- Conversely, the slowest single month of the year, typically falling within the low season, marks the market's lowest point. In this month, revenue might dip to $3,483, occupancy could drop to 17.9%, and ADRs may adjust down to $597.
- Understanding both the seasonal averages and these monthly peaks and troughs in revenue, occupancy, and ADR is crucial for maximizing your Airbnb profit potential in Vall-llobrega.
Seasonal Strategies for Maximizing Profit
- Peak Season: Maximize revenue through premium pricing and potentially longer minimum stays. Ensure high availability.
- Low Season: Offer competitive pricing, special promotions (e.g., extended stay discounts), and flexible cancellation policies. Target off-season travelers like remote workers or budget-conscious guests.
- Shoulder Seasons: Implement dynamic pricing that balances peak and low rates. Target weekend travelers or specific events. Offer slightly more flexible terms than peak season.
- Regularly analyze your own performance against these Vall-llobrega seasonality benchmarks and adjust your pricing and availability strategy accordingly.
Best Areas for Airbnb Investment in Vall-llobrega (2026)
Exploring the top neighborhoods for short-term rentals in Vall-llobrega? This section highlights key areas, outlining why they are attractive for hosts and guests, along with notable local attractions. Consider these locations based on your target guest profile and investment strategy.
| Neighborhood / Area | Why Host Here? (Target Guests & Appeal) | Key Attractions & Landmarks |
|---|---|---|
| Costa Brava | Renowned for its stunning coastline, this area attracts beach lovers and outdoor enthusiasts. The mix of beautiful beaches, charming villages, and local cuisine make it a prime location for tourists. | Tossa de Mar, Calella de Palafrugell, Lloret de Mar, Cap Roig Botanical Garden, Castell de Begur |
| Palafrugell | A charming town located inland from the coast, Palafrugell is popular for its local markets and access to nearby beaches, making it a great spot for visitors looking for culture and relaxation. | Cala de Llafranc, Platja de Port-Bo, El Far de Sant Sebastià, Museu del Suro, Enoteca de Llafranc |
| Platja d'Aro | A vibrant tourist destination with a lively beach scene, known for its shopping, entertainment, and dining options. It's perfect for families and young people alike. | Platja Gran, Cala del Pi, Aquadiver Water Park, Caminos de Ronda, Castell d'Aro |
| Begur | Famous for its coves and historical sites, Begur offers a mix of beaches and medieval charm. Attracts travelers interested in picturesque views and historical exploration. | Begur Castle, Cala de Aiguablava, Cala d'Es Codolar, Coves d'Alguer, Platges de Begur |
| L'Escala | Known for its anchovy industry and historical ruins, L'Escala offers a unique cultural experience along with beautiful beaches, attracting a diverse crowd of tourists. | Ruins of Empúries, Platja de les Barques, Parc Natural dels Aiguamolls de l'Empordà, Museo de la Anchoa, Aiguamolls Natural Park |
| Tossa de Mar | A picturesque town with a rich history, famous for its medieval castle and town walls. Great for visitors interested in history and scenic routes. | Vila Vella (Old Town), Tossa de Mar Beach, Museum of Modernism, Es Franch Beach, Cala Bona |
| Calonge | A medieval village that offers charm and tranquility, combined with proximity to the coast. Suitable for visitors interested in local culture and wine tourism. | Castell de Calonge, Cala de Roca del Paller, Vins de Calonge, Cala de Cap Roig, Gastronomy routes |
| Sant Feliu de Guíxols | A coastal town with a rich history, known for its monastery and beautiful beaches. It attracts tourists looking for relaxation and culture. | Monestir de Sant Feliu de Guíxols, Platja de San Pol, Cala del Vigatà, Sant Feliu de Guíxols Museum, Xalet Sant Anastasi |
Understanding Airbnb License Requirements & STR Laws in Vall-llobrega (2026)
Yes, Vall-llobrega, Catalonia, Spain enforces high STR regulations. Obtaining a license and ensuring compliance is almost certainly required according to current 2026 STR laws. Always verify the latest short term rental regulations and Airbnb license requirements directly with local government authorities for Vall-llobrega to ensure full compliance before hosting.
(Source: AirROI data, 2026, based on 94% licensed listings)
Top Performing Airbnb Properties in Vall-llobrega (2026)
Benchmark your potential! Explore examples of top-performing Airbnb properties in Vall-llobregabased on Trailing Twelve Month (TTM) revenue. Analyze their characteristics, revenue, occupancy rate, and ADR to understand what drives success in this market.
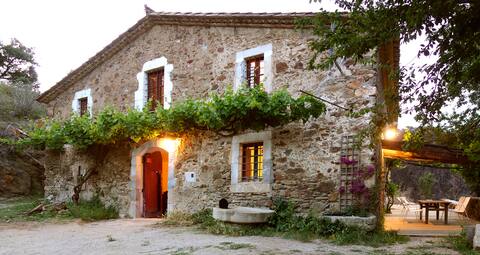
Mas dels Avis "Typical Catalan Farmhouse"
Entire Place • 4 bedrooms

Can Candiu. Entire establishment of 2 houses
Entire Place • 6 bedrooms
Cal Nano (Casa Rural)
Entire Place • 3 bedrooms
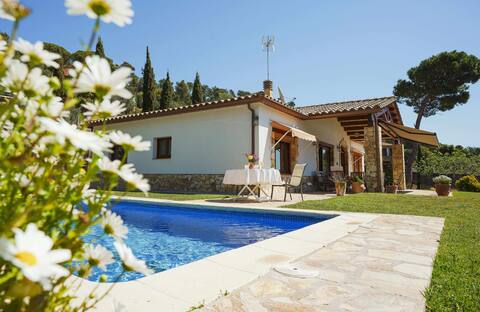
Rustic "Mas" farmhouse Emporda/Costa Brava/Girona
Entire Place • 6 bedrooms

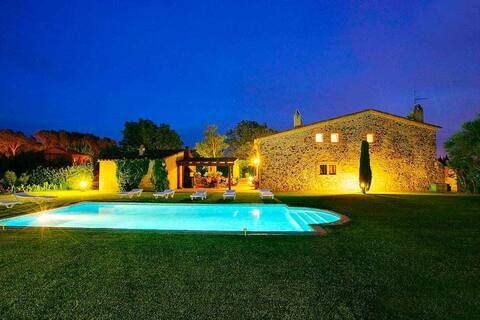
Private Mediterranean Villa
Entire Place • 4 bedrooms

SaLlum: Ibizan style, luxe, design & relax.
Entire Place • 4 bedrooms
Note: Performance varies based on location, size, amenities, seasonality, and management quality. Data reflects the past 12 months.
Top Performing Airbnb Hosts in Vall-llobrega (2026)
Learn from the best! This table showcases top-performing Airbnb hosts in Vall-llobrega based on the number of properties managed and estimated total revenue over the past year. Analyze their scale and performance metrics.
| Host Name | Properties | Grossing Revenue | Stay Reviews | Avg Rating |
|---|---|---|---|---|
| Adria | 2 | $1,179,635 | 69 | 5.00/5.0 |
| Robi | 1 | $400,775 | 54 | 4.87/5.0 |
| Denise | 2 | $109,444 | 94 | 5.00/5.0 |
| Michele | 1 | $83,717 | 71 | 4.89/5.0 |
| Mariona | 1 | $79,518 | 7 | 4.86/5.0 |
| Carmen | 1 | $76,056 | 8 | 5.00/5.0 |
| Integral | 2 | $65,441 | 3 | Not Rated |
| Barbara | 1 | $45,142 | 2 | Not Rated |
| Welcs | 1 | $42,066 | 6 | 4.00/5.0 |
| Marta | 1 | $39,498 | 67 | 4.96/5.0 |
Analyzing the strategies of top hosts, such as their property selection, pricing, and guest communication, can offer valuable lessons for optimizing your own Airbnb operations in Vall-llobrega.
Dive Deeper: Advanced Vall-llobrega STR Market Data (2026)
Ready to unlock more insights? AirROI provides access to advanced metrics and comprehensive Airbnb data for Vall-llobrega. Explore detailed analytics beyond this report to refine your investment strategy, optimize pricing, and maximize your vacation rental profits.
Explore Advanced MetricsVall-llobrega Short-Term Rental Market Composition (2026): Property & Room Types
Room Type Distribution
Property Type Distribution
Market Composition Insights for Vall-llobrega
- The Vall-llobrega Airbnb market composition is heavily skewed towards Entire Home/Apt listings, which make up 100% of the 18 active rentals. This indicates strong guest preference for privacy and space.
- Looking at the property type distribution in Vall-llobrega, House properties are the most common (77.8%), reflecting the local real estate landscape.
- Houses represent a significant 77.8% portion, catering likely to families or larger groups.
Vall-llobrega Airbnb Room Capacity Analysis (2026): Bedroom Distribution
Distribution of Listings by Number of Bedrooms
Room Capacity Insights for Vall-llobrega
- The dominant room capacity in Vall-llobrega is 4 bedrooms listings, making up 33.3% of the market. This suggests a strong demand for properties suitable for families or small groups.
- Together, 4 bedrooms and 5+ bedrooms properties represent 61.1% of the active Airbnb listings in Vall-llobrega, indicating a high concentration in these sizes.
- A significant 77.8% of listings offer 3+ bedrooms, catering to larger groups and families seeking more space in Vall-llobrega.
Vall-llobrega Vacation Rental Guest Capacity Trends (2026)
Distribution of Listings by Guest Capacity
Guest Capacity Insights for Vall-llobrega
- The most common guest capacity trend in Vall-llobrega vacation rentals is listings accommodating 8+ guests (61.1%). This suggests the primary traveler segment is likely larger groups.
- Properties designed for 8+ guests and 2 guests dominate the Vall-llobrega STR market, accounting for 77.8% of listings.
- 77.8% of properties accommodate 6+ guests, serving the market segment for larger families or group travel in Vall-llobrega.
- On average, properties in Vall-llobrega are equipped to host 6.4 guests.
Vall-llobrega Airbnb Booking Patterns (2026): Available vs. Booked Days
Available Days Distribution
Booked Days Distribution
Booking Pattern Insights for Vall-llobrega
- The most common availability pattern in Vall-llobrega falls within the 271-366 days range, representing 50% of listings. This suggests many properties have significant open periods on their calendars.
- Approximately 72.2% of listings show high availability (181+ days open annually), indicating potential for increased bookings or specific owner usage patterns.
- For booked days, the 31-90 days range is most frequent in Vall-llobrega (33.3%), reflecting common guest stay durations or potential owner blocking patterns.
- A notable 27.8% of properties secure long booking periods (181+ days booked per year), highlighting successful long-term rental strategies or significant owner usage.
Vall-llobrega Airbnb Minimum Stay Requirements Analysis
Distribution of Listings by Minimum Night Requirement
1 Night
3 listings
16.7% of total
2 Nights
1 listings
5.6% of total
3 Nights
1 listings
5.6% of total
4-6 Nights
4 listings
22.2% of total
7-29 Nights
1 listings
5.6% of total
30+ Nights
8 listings
44.4% of total
Key Insights
- The most prevalent minimum stay requirement in Vall-llobrega is 30+ Nights, adopted by 44.4% of listings. This highlights the market's preference for longer commitments.
- A significant segment (44.4%) caters to monthly stays (30+ nights) in Vall-llobrega, pointing to opportunities in the extended-stay market.
Recommendations
- Align with the market by considering a 30+ Nights minimum stay, as 44.4% of Vall-llobrega hosts use this setting.
- If feasible, allowing 1-night stays, especially midweek or during low season, could capture last-minute bookings, as only 16.7% currently do.
- Explore offering discounts for stays of 30+ nights to attract the 44.4% of the market seeking extended stays.
- Adjust minimum nights based on seasonality – potentially shorter during low season and longer during peak demand periods in Vall-llobrega.
Vall-llobrega Airbnb Cancellation Policy Trends Analysis (2026)
Flexible
1 listings
5.6% of total
Moderate
1 listings
5.6% of total
Firm
11 listings
61.1% of total
Strict
5 listings
27.8% of total
Cancellation Policy Insights for Vall-llobrega
- The prevailing Airbnb cancellation policy trend in Vall-llobrega is Firm, used by 61.1% of listings.
- A majority (88.9%) of hosts in Vall-llobrega utilize Firm or Strict policies, indicating a market where hosts prioritize booking security.
Recommendations for Hosts
- Consider adopting a Firm policy to align with the 61.1% market standard in Vall-llobrega.
- Regularly review your cancellation policy against competitors and market demand shifts in Vall-llobrega.
Vall-llobrega STR Booking Lead Time Analysis (2026)
Average Booking Lead Time by Month
Booking Lead Time Insights for Vall-llobrega
- The overall average booking lead time for vacation rentals in Vall-llobrega is 69 days.
- Guests book furthest in advance for stays during August (average 128 days), likely coinciding with peak travel demand or local events.
- The shortest booking windows occur for stays in January (average 20 days), indicating more last-minute travel plans during this time.
- Seasonally, Summer (111 days avg.) sees the longest lead times, while Winter (31 days avg.) has the shortest, reflecting typical travel planning cycles.
Recommendations for Hosts
- Use the overall average lead time (69 days) as a baseline for your pricing and availability strategy in Vall-llobrega.
- For August stays, consider implementing length-of-stay discounts or slightly higher rates for bookings made less than 128 days out to capitalize on advance planning.
- Target marketing efforts for the Summer season well in advance (at least 111 days) to capture early planners.
- Monitor your own booking lead times against these Vall-llobrega averages to identify opportunities for dynamic pricing adjustments.
Popular & Essential Airbnb Amenities in Vall-llobrega (2026)
Amenity Prevalence
Amenity Insights for Vall-llobrega
- Essential amenities in Vall-llobrega that guests expect include: Refrigerator, Coffee maker, Free parking on premises, Hair dryer, Washer, Wifi, Dishes and silverware. Lacking these (any) could significantly impact bookings.
- Popular amenities like Microwave, Cooking basics, Patio or balcony are common but not universal. Offering these can provide a competitive edge.
Recommendations for Hosts
- Ensure your listing includes all essential amenities for Vall-llobrega: Refrigerator, Coffee maker, Free parking on premises, Hair dryer, Washer, Wifi, Dishes and silverware.
- Consider adding popular differentiators like Microwave or Cooking basics to increase appeal.
- Highlight unique or less common amenities you offer (e.g., hot tub, dedicated workspace, EV charger) in your listing description and photos.
- Regularly check competitor amenities in Vall-llobrega to stay competitive.
Vall-llobrega Airbnb Guest Demographics & Profile Analysis (2026)
Guest Profile Summary for Vall-llobrega
- The typical guest profile for Airbnb in Vall-llobrega consists of predominantly international visitors (87%), with top international origins including France, typically belonging to the Post-2000s (Gen Z/Alpha) group (50%), primarily speaking English or French.
- Domestic travelers account for 12.9% of guests.
- Key international markets include United Kingdom (22.9%) and France (21.4%).
- Top languages spoken are English (36.8%) followed by French (23.5%).
- A significant demographic segment is the Post-2000s (Gen Z/Alpha) group, representing 50% of guests.
Recommendations for Hosts
- Focus marketing internationally, particularly towards travelers from France.
- Tailor amenities and listing descriptions to appeal to the dominant Post-2000s (Gen Z/Alpha) demographic (e.g., highlight fast WiFi, smart home features, local guides).
- Highlight unique local experiences or amenities relevant to the primary guest profile.
- Consider seasonal promotions aligned with peak travel times for key origin markets.
Nearby Short-Term Rental Market Comparison
How does the Vall-llobrega Airbnb market stack up against its neighbors? Compare key performance metrics like average monthly revenue, ADR, and occupancy rates in surrounding areas to understand the broader regional STR landscape.
| Market | Active Properties | Monthly Revenue | Daily Rate | Avg. Occupancy |
|---|---|---|---|---|
| Cornellà del Terri | 15 | $6,458 | $584.61 | 40% |
| Tiana | 15 | $5,135 | $362.37 | 45% |
| Sant Vicenç de Montalt | 40 | $5,005 | $422.72 | 39% |
| Amer | 11 | $4,949 | $462.57 | 38% |
| Sant Andreu de Llavaneres | 45 | $4,931 | $450.05 | 41% |
| Teià | 25 | $4,821 | $394.47 | 40% |
| Premià de Dalt | 31 | $4,548 | $337.99 | 47% |
| Alella | 39 | $4,534 | $496.22 | 47% |
| Vilanant | 12 | $4,526 | $404.10 | 36% |
| Porqueres | 13 | $4,304 | $512.14 | 31% |