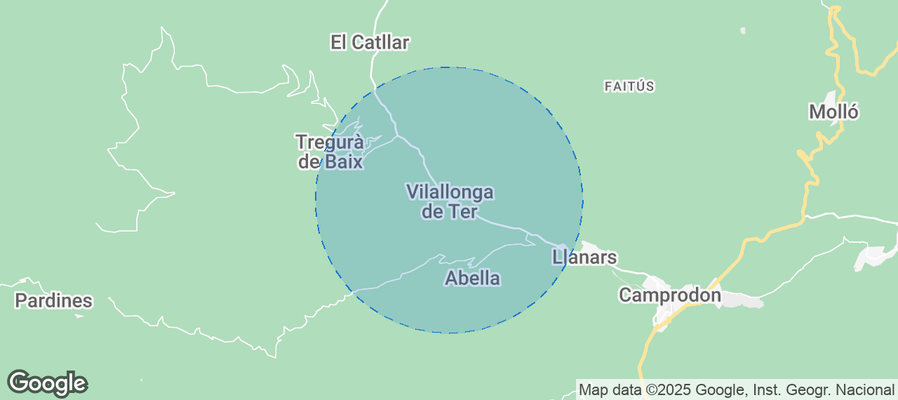
Vilallonga de Ter Airbnb Market Analysis 2026: Short Term Rental Data & Vacation Rental Statistics in Catalonia, Spain
Is Airbnb profitable in Vilallonga de Ter in 2026? Explore comprehensive Airbnb analytics for Vilallonga de Ter, Catalonia, Spain to uncover income potential. This 2026 STR market report for Vilallonga de Ter, based on AirROI data from February 2025 to January 2026, reveals key trends in the niche market of 18 active listings.
Whether you're considering an Airbnb investment in Vilallonga de Ter, optimizing your existing vacation rental, or exploring rental arbitrage opportunities, understanding the Vilallonga de Ter Airbnb data is crucial. Navigating the high regulation landscape is key to maximizing your short term rental income potential. Let's dive into the specifics.
Key Vilallonga de Ter Airbnb Performance Metrics Overview
Monthly Airbnb Revenue Variations & Income Potential in Vilallonga de Ter (2026)
Understanding the monthly revenue variations for Airbnb listings in Vilallonga de Ter is key to maximizing your short term rental income potential. Seasonality significantly impacts earnings. Our analysis, based on data from the past 12 months, shows that the peak revenue month for STRs in Vilallonga de Ter is typically July, while January often presents the lowest earnings, highlighting opportunities for strategic pricing adjustments during shoulder and low seasons. Explore the typical Airbnb income in Vilallonga de Ter across different performance tiers:
- Best-in-class properties (Top 10%) achieve $3,519+ monthly, often utilizing dynamic pricing and superior guest experiences.
- Strong performing properties (Top 25%) earn $2,622 or more, indicating effective management and desirable locations/amenities.
- Typical properties (Median) generate around $1,543 per month, representing the average market performance.
- Entry-level properties (Bottom 25%) see earnings around $813, often with potential for optimization.
Average Monthly Airbnb Earnings Trend in Vilallonga de Ter
Vilallonga de Ter Airbnb Occupancy Rate Trends (2026)
Maximize your bookings by understanding the Vilallonga de Ter STR occupancy trends. Seasonal demand shifts significantly influence how often properties are booked. Typically, Augustsees the highest demand (peak season occupancy), while January experiences the lowest (low season). Effective strategies, like adjusting minimum stays or offering promotions, can boost occupancy during slower periods. Here's how different property tiers perform in Vilallonga de Ter:
- Best-in-class properties (Top 10%) achieve 73%+ occupancy, indicating high desirability and potentially optimized availability.
- Strong performing properties (Top 25%) maintain 54% or higher occupancy, suggesting good market fit and guest satisfaction.
- Typical properties (Median) have an occupancy rate around 31%.
- Entry-level properties (Bottom 25%) average 18% occupancy, potentially facing higher vacancy.
Average Monthly Occupancy Rate Trend in Vilallonga de Ter
Average Daily Rate (ADR) Airbnb Trends in Vilallonga de Ter (2026)
Effective short term rental pricing strategy in Vilallonga de Ter involves understanding monthly ADR fluctuations. The Average Daily Rate (ADR) for Airbnb in Vilallonga de Ter typically peaks in July and dips lowest during March. Leveraging Airbnb dynamic pricing tools or strategies based on this seasonality can significantly boost revenue. Here's a look at the typical nightly rates achieved:
- Best-in-class properties (Top 10%) command rates of $324+ per night, often due to premium features or locations.
- Strong performing properties (Top 25%) achieve nightly rates of $166 or more.
- Typical properties (Median) charge around $145 per night.
- Entry-level properties (Bottom 25%) earn around $119 per night.
Average Daily Rate (ADR) Trend by Month in Vilallonga de Ter
Get Live Vilallonga de Ter Market Intelligence 👇
Explore Real-time Analytics
Airbnb Seasonality Analysis & Trends in Vilallonga de Ter (2026)
Peak Season (July, August, March)
- Revenue averages $2,655 per month
- Occupancy rates average 51.4%
- Daily rates average $175
Shoulder Season
- Revenue averages $1,729 per month
- Occupancy maintains around 36.5%
- Daily rates hold near $174
Low Season (January, February, June)
- Revenue drops to average $1,340 per month
- Occupancy decreases to average 29.1%
- Daily rates adjust to average $171
Seasonality Insights for Vilallonga de Ter
- The Airbnb seasonality in Vilallonga de Ter shows highly seasonal trends requiring careful strategy. While the sections above show seasonal averages, it's also insightful to look at the extremes:
- During the high season, the absolute peak month showcases Vilallonga de Ter's highest earning potential, with monthly revenues capable of climbing to $3,041, occupancy reaching a high of 59.8%, and ADRs peaking at $182.
- Conversely, the slowest single month of the year, typically falling within the low season, marks the market's lowest point. In this month, revenue might dip to $1,293, occupancy could drop to 24.3%, and ADRs may adjust down to $161.
- Understanding both the seasonal averages and these monthly peaks and troughs in revenue, occupancy, and ADR is crucial for maximizing your Airbnb profit potential in Vilallonga de Ter.
Seasonal Strategies for Maximizing Profit
- Peak Season: Maximize revenue through premium pricing and potentially longer minimum stays. Ensure high availability.
- Low Season: Offer competitive pricing, special promotions (e.g., extended stay discounts), and flexible cancellation policies. Target off-season travelers like remote workers or budget-conscious guests.
- Shoulder Seasons: Implement dynamic pricing that balances peak and low rates. Target weekend travelers or specific events. Offer slightly more flexible terms than peak season.
- Regularly analyze your own performance against these Vilallonga de Ter seasonality benchmarks and adjust your pricing and availability strategy accordingly.
Best Areas for Airbnb Investment in Vilallonga de Ter (2026)
Exploring the top neighborhoods for short-term rentals in Vilallonga de Ter? This section highlights key areas, outlining why they are attractive for hosts and guests, along with notable local attractions. Consider these locations based on your target guest profile and investment strategy.
| Neighborhood / Area | Why Host Here? (Target Guests & Appeal) | Key Attractions & Landmarks |
|---|---|---|
| Vilallonga de Ter Center | The heart of Vilallonga de Ter provides easy access to local shops, restaurants, and the scenic beauty of the surrounding valley, making it a great base for tourists. | Church of Sant Pere, Local cuisine restaurants, Nearby hiking trails, Cultural events, Natural parks |
| Montesquiu Castle Area | This area offers historical heritage with the Montesquiu Castle, attracting visitors interested in history and nature walks. | Montesquiu Castle, Castle park, Nature trails, Picnic areas, Cultural heritage sites |
| Riverside Walks | The scenic riverside walks provide a serene atmosphere for nature lovers and families looking for relaxing outdoor activities. | Ter River, Walking and biking paths, Fishing spots, Picnic areas, Quiet spots for relaxation |
| La Creueta | A beautiful viewpoint area that attracts hikers and nature enthusiasts, ideal for those seeking adventure and breathtaking views. | Hiking routes, Viewpoints of the valley, Wildlife watching, Nature photography opportunities, Camping spots |
| Cerdanya Valley Access | This area serves as a gateway to the beautiful Cerdanya valley, popular for skiing in winter and hiking in summer, attracting year-round tourists. | Ski resorts, Summer hiking trails, Scenic landscapes, Outdoor sports, Cerdanya village visits |
| Cultural Local Festivals | During certain times of the year, Vilallonga hosts local festivals that attract visitors interested in cultural experiences and local traditions. | Cultural festivals, Local artisan markets, Food fairs, Music and dance events, Historical reenactments |
| Nearby Lakes | The lakes near Vilallonga are perfect for water sports and leisure, making it attractive for families and adventure seekers in the summer. | Lake of Banyoles, Kayaking and paddleboarding, Fishing areas, Lakeside picnics, Scenic views |
| Mountain Biking Trails | The area offers extensive mountain biking trails that attract adventure sports enthusiasts looking for thrills in the landscapes. | Mountain biking trails, Bike rentals, Scenic routes, Trail maps, Biking competitions |
Understanding Airbnb License Requirements & STR Laws in Vilallonga de Ter (2026)
Yes, Vilallonga de Ter, Catalonia, Spain enforces high STR regulations. Obtaining a license and ensuring compliance is almost certainly required according to current 2026 STR laws. Always verify the latest short term rental regulations and Airbnb license requirements directly with local government authorities for Vilallonga de Ter to ensure full compliance before hosting.
(Source: AirROI data, 2026, based on 100% licensed listings)
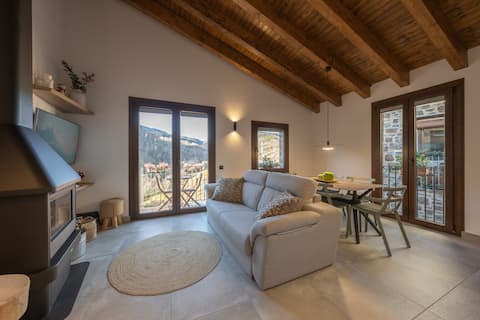
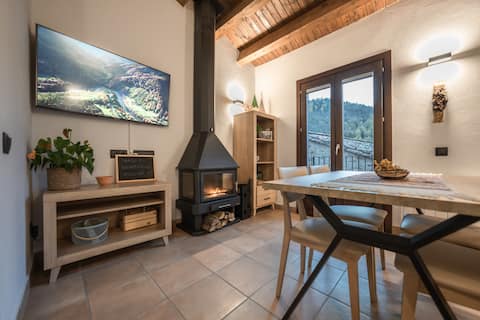
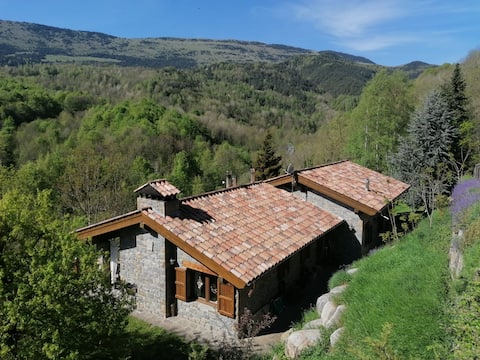
Top Performing Airbnb Properties in Vilallonga de Ter (2026)
Benchmark your potential! Explore examples of top-performing Airbnb properties in Vilallonga de Terbased on Trailing Twelve Month (TTM) revenue. Analyze their characteristics, revenue, occupancy rate, and ADR to understand what drives success in this market.

Ca la Cloe de la Roca - Ideal couples
Entire Place • 1 bedroom

Can Roc, feel nature in the Camprodon Valley
Entire Place • 1 bedroom

CHALET EN SETCASES!! A 15KM DE PISTAS D'ESQUIAR!!!
Entire Place • 3 bedrooms
Can Sunyer, feel nature in the Camprodon Valley
Entire Place • 2 bedrooms
El Racó, being nature in the Camprodon Valley
Entire Place • 2 bedrooms
Mountain chalet - Les Pedres
Entire Place • 3 bedrooms
Note: Performance varies based on location, size, amenities, seasonality, and management quality. Data reflects the past 12 months.
Top Performing Airbnb Hosts in Vilallonga de Ter (2026)
Learn from the best! This table showcases top-performing Airbnb hosts in Vilallonga de Ter based on the number of properties managed and estimated total revenue over the past year. Analyze their scale and performance metrics.
| Host Name | Properties | Grossing Revenue | Stay Reviews | Avg Rating |
|---|---|---|---|---|
| Laia | 3 | $72,166 | 62 | 4.99/5.0 |
| Anna | 1 | $36,892 | 149 | 4.99/5.0 |
| Lourdes | 3 | $33,729 | 36 | 4.97/5.0 |
| Uri | 1 | $20,858 | 13 | 4.85/5.0 |
| Arnau | 1 | $17,688 | 15 | 4.60/5.0 |
| Gerard | 1 | $16,995 | 17 | 4.94/5.0 |
| Joan | 1 | $12,621 | 9 | 4.78/5.0 |
| Tincuta Monica | 1 | $11,580 | 36 | 4.81/5.0 |
| Núria | 1 | $10,859 | 1 | Not Rated |
| Maria | 1 | $8,877 | 7 | 4.71/5.0 |
Analyzing the strategies of top hosts, such as their property selection, pricing, and guest communication, can offer valuable lessons for optimizing your own Airbnb operations in Vilallonga de Ter.
Dive Deeper: Advanced Vilallonga de Ter STR Market Data (2026)
Ready to unlock more insights? AirROI provides access to advanced metrics and comprehensive Airbnb data for Vilallonga de Ter. Explore detailed analytics beyond this report to refine your investment strategy, optimize pricing, and maximize your vacation rental profits.
Explore Advanced MetricsVilallonga de Ter Short-Term Rental Market Composition (2026): Property & Room Types
Room Type Distribution
Property Type Distribution
Market Composition Insights for Vilallonga de Ter
- The Vilallonga de Ter Airbnb market composition is heavily skewed towards Entire Home/Apt listings, which make up 100% of the 18 active rentals. This indicates strong guest preference for privacy and space.
- Looking at the property type distribution in Vilallonga de Ter, Apartment/Condo properties are the most common (50%), reflecting the local real estate landscape.
- Houses represent a significant 44.4% portion, catering likely to families or larger groups.
Vilallonga de Ter Airbnb Room Capacity Analysis (2026): Bedroom Distribution
Distribution of Listings by Number of Bedrooms
Room Capacity Insights for Vilallonga de Ter
- The dominant room capacity in Vilallonga de Ter is 1 bedroom listings, making up 38.9% of the market. This suggests a strong demand for properties suitable for couples or solo travelers.
- Together, 1 bedroom and 2 bedrooms properties represent 72.2% of the active Airbnb listings in Vilallonga de Ter, indicating a high concentration in these sizes.
- A significant 27.8% of listings offer 3+ bedrooms, catering to larger groups and families seeking more space in Vilallonga de Ter.
Vilallonga de Ter Vacation Rental Guest Capacity Trends (2026)
Distribution of Listings by Guest Capacity
Guest Capacity Insights for Vilallonga de Ter
- The most common guest capacity trend in Vilallonga de Ter vacation rentals is listings accommodating 2 guests (33.3%). This suggests the primary traveler segment is likely couples or solo travelers.
- Properties designed for 2 guests and 4 guests dominate the Vilallonga de Ter STR market, accounting for 55.5% of listings.
- 33.4% of properties accommodate 6+ guests, serving the market segment for larger families or group travel in Vilallonga de Ter.
- On average, properties in Vilallonga de Ter are equipped to host 4.4 guests.
Vilallonga de Ter Airbnb Booking Patterns (2026): Available vs. Booked Days
Available Days Distribution
Booked Days Distribution
Booking Pattern Insights for Vilallonga de Ter
- The most common availability pattern in Vilallonga de Ter falls within the 271-366 days range, representing 66.7% of listings. This suggests many properties have significant open periods on their calendars.
- Approximately 88.9% of listings show high availability (181+ days open annually), indicating potential for increased bookings or specific owner usage patterns.
- For booked days, the 31-90 days range is most frequent in Vilallonga de Ter (50%), reflecting common guest stay durations or potential owner blocking patterns.
- A notable 11.1% of properties secure long booking periods (181+ days booked per year), highlighting successful long-term rental strategies or significant owner usage.
Vilallonga de Ter Airbnb Minimum Stay Requirements Analysis
Distribution of Listings by Minimum Night Requirement
2 Nights
8 listings
44.4% of total
4-6 Nights
1 listings
5.6% of total
30+ Nights
9 listings
50% of total
Key Insights
- The most prevalent minimum stay requirement in Vilallonga de Ter is 30+ Nights, adopted by 50% of listings. This highlights the market's preference for longer commitments.
- A significant segment (50%) caters to monthly stays (30+ nights) in Vilallonga de Ter, pointing to opportunities in the extended-stay market.
Recommendations
- Align with the market by considering a 30+ Nights minimum stay, as 50% of Vilallonga de Ter hosts use this setting.
- A 2-night minimum appears standard (44.4%). Consider this for weekends or peak periods.
- Explore offering discounts for stays of 30+ nights to attract the 50% of the market seeking extended stays.
- Adjust minimum nights based on seasonality – potentially shorter during low season and longer during peak demand periods in Vilallonga de Ter.
Vilallonga de Ter Airbnb Cancellation Policy Trends Analysis (2026)
Moderate
9 listings
50% of total
Firm
9 listings
50% of total
Cancellation Policy Insights for Vilallonga de Ter
- The prevailing Airbnb cancellation policy trend in Vilallonga de Ter is Moderate, used by 50% of listings.
- There's a relatively balanced mix between guest-friendly (50.0%) and stricter (50.0%) policies, offering choices for different guest needs.
Recommendations for Hosts
- Consider adopting a Moderate policy to align with the 50% market standard in Vilallonga de Ter.
- Regularly review your cancellation policy against competitors and market demand shifts in Vilallonga de Ter.
Vilallonga de Ter STR Booking Lead Time Analysis (2026)
Average Booking Lead Time by Month
Booking Lead Time Insights for Vilallonga de Ter
- The overall average booking lead time for vacation rentals in Vilallonga de Ter is 67 days.
- Guests book furthest in advance for stays during August (average 90 days), likely coinciding with peak travel demand or local events.
- The shortest booking windows occur for stays in March (average 25 days), indicating more last-minute travel plans during this time.
- Seasonally, Summer (70 days avg.) sees the longest lead times, while Spring (39 days avg.) has the shortest, reflecting typical travel planning cycles.
Recommendations for Hosts
- Use the overall average lead time (67 days) as a baseline for your pricing and availability strategy in Vilallonga de Ter.
- For August stays, consider implementing length-of-stay discounts or slightly higher rates for bookings made less than 90 days out to capitalize on advance planning.
- Target marketing efforts for the Summer season well in advance (at least 70 days) to capture early planners.
- Monitor your own booking lead times against these Vilallonga de Ter averages to identify opportunities for dynamic pricing adjustments.
Popular & Essential Airbnb Amenities in Vilallonga de Ter (2026)
Amenity Prevalence
Amenity Insights for Vilallonga de Ter
- Essential amenities in Vilallonga de Ter that guests expect include: TV, Cooking basics, Heating, Dishes and silverware. Lacking these (any) could significantly impact bookings.
- Popular amenities like Refrigerator, Kitchen, Hair dryer are common but not universal. Offering these can provide a competitive edge.
Recommendations for Hosts
- Ensure your listing includes all essential amenities for Vilallonga de Ter: TV, Cooking basics, Heating, Dishes and silverware.
- Consider adding popular differentiators like Refrigerator or Kitchen to increase appeal.
- Highlight unique or less common amenities you offer (e.g., hot tub, dedicated workspace, EV charger) in your listing description and photos.
- Regularly check competitor amenities in Vilallonga de Ter to stay competitive.
Vilallonga de Ter Airbnb Guest Demographics & Profile Analysis (2026)
Guest Profile Summary for Vilallonga de Ter
- The typical guest profile for Airbnb in Vilallonga de Ter consists of a mix of domestic (58%) and international guests, often arriving from nearby Barcelona, typically belonging to the Post-2000s (Gen Z/Alpha) group (50%), primarily speaking English or Spanish.
- Domestic travelers account for 57.7% of guests.
- Key international markets include Spain (57.7%) and United Kingdom (17.3%).
- Top languages spoken are English (30.1%) followed by Spanish (28.8%).
- A significant demographic segment is the Post-2000s (Gen Z/Alpha) group, representing 50% of guests.
Recommendations for Hosts
- Balance marketing efforts between domestic and international channels based on the guest mix.
- Tailor amenities and listing descriptions to appeal to the dominant Post-2000s (Gen Z/Alpha) demographic (e.g., highlight fast WiFi, smart home features, local guides).
- Highlight unique local experiences or amenities relevant to the primary guest profile.
- Consider seasonal promotions aligned with peak travel times for key origin markets.
Nearby Short-Term Rental Market Comparison
How does the Vilallonga de Ter Airbnb market stack up against its neighbors? Compare key performance metrics like average monthly revenue, ADR, and occupancy rates in surrounding areas to understand the broader regional STR landscape.
| Market | Active Properties | Monthly Revenue | Daily Rate | Avg. Occupancy |
|---|---|---|---|---|
| Vall-llobrega | 18 | $10,253 | $778.88 | 45% |
| Canyelles | 47 | $7,127 | $1152.36 | 35% |
| Cornellà del Terri | 15 | $6,458 | $584.61 | 40% |
| Vallirana | 10 | $5,639 | $350.46 | 57% |
| Tiana | 15 | $5,135 | $362.37 | 45% |
| Sant Vicenç de Montalt | 40 | $5,005 | $422.72 | 39% |
| Amer | 11 | $4,949 | $462.57 | 38% |
| Sant Andreu de Llavaneres | 45 | $4,931 | $450.05 | 41% |
| Teià | 25 | $4,821 | $394.46 | 40% |
| Premià de Dalt | 31 | $4,548 | $337.99 | 47% |