Àger Airbnb Market Analysis 2026: Short Term Rental Data & Vacation Rental Statistics in Catalonia, Spain
Is Airbnb profitable in Àger in 2026? Explore comprehensive Airbnb analytics for Àger, Catalonia, Spain to uncover income potential. This 2026 STR market report for Àger, based on AirROI data from February 2025 to January 2026, reveals key trends in the niche market of 21 active listings.
Whether you're considering an Airbnb investment in Àger, optimizing your existing vacation rental, or exploring rental arbitrage opportunities, understanding the Àger Airbnb data is crucial. Navigating the high regulation landscape is key to maximizing your short term rental income potential. Let's dive into the specifics.
Key Àger Airbnb Performance Metrics Overview
Monthly Airbnb Revenue Variations & Income Potential in Àger (2026)
Understanding the monthly revenue variations for Airbnb listings in Àger is key to maximizing your short term rental income potential. Seasonality significantly impacts earnings. Our analysis, based on data from the past 12 months, shows that the peak revenue month for STRs in Àger is typically August, while February often presents the lowest earnings, highlighting opportunities for strategic pricing adjustments during shoulder and low seasons. Explore the typical Airbnb income in Àger across different performance tiers:
- Best-in-class properties (Top 10%) achieve $2,867+ monthly, often utilizing dynamic pricing and superior guest experiences.
- Strong performing properties (Top 25%) earn $2,131 or more, indicating effective management and desirable locations/amenities.
- Typical properties (Median) generate around $923 per month, representing the average market performance.
- Entry-level properties (Bottom 25%) see earnings around $582, often with potential for optimization.
Average Monthly Airbnb Earnings Trend in Àger
Àger Airbnb Occupancy Rate Trends (2026)
Maximize your bookings by understanding the Àger STR occupancy trends. Seasonal demand shifts significantly influence how often properties are booked. Typically, Marchsees the highest demand (peak season occupancy), while January experiences the lowest (low season). Effective strategies, like adjusting minimum stays or offering promotions, can boost occupancy during slower periods. Here's how different property tiers perform in Àger:
- Best-in-class properties (Top 10%) achieve 66%+ occupancy, indicating high desirability and potentially optimized availability.
- Strong performing properties (Top 25%) maintain 50% or higher occupancy, suggesting good market fit and guest satisfaction.
- Typical properties (Median) have an occupancy rate around 25%.
- Entry-level properties (Bottom 25%) average 14% occupancy, potentially facing higher vacancy.
Average Monthly Occupancy Rate Trend in Àger
Average Daily Rate (ADR) Airbnb Trends in Àger (2026)
Effective short term rental pricing strategy in Àger involves understanding monthly ADR fluctuations. The Average Daily Rate (ADR) for Airbnb in Àger typically peaks in December and dips lowest during February. Leveraging Airbnb dynamic pricing tools or strategies based on this seasonality can significantly boost revenue. Here's a look at the typical nightly rates achieved:
- Best-in-class properties (Top 10%) command rates of $216+ per night, often due to premium features or locations.
- Strong performing properties (Top 25%) achieve nightly rates of $162 or more.
- Typical properties (Median) charge around $114 per night.
- Entry-level properties (Bottom 25%) earn around $103 per night.
Average Daily Rate (ADR) Trend by Month in Àger
Get Live Àger Market Intelligence 👇
Explore Real-time Analytics
Airbnb Seasonality Analysis & Trends in Àger (2026)
Peak Season (August, May, April)
- Revenue averages $1,955 per month
- Occupancy rates average 44.7%
- Daily rates average $140
Shoulder Season
- Revenue averages $1,409 per month
- Occupancy maintains around 32.7%
- Daily rates hold near $142
Low Season (January, February, June)
- Revenue drops to average $893 per month
- Occupancy decreases to average 22.8%
- Daily rates adjust to average $140
Seasonality Insights for Àger
- The Airbnb seasonality in Àger shows highly seasonal trends requiring careful strategy. While the sections above show seasonal averages, it's also insightful to look at the extremes:
- During the high season, the absolute peak month showcases Àger's highest earning potential, with monthly revenues capable of climbing to $2,202, occupancy reaching a high of 45.7%, and ADRs peaking at $148.
- Conversely, the slowest single month of the year, typically falling within the low season, marks the market's lowest point. In this month, revenue might dip to $805, occupancy could drop to 17.0%, and ADRs may adjust down to $133.
- Understanding both the seasonal averages and these monthly peaks and troughs in revenue, occupancy, and ADR is crucial for maximizing your Airbnb profit potential in Àger.
Seasonal Strategies for Maximizing Profit
- Peak Season: Maximize revenue through premium pricing and potentially longer minimum stays. Ensure high availability.
- Low Season: Offer competitive pricing, special promotions (e.g., extended stay discounts), and flexible cancellation policies. Target off-season travelers like remote workers or budget-conscious guests.
- Shoulder Seasons: Implement dynamic pricing that balances peak and low rates. Target weekend travelers or specific events. Offer slightly more flexible terms than peak season.
- Regularly analyze your own performance against these Àger seasonality benchmarks and adjust your pricing and availability strategy accordingly.
Best Areas for Airbnb Investment in Àger (2026)
Exploring the top neighborhoods for short-term rentals in Àger? This section highlights key areas, outlining why they are attractive for hosts and guests, along with notable local attractions. Consider these locations based on your target guest profile and investment strategy.
| Neighborhood / Area | Why Host Here? (Target Guests & Appeal) | Key Attractions & Landmarks |
|---|---|---|
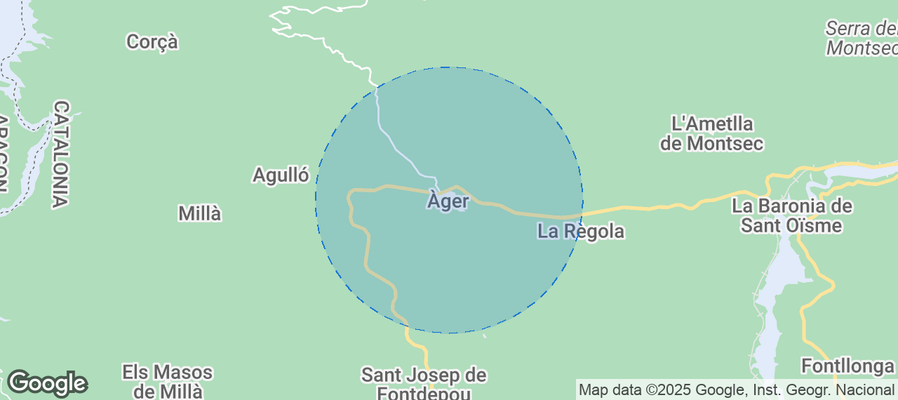
| Àger Valley | A picturesque valley surrounded by stunning mountain views, ideal for nature lovers and outdoor enthusiasts. It offers a peaceful atmosphere and is great for hiking and exploring the Catalan countryside. | Montsec Mountain Range, Camí de Sirga, Sant Pere d'Àger Monastery, Kayaking in the Noguera Ribagorçana river, Starry Sky Observations |
| Àger Town | A charming small town that provides a local Catalan experience with historical architecture and a cozy ambiance. Perfect for travelers looking to immerse themselves in the culture. | Church of Santa Maria, Àger Castle, Local restaurants and tapas bars, Cultural events and festivals, Artisan shops |
| Montsec Astronomical Observatory | This area is renowned for its clear skies, making it ideal for astrotourism and stargazing. It's a unique attraction that draws scientific enthusiasts and families alike. | Montsec Astronomical Observatory, Stargazing events, Educational workshops, Scenic lookout points, Nature trails |
| Noguera River | The Noguera River offers opportunities for adventure sports such as kayaking and rafting, appealing to thrill-seekers looking for an active vacation. | Kayaking and rafting tours, Fishing spots, Picnic areas, Trout fishing, Nature trails alongside the river |
| La Puda | A serene village famous for its natural hot springs, attracting those looking for relaxation and wellness retreats. Ideal for wellness-focused travelers. | Thermal baths, Wellness centers, Hiking trails, Natural scenery, Calm environment |
| Les Avellanes | Known for its tranquil rural environment and agricultural beauty, perfect for tourists looking for relaxation and a break from the city. | Rural landscapes, Local farms, Hiking trails, Picnic spots, Cultural heritage trails |
| Castell de Mur | An ancient castle offering panoramic views and historical significance. Attracts history buffs and tourists interested in medieval architecture. | Castell de Mur ruins, Historical markers, Photography spots, Guided tours, Cultural events |
| Canyon of the Noguera | A breathtaking canyon ideal for rock climbing and exploring, popular with adventure tourists and nature lovers. | Rock climbing spots, Canyon trail hikes, Scenic views, Wildlife watching, Photography opportunities |
Understanding Airbnb License Requirements & STR Laws in Àger (2026)
Yes, Àger, Catalonia, Spain enforces high STR regulations. Obtaining a license and ensuring compliance is almost certainly required according to current 2026 STR laws. Always verify the latest short term rental regulations and Airbnb license requirements directly with local government authorities for Àger to ensure full compliance before hosting.
(Source: AirROI data, 2026, based on 81% licensed listings)
Top Performing Airbnb Properties in Àger (2026)
Benchmark your potential! Explore examples of top-performing Airbnb properties in Àgerbased on Trailing Twelve Month (TTM) revenue. Analyze their characteristics, revenue, occupancy rate, and ADR to understand what drives success in this market.
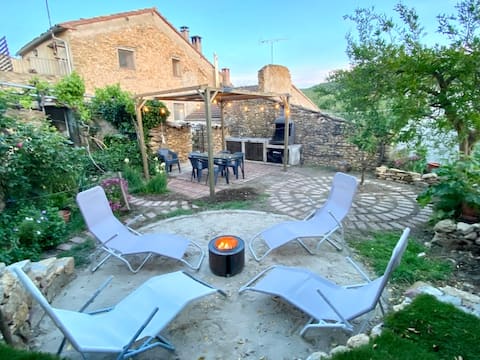
Cozy and family house with garden and barbecue
Entire Place • 3 bedrooms
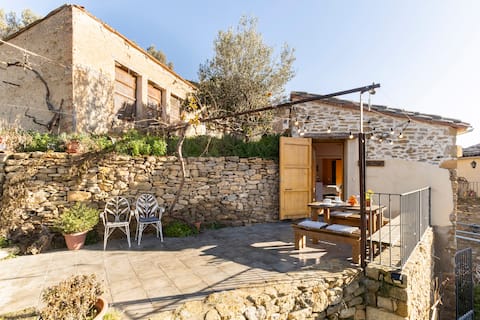
Intimate cabin between the Congost, estrelles and el vol
Entire Place • 1 bedroom
Family space
Private Room • 2 bedrooms

La Pertusa 2nd Apartment
Entire Place • 4 bedrooms

Casa Caminer, Àger Valley village house
Entire Place • 4 bedrooms

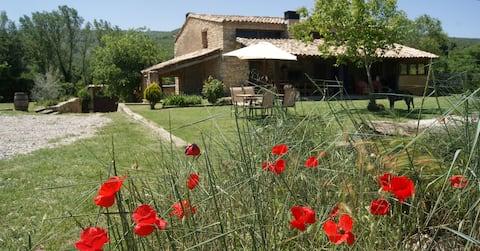
Country house for 4+1 people with a 600 m² garden
Entire Place • 2 bedrooms
Note: Performance varies based on location, size, amenities, seasonality, and management quality. Data reflects the past 12 months.
Top Performing Airbnb Hosts in Àger (2026)
Learn from the best! This table showcases top-performing Airbnb hosts in Àger based on the number of properties managed and estimated total revenue over the past year. Analyze their scale and performance metrics.
| Host Name | Properties | Grossing Revenue | Stay Reviews | Avg Rating |
|---|---|---|---|---|
| Pau | 2 | $59,436 | 121 | 4.88/5.0 |
| Cristina | 6 | $54,775 | 82 | 4.83/5.0 |
| Esther | 3 | $17,309 | 32 | 4.79/5.0 |
| Eva | 1 | $16,572 | 85 | 4.84/5.0 |
| Xavi | 1 | $14,269 | 4 | 5.00/5.0 |
| Joel | 5 | $8,960 | 16 | 4.41/5.0 |
| Rob | 1 | $8,344 | 33 | 4.73/5.0 |
| Javier | 1 | $2,911 | 3 | 5.00/5.0 |
| Miquel Angel I Teresa | 1 | $1,214 | 29 | 4.90/5.0 |
Analyzing the strategies of top hosts, such as their property selection, pricing, and guest communication, can offer valuable lessons for optimizing your own Airbnb operations in Àger.
Dive Deeper: Advanced Àger STR Market Data (2026)
Ready to unlock more insights? AirROI provides access to advanced metrics and comprehensive Airbnb data for Àger. Explore detailed analytics beyond this report to refine your investment strategy, optimize pricing, and maximize your vacation rental profits.
Explore Advanced MetricsÀger Short-Term Rental Market Composition (2026): Property & Room Types
Room Type Distribution
Property Type Distribution
Market Composition Insights for Àger
- The Àger Airbnb market composition is heavily skewed towards Entire Home/Apt listings, which make up 52.4% of the 21 active rentals. This indicates strong guest preference for privacy and space.
- However, a notable 47.6% share for Private Rooms suggests opportunities for budget-conscious travelers or hosts renting out spare rooms.
- Looking at the property type distribution in Àger, House properties are the most common (42.9%), reflecting the local real estate landscape.
- Houses represent a significant 42.9% portion, catering likely to families or larger groups.
- The presence of 28.6% Hotel/Boutique listings indicates integration with traditional hospitality.
- Smaller segments like others, outdoor/unique (combined 9.6%) offer potential for unique stay experiences.
Àger Airbnb Room Capacity Analysis (2026): Bedroom Distribution
Distribution of Listings by Number of Bedrooms
Room Capacity Insights for Àger
- The dominant room capacity in Àger is 1 bedroom listings, making up 42.9% of the market. This suggests a strong demand for properties suitable for couples or solo travelers.
- Together, 1 bedroom and 2 bedrooms properties represent 71.5% of the active Airbnb listings in Àger, indicating a high concentration in these sizes.
Àger Vacation Rental Guest Capacity Trends (2026)
Distribution of Listings by Guest Capacity
Guest Capacity Insights for Àger
- The most common guest capacity trend in Àger vacation rentals is listings accommodating 6 guests (28.6%). This suggests the primary traveler segment is likely larger groups.
- Properties designed for 6 guests and 8+ guests dominate the Àger STR market, accounting for 47.6% of listings.
- 52.4% of properties accommodate 6+ guests, serving the market segment for larger families or group travel in Àger.
- On average, properties in Àger are equipped to host 4.9 guests.
Àger Airbnb Booking Patterns (2026): Available vs. Booked Days
Available Days Distribution
Booked Days Distribution
Booking Pattern Insights for Àger
- The most common availability pattern in Àger falls within the 271-366 days range, representing 71.4% of listings. This suggests many properties have significant open periods on their calendars.
- Approximately 90.4% of listings show high availability (181+ days open annually), indicating potential for increased bookings or specific owner usage patterns.
- For booked days, the 1-30 days range is most frequent in Àger (47.6%), reflecting common guest stay durations or potential owner blocking patterns.
- A notable 9.5% of properties secure long booking periods (181+ days booked per year), highlighting successful long-term rental strategies or significant owner usage.
Àger Airbnb Minimum Stay Requirements Analysis
Distribution of Listings by Minimum Night Requirement
1 Night
5 listings
23.8% of total
2 Nights
12 listings
57.1% of total
3 Nights
1 listings
4.8% of total
30+ Nights
3 listings
14.3% of total
Key Insights
- The most prevalent minimum stay requirement in Àger is 2 Nights, adopted by 57.1% of listings. This highlights the market's preference for shorter, flexible bookings.
- A strong majority (80.9%) of the Àger Airbnb data shows acceptance of very short stays (1-2 nights), indicating a dynamic, high-turnover market.
- A significant segment (14.3%) caters to monthly stays (30+ nights) in Àger, pointing to opportunities in the extended-stay market.
Recommendations
- Align with the market by considering a 2 Nights minimum stay, as 57.1% of Àger hosts use this setting.
- If feasible, allowing 1-night stays, especially midweek or during low season, could capture last-minute bookings, as only 23.8% currently do.
- Explore offering discounts for stays of 30+ nights to attract the 14.3% of the market seeking extended stays.
- Adjust minimum nights based on seasonality – potentially shorter during low season and longer during peak demand periods in Àger.
Àger Airbnb Cancellation Policy Trends Analysis (2026)
Limited
1 listings
4.8% of total
Flexible
6 listings
28.6% of total
Moderate
5 listings
23.8% of total
Firm
9 listings
42.9% of total
Cancellation Policy Insights for Àger
- The prevailing Airbnb cancellation policy trend in Àger is Firm, used by 42.9% of listings.
- There's a relatively balanced mix between guest-friendly (52.4%) and stricter (42.9%) policies, offering choices for different guest needs.
Recommendations for Hosts
- Consider adopting a Firm policy to align with the 42.9% market standard in Àger.
- Regularly review your cancellation policy against competitors and market demand shifts in Àger.
Àger STR Booking Lead Time Analysis (2026)
Average Booking Lead Time by Month
Booking Lead Time Insights for Àger
- The overall average booking lead time for vacation rentals in Àger is 58 days.
- Guests book furthest in advance for stays during May (average 120 days), likely coinciding with peak travel demand or local events.
- The shortest booking windows occur for stays in June (average 13 days), indicating more last-minute travel plans during this time.
- Seasonally, Fall (73 days avg.) sees the longest lead times, while Winter (37 days avg.) has the shortest, reflecting typical travel planning cycles.
Recommendations for Hosts
- Use the overall average lead time (58 days) as a baseline for your pricing and availability strategy in Àger.
- For May stays, consider implementing length-of-stay discounts or slightly higher rates for bookings made less than 120 days out to capitalize on advance planning.
- During June, focus on last-minute booking availability and promotions, as guests book with very short notice (13 days avg.).
- Target marketing efforts for the Fall season well in advance (at least 73 days) to capture early planners.
- Monitor your own booking lead times against these Àger averages to identify opportunities for dynamic pricing adjustments.
Popular & Essential Airbnb Amenities in Àger (2026)
Amenity Prevalence
Amenity Insights for Àger
- Essential amenities in Àger that guests expect include: Hot water, Bed linens, Wifi. Lacking these (any) could significantly impact bookings.
- Popular amenities like Heating, Essentials, Hangers are common but not universal. Offering these can provide a competitive edge.
Recommendations for Hosts
- Ensure your listing includes all essential amenities for Àger: Hot water, Bed linens, Wifi.
- Prioritize adding missing essentials: Bed linens, Wifi.
- Consider adding popular differentiators like Heating or Essentials to increase appeal.
- Highlight unique or less common amenities you offer (e.g., hot tub, dedicated workspace, EV charger) in your listing description and photos.
- Regularly check competitor amenities in Àger to stay competitive.
Àger Airbnb Guest Demographics & Profile Analysis (2026)
Guest Profile Summary for Àger
- The typical guest profile for Airbnb in Àger consists of a mix of domestic (49%) and international guests, with top international origins including France, typically belonging to the Post-2000s (Gen Z/Alpha) group (50%), primarily speaking Spanish or English.
- Domestic travelers account for 48.9% of guests.
- Key international markets include Spain (48.9%) and France (22.2%).
- Top languages spoken are Spanish (32.7%) followed by English (30.9%).
- A significant demographic segment is the Post-2000s (Gen Z/Alpha) group, representing 50% of guests.
Recommendations for Hosts
- Balance marketing efforts between domestic and international channels based on the guest mix.
- Tailor amenities and listing descriptions to appeal to the dominant Post-2000s (Gen Z/Alpha) demographic (e.g., highlight fast WiFi, smart home features, local guides).
- Highlight unique local experiences or amenities relevant to the primary guest profile.
- Consider seasonal promotions aligned with peak travel times for key origin markets.
Nearby Short-Term Rental Market Comparison
How does the Àger Airbnb market stack up against its neighbors? Compare key performance metrics like average monthly revenue, ADR, and occupancy rates in surrounding areas to understand the broader regional STR landscape.
| Market | Active Properties | Monthly Revenue | Daily Rate | Avg. Occupancy |
|---|---|---|---|---|
| Canyelles | 47 | $7,127 | $1152.36 | 35% |
| Vallirana | 10 | $5,639 | $350.46 | 57% |
| la Baronia de Rialb | 16 | $4,527 | $436.71 | 45% |
| la Llacuna | 10 | $4,238 | $584.45 | 24% |
| Aiguamúrcia | 15 | $3,747 | $310.17 | 46% |
| Alcover | 13 | $3,676 | $697.99 | 27% |
| Olivella | 97 | $3,471 | $456.77 | 41% |
| Subirats | 22 | $3,158 | $335.56 | 38% |
| Corbera de Llobregat | 15 | $2,950 | $379.06 | 46% |
| Olèrdola | 14 | $2,908 | $668.38 | 32% |