Cee Airbnb Market Analysis 2026: Short Term Rental Data & Vacation Rental Statistics in Galicia, Spain
Is Airbnb profitable in Cee in 2026? Explore comprehensive Airbnb analytics for Cee, Galicia, Spain to uncover income potential. This 2026 STR market report for Cee, based on AirROI data from February 2025 to January 2026, reveals key trends in the niche market of 59 active listings.
Whether you're considering an Airbnb investment in Cee, optimizing your existing vacation rental, or exploring rental arbitrage opportunities, understanding the Cee Airbnb data is crucial. Navigating the high regulation landscape is key to maximizing your short term rental income potential. Let's dive into the specifics.
Key Cee Airbnb Performance Metrics Overview
Monthly Airbnb Revenue Variations & Income Potential in Cee (2026)
Understanding the monthly revenue variations for Airbnb listings in Cee is key to maximizing your short term rental income potential. Seasonality significantly impacts earnings. Our analysis, based on data from the past 12 months, shows that the peak revenue month for STRs in Cee is typically August, while January often presents the lowest earnings, highlighting opportunities for strategic pricing adjustments during shoulder and low seasons. Explore the typical Airbnb income in Cee across different performance tiers:
- Best-in-class properties (Top 10%) achieve $2,088+ monthly, often utilizing dynamic pricing and superior guest experiences.
- Strong performing properties (Top 25%) earn $1,407 or more, indicating effective management and desirable locations/amenities.
- Typical properties (Median) generate around $826 per month, representing the average market performance.
- Entry-level properties (Bottom 25%) see earnings around $441, often with potential for optimization.
Average Monthly Airbnb Earnings Trend in Cee
Cee Airbnb Occupancy Rate Trends (2026)
Maximize your bookings by understanding the Cee STR occupancy trends. Seasonal demand shifts significantly influence how often properties are booked. Typically, Augustsees the highest demand (peak season occupancy), while January experiences the lowest (low season). Effective strategies, like adjusting minimum stays or offering promotions, can boost occupancy during slower periods. Here's how different property tiers perform in Cee:
- Best-in-class properties (Top 10%) achieve 70%+ occupancy, indicating high desirability and potentially optimized availability.
- Strong performing properties (Top 25%) maintain 49% or higher occupancy, suggesting good market fit and guest satisfaction.
- Typical properties (Median) have an occupancy rate around 28%.
- Entry-level properties (Bottom 25%) average 12% occupancy, potentially facing higher vacancy.
Average Monthly Occupancy Rate Trend in Cee
Average Daily Rate (ADR) Airbnb Trends in Cee (2026)
Effective short term rental pricing strategy in Cee involves understanding monthly ADR fluctuations. The Average Daily Rate (ADR) for Airbnb in Cee typically peaks in August and dips lowest during April. Leveraging Airbnb dynamic pricing tools or strategies based on this seasonality can significantly boost revenue. Here's a look at the typical nightly rates achieved:
- Best-in-class properties (Top 10%) command rates of $176+ per night, often due to premium features or locations.
- Strong performing properties (Top 25%) achieve nightly rates of $139 or more.
- Typical properties (Median) charge around $105 per night.
- Entry-level properties (Bottom 25%) earn around $83 per night.
Average Daily Rate (ADR) Trend by Month in Cee
Get Live Cee Market Intelligence 👇

Explore Real-time Analytics
Airbnb Seasonality Analysis & Trends in Cee (2026)
Peak Season (August, July, September)
- Revenue averages $1,784 per month
- Occupancy rates average 45.2%
- Daily rates average $127
Shoulder Season
- Revenue averages $836 per month
- Occupancy maintains around 31.4%
- Daily rates hold near $112
Low Season (January, February, November)
- Revenue drops to average $601 per month
- Occupancy decreases to average 25.4%
- Daily rates adjust to average $112
Seasonality Insights for Cee
- The Airbnb seasonality in Cee shows highly seasonal trends requiring careful strategy. While the sections above show seasonal averages, it's also insightful to look at the extremes:
- During the high season, the absolute peak month showcases Cee's highest earning potential, with monthly revenues capable of climbing to $2,555, occupancy reaching a high of 58.9%, and ADRs peaking at $132.
- Conversely, the slowest single month of the year, typically falling within the low season, marks the market's lowest point. In this month, revenue might dip to $558, occupancy could drop to 21.7%, and ADRs may adjust down to $108.
- Understanding both the seasonal averages and these monthly peaks and troughs in revenue, occupancy, and ADR is crucial for maximizing your Airbnb profit potential in Cee.
Seasonal Strategies for Maximizing Profit
- Peak Season: Maximize revenue through premium pricing and potentially longer minimum stays. Ensure high availability.
- Low Season: Offer competitive pricing, special promotions (e.g., extended stay discounts), and flexible cancellation policies. Target off-season travelers like remote workers or budget-conscious guests.
- Shoulder Seasons: Implement dynamic pricing that balances peak and low rates. Target weekend travelers or specific events. Offer slightly more flexible terms than peak season.
- Regularly analyze your own performance against these Cee seasonality benchmarks and adjust your pricing and availability strategy accordingly.
Best Areas for Airbnb Investment in Cee (2026)
Exploring the top neighborhoods for short-term rentals in Cee? This section highlights key areas, outlining why they are attractive for hosts and guests, along with notable local attractions. Consider these locations based on your target guest profile and investment strategy.
| Neighborhood / Area | Why Host Here? (Target Guests & Appeal) | Key Attractions & Landmarks |
|---|---|---|
| Santiago de Compostela | Historic and cultural capital of Galicia, famous for its pilgrimage routes and rich history. A prime destination for tourists visiting the cathedral and exploring the old town. | Santiago de Compostela Cathedral, Parque de la Alameda, Museum of the Galician People, Casa do Cabildo, Mercado de Abastos |
| A Coruña | A vibrant port city known for its beautiful beaches and rich maritime history. Ideal for visitors seeking a mix of city life and coastal attractions. | Torre de Hércules, Orzán Beach, Museo de Bellas Artes, Kiosko Alfonso, Ría de A Coruña |
| Vigo | Largest city in Galicia, with a lively cultural scene and beautiful coastal views. Attracts both business and leisure travelers looking for urban experiences. | Islas Cíes, Puerta del Sol, Parque de Castro, Museo Quiñones de León, Marina de Vigo |
| Lugo | Known for its well-preserved Roman walls and rich history. A great location for travelers interested in history and heritage tourism. | Roman Walls of Lugo, Cathedral of Santa Maria, Parque de la Milagrosa, Museo Provincial, Plaza Mayor |
| Pontevedra | A charming city with a historic old town and a relaxed atmosphere. Ideal for visitors looking for culture and gastronomy. | Pontevedra Old Town, Museo Provincial de Pontevedra, Ría de Pontevedra, Praza de la Verdura, Calle de las Flores |
| Rías Baixas | Known for its stunning coastal landscapes and delicious seafood. Popular with tourists seeking beach vacations and wine tours. | Combarro, Sanxenxo, Portonovo, Ilas Ons, Adegas del Albariño |
| Finisterre | Famous for its dramatic cliffs and views of the Atlantic Ocean. A key stop for the Camino de Santiago and outdoor enthusiasts. | Cape Finisterre, Fisterra Lighthouse, Beaches of Finisterre, Camino de Santiago, Cabo de la Nave |
| O Grove | A popular tourist destination known for its beaches and seafood. Attracts families and food lovers, especially during the summer. | La Toja Island, A Lanzada Beach, Port of O Grove, Museo da Salgadura, Festa do Marisco |
Understanding Airbnb License Requirements & STR Laws in Cee (2026)
Yes, Cee, Galicia, Spain enforces high STR regulations. Obtaining a license and ensuring compliance is almost certainly required according to current 2026 STR laws. Always verify the latest short term rental regulations and Airbnb license requirements directly with local government authorities for Cee to ensure full compliance before hosting.
(Source: AirROI data, 2026, based on 69% licensed listings)
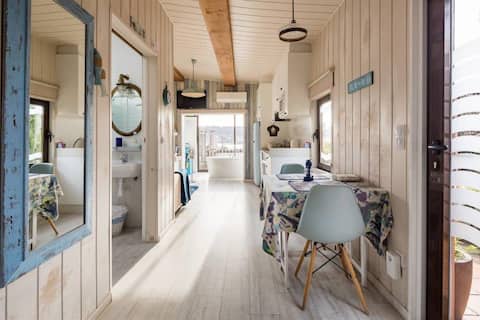
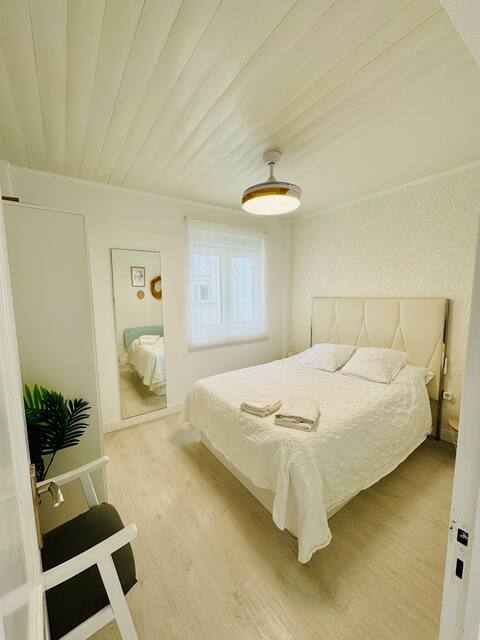
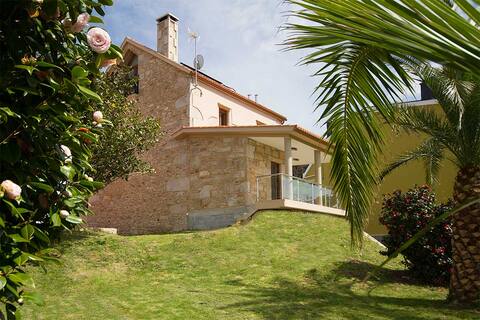
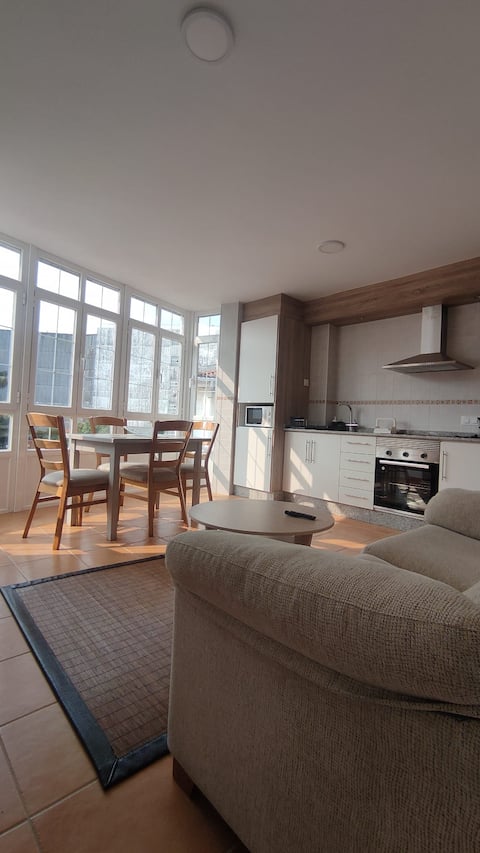
Top Performing Airbnb Properties in Cee (2026)
Benchmark your potential! Explore examples of top-performing Airbnb properties in Ceebased on Trailing Twelve Month (TTM) revenue. Analyze their characteristics, revenue, occupancy rate, and ADR to understand what drives success in this market.
Mar no Camiño. Terrace, bathtub with ocean view.
Entire Place • 1 bedroom
Abuela Maruja - tourist apartment in Cee
Entire Place • 2 bedrooms
Stone house or Carballal
Entire Place • 4 bedrooms
Villa Junquera 2
Entire Place • 2 bedrooms

Apartamento Nosa Terra by ALÔGA
Entire Place • 2 bedrooms

Enjoy the pool and beach on "Costa da Morte"
Entire Place • 1 bedroom
Note: Performance varies based on location, size, amenities, seasonality, and management quality. Data reflects the past 12 months.
Top Performing Airbnb Hosts in Cee (2026)
Learn from the best! This table showcases top-performing Airbnb hosts in Cee based on the number of properties managed and estimated total revenue over the past year. Analyze their scale and performance metrics.
| Host Name | Properties | Grossing Revenue | Stay Reviews | Avg Rating |
|---|---|---|---|---|
| Alôga | 8 | $72,388 | 25 | 4.52/5.0 |
| Hugo | 2 | $31,246 | 136 | 4.82/5.0 |
| Mar No Camiño | 1 | $27,653 | 85 | 4.96/5.0 |
| Iri | 1 | $21,938 | 40 | 4.45/5.0 |
| Maria Carmen | 1 | $18,413 | 2 | Not Rated |
| David | 1 | $14,492 | 79 | 4.92/5.0 |
| Jesus Humberto | 2 | $14,367 | 27 | 4.86/5.0 |
| Maria Del Carmen | 1 | $13,472 | 25 | 4.92/5.0 |
| Vicente Bernardo | 2 | $12,779 | 47 | 4.68/5.0 |
| Fabi | 1 | $12,559 | 23 | 4.65/5.0 |
Analyzing the strategies of top hosts, such as their property selection, pricing, and guest communication, can offer valuable lessons for optimizing your own Airbnb operations in Cee.
Dive Deeper: Advanced Cee STR Market Data (2026)
Ready to unlock more insights? AirROI provides access to advanced metrics and comprehensive Airbnb data for Cee. Explore detailed analytics beyond this report to refine your investment strategy, optimize pricing, and maximize your vacation rental profits.
Explore Advanced MetricsCee Short-Term Rental Market Composition (2026): Property & Room Types
Room Type Distribution
Property Type Distribution
Market Composition Insights for Cee
- The Cee Airbnb market composition is heavily skewed towards Entire Home/Apt listings, which make up 98.3% of the 59 active rentals. This indicates strong guest preference for privacy and space.
- Looking at the property type distribution in Cee, Apartment/Condo properties are the most common (74.6%), reflecting the local real estate landscape.
- Houses represent a significant 23.7% portion, catering likely to families or larger groups.
- Smaller segments like outdoor/unique (combined 1.7%) offer potential for unique stay experiences.
Cee Airbnb Room Capacity Analysis (2026): Bedroom Distribution
Distribution of Listings by Number of Bedrooms
Room Capacity Insights for Cee
- The dominant room capacity in Cee is 3 bedrooms listings, making up 32.2% of the market. This suggests a strong demand for properties suitable for families or small groups.
- Together, 3 bedrooms and 2 bedrooms properties represent 64.4% of the active Airbnb listings in Cee, indicating a high concentration in these sizes.
- A significant 49.1% of listings offer 3+ bedrooms, catering to larger groups and families seeking more space in Cee.
Cee Vacation Rental Guest Capacity Trends (2026)
Distribution of Listings by Guest Capacity
Guest Capacity Insights for Cee
- The most common guest capacity trend in Cee vacation rentals is listings accommodating 4 guests (33.9%). This suggests the primary traveler segment is likely small families or groups.
- Properties designed for 4 guests and 6 guests dominate the Cee STR market, accounting for 61.0% of listings.
- 42.4% of properties accommodate 6+ guests, serving the market segment for larger families or group travel in Cee.
- On average, properties in Cee are equipped to host 5.0 guests.
Cee Airbnb Booking Patterns (2026): Available vs. Booked Days
Available Days Distribution
Booked Days Distribution
Booking Pattern Insights for Cee
- The most common availability pattern in Cee falls within the 271-366 days range, representing 81.4% of listings. This suggests many properties have significant open periods on their calendars.
- Approximately 93.3% of listings show high availability (181+ days open annually), indicating potential for increased bookings or specific owner usage patterns.
- For booked days, the 1-30 days range is most frequent in Cee (40.7%), reflecting common guest stay durations or potential owner blocking patterns.
- A notable 8.5% of properties secure long booking periods (181+ days booked per year), highlighting successful long-term rental strategies or significant owner usage.
Cee Airbnb Minimum Stay Requirements Analysis
Distribution of Listings by Minimum Night Requirement
1 Night
8 listings
13.6% of total
2 Nights
12 listings
20.3% of total
3 Nights
6 listings
10.2% of total
4-6 Nights
9 listings
15.3% of total
7-29 Nights
1 listings
1.7% of total
30+ Nights
23 listings
39% of total
Key Insights
- The most prevalent minimum stay requirement in Cee is 30+ Nights, adopted by 39% of listings. This highlights the market's preference for longer commitments.
- A significant segment (39%) caters to monthly stays (30+ nights) in Cee, pointing to opportunities in the extended-stay market.
Recommendations
- Align with the market by considering a 30+ Nights minimum stay, as 39% of Cee hosts use this setting.
- If feasible, allowing 1-night stays, especially midweek or during low season, could capture last-minute bookings, as only 13.6% currently do.
- Explore offering discounts for stays of 30+ nights to attract the 39% of the market seeking extended stays.
- Adjust minimum nights based on seasonality – potentially shorter during low season and longer during peak demand periods in Cee.
Cee Airbnb Cancellation Policy Trends Analysis (2026)
Flexible
20 listings
33.9% of total
Moderate
19 listings
32.2% of total
Firm
16 listings
27.1% of total
Strict
4 listings
6.8% of total
Cancellation Policy Insights for Cee
- The prevailing Airbnb cancellation policy trend in Cee is Flexible, used by 33.9% of listings.
- There's a relatively balanced mix between guest-friendly (66.1%) and stricter (33.9%) policies, offering choices for different guest needs.
- Strict cancellation policies are quite rare (6.8%), potentially making listings with this policy less competitive unless justified by high demand or property type.
Recommendations for Hosts
- Consider adopting a Flexible policy to align with the 33.9% market standard in Cee.
- Using a Strict policy might deter some guests, as only 6.8% of listings use it. Evaluate if potential revenue protection outweighs possible lower booking rates.
- Regularly review your cancellation policy against competitors and market demand shifts in Cee.
Cee STR Booking Lead Time Analysis (2026)
Average Booking Lead Time by Month
Booking Lead Time Insights for Cee
- The overall average booking lead time for vacation rentals in Cee is 50 days.
- Guests book furthest in advance for stays during August (average 91 days), likely coinciding with peak travel demand or local events.
- The shortest booking windows occur for stays in February (average 15 days), indicating more last-minute travel plans during this time.
- Seasonally, Summer (59 days avg.) sees the longest lead times, while Spring (33 days avg.) has the shortest, reflecting typical travel planning cycles.
Recommendations for Hosts
- Use the overall average lead time (50 days) as a baseline for your pricing and availability strategy in Cee.
- For August stays, consider implementing length-of-stay discounts or slightly higher rates for bookings made less than 91 days out to capitalize on advance planning.
- Target marketing efforts for the Summer season well in advance (at least 59 days) to capture early planners.
- Monitor your own booking lead times against these Cee averages to identify opportunities for dynamic pricing adjustments.
Popular & Essential Airbnb Amenities in Cee (2026)
Amenity Prevalence
Amenity Insights for Cee
- Essential amenities in Cee that guests expect include: Kitchen. Lacking these (this) could significantly impact bookings.
- Popular amenities like TV, Washer, Hot water are common but not universal. Offering these can provide a competitive edge.
- Warning: Wifi is not universally provided but is considered essential globally. Ensure reliable Wifi is offered.
Recommendations for Hosts
- Ensure your listing includes all essential amenities for Cee: Kitchen.
- Prioritize adding missing essentials: Kitchen.
- Consider adding popular differentiators like TV or Washer to increase appeal.
- Highlight unique or less common amenities you offer (e.g., hot tub, dedicated workspace, EV charger) in your listing description and photos.
- Regularly check competitor amenities in Cee to stay competitive.
Cee Airbnb Guest Demographics & Profile Analysis (2026)
Guest Profile Summary for Cee
- The typical guest profile for Airbnb in Cee consists of primarily domestic travelers (67%), often arriving from nearby Madrid, typically belonging to the Post-2000s (Gen Z/Alpha) group (50%), primarily speaking English or Spanish.
- Domestic travelers account for 67.2% of guests.
- Key international markets include Spain (67.2%) and France (7.2%).
- Top languages spoken are English (34.2%) followed by Spanish (29.1%).
- A significant demographic segment is the Post-2000s (Gen Z/Alpha) group, representing 50% of guests.
Recommendations for Hosts
- Target domestic marketing efforts towards travelers from Madrid and A Coruña.
- Tailor amenities and listing descriptions to appeal to the dominant Post-2000s (Gen Z/Alpha) demographic (e.g., highlight fast WiFi, smart home features, local guides).
- Highlight unique local experiences or amenities relevant to the primary guest profile.
- Consider seasonal promotions aligned with peak travel times for key origin markets.
Nearby Short-Term Rental Market Comparison
How does the Cee Airbnb market stack up against its neighbors? Compare key performance metrics like average monthly revenue, ADR, and occupancy rates in surrounding areas to understand the broader regional STR landscape.
| Market | Active Properties | Monthly Revenue | Daily Rate | Avg. Occupancy |
|---|---|---|---|---|
| Penhalonga e Paços de Gaiolo | 23 | $4,304 | $357.04 | 40% |
| Sande e São Lourenço do Douro | 19 | $3,009 | $319.97 | 37% |
| Alpendorada, Várzea e Torrão | 19 | $2,503 | $264.40 | 35% |
| Vila Boa de Quires e Maureles | 10 | $2,316 | $202.63 | 48% |
| Cinfães | 16 | $2,059 | $253.86 | 28% |
| Barreiros | 10 | $1,928 | $192.32 | 39% |
| Pazos | 10 | $1,928 | $225.59 | 36% |
| Porto | 8,557 | $1,859 | $138.89 | 51% |
| Mera | 13 | $1,843 | $200.22 | 41% |
| Vila Nova de Gaia | 1,164 | $1,841 | $150.15 | 50% |