Pantón Airbnb Market Analysis 2026: Short Term Rental Data & Vacation Rental Statistics in Galicia, Spain
Is Airbnb profitable in Pantón in 2026? Explore comprehensive Airbnb analytics for Pantón, Galicia, Spain to uncover income potential. This 2026 STR market report for Pantón, based on AirROI data from February 2025 to January 2026, reveals key trends in the niche market of 37 active listings.
Whether you're considering an Airbnb investment in Pantón, optimizing your existing vacation rental, or exploring rental arbitrage opportunities, understanding the Pantón Airbnb data is crucial. Navigating the high regulation landscape is key to maximizing your short term rental income potential. Let's dive into the specifics.
Key Pantón Airbnb Performance Metrics Overview
Monthly Airbnb Revenue Variations & Income Potential in Pantón (2026)
Understanding the monthly revenue variations for Airbnb listings in Pantón is key to maximizing your short term rental income potential. Seasonality significantly impacts earnings. Our analysis, based on data from the past 12 months, shows that the peak revenue month for STRs in Pantón is typically August, while January often presents the lowest earnings, highlighting opportunities for strategic pricing adjustments during shoulder and low seasons. Explore the typical Airbnb income in Pantón across different performance tiers:
- Best-in-class properties (Top 10%) achieve $3,297+ monthly, often utilizing dynamic pricing and superior guest experiences.
- Strong performing properties (Top 25%) earn $1,849 or more, indicating effective management and desirable locations/amenities.
- Typical properties (Median) generate around $1,033 per month, representing the average market performance.
- Entry-level properties (Bottom 25%) see earnings around $501, often with potential for optimization.
Average Monthly Airbnb Earnings Trend in Pantón
Pantón Airbnb Occupancy Rate Trends (2026)
Maximize your bookings by understanding the Pantón STR occupancy trends. Seasonal demand shifts significantly influence how often properties are booked. Typically, Augustsees the highest demand (peak season occupancy), while January experiences the lowest (low season). Effective strategies, like adjusting minimum stays or offering promotions, can boost occupancy during slower periods. Here's how different property tiers perform in Pantón:
- Best-in-class properties (Top 10%) achieve 56%+ occupancy, indicating high desirability and potentially optimized availability.
- Strong performing properties (Top 25%) maintain 37% or higher occupancy, suggesting good market fit and guest satisfaction.
- Typical properties (Median) have an occupancy rate around 22%.
- Entry-level properties (Bottom 25%) average 13% occupancy, potentially facing higher vacancy.
Average Monthly Occupancy Rate Trend in Pantón
Average Daily Rate (ADR) Airbnb Trends in Pantón (2026)
Effective short term rental pricing strategy in Pantón involves understanding monthly ADR fluctuations. The Average Daily Rate (ADR) for Airbnb in Pantón typically peaks in August and dips lowest during February. Leveraging Airbnb dynamic pricing tools or strategies based on this seasonality can significantly boost revenue. Here's a look at the typical nightly rates achieved:
- Best-in-class properties (Top 10%) command rates of $313+ per night, often due to premium features or locations.
- Strong performing properties (Top 25%) achieve nightly rates of $195 or more.
- Typical properties (Median) charge around $130 per night.
- Entry-level properties (Bottom 25%) earn around $96 per night.
Average Daily Rate (ADR) Trend by Month in Pantón
Get Live Pantón Market Intelligence 👇

Explore Real-time Analytics
Airbnb Seasonality Analysis & Trends in Pantón (2026)
Peak Season (August, July, April)
- Revenue averages $2,629 per month
- Occupancy rates average 41.6%
- Daily rates average $172
Shoulder Season
- Revenue averages $1,180 per month
- Occupancy maintains around 24.6%
- Daily rates hold near $168
Low Season (January, October, December)
- Revenue drops to average $792 per month
- Occupancy decreases to average 16.6%
- Daily rates adjust to average $174
Seasonality Insights for Pantón
- The Airbnb seasonality in Pantón shows highly seasonal trends requiring careful strategy. While the sections above show seasonal averages, it's also insightful to look at the extremes:
- During the high season, the absolute peak month showcases Pantón's highest earning potential, with monthly revenues capable of climbing to $3,850, occupancy reaching a high of 55.3%, and ADRs peaking at $179.
- Conversely, the slowest single month of the year, typically falling within the low season, marks the market's lowest point. In this month, revenue might dip to $653, occupancy could drop to 14.2%, and ADRs may adjust down to $160.
- Understanding both the seasonal averages and these monthly peaks and troughs in revenue, occupancy, and ADR is crucial for maximizing your Airbnb profit potential in Pantón.
Seasonal Strategies for Maximizing Profit
- Peak Season: Maximize revenue through premium pricing and potentially longer minimum stays. Ensure high availability.
- Low Season: Offer competitive pricing, special promotions (e.g., extended stay discounts), and flexible cancellation policies. Target off-season travelers like remote workers or budget-conscious guests.
- Shoulder Seasons: Implement dynamic pricing that balances peak and low rates. Target weekend travelers or specific events. Offer slightly more flexible terms than peak season.
- Regularly analyze your own performance against these Pantón seasonality benchmarks and adjust your pricing and availability strategy accordingly.
Best Areas for Airbnb Investment in Pantón (2026)
Exploring the top neighborhoods for short-term rentals in Pantón? This section highlights key areas, outlining why they are attractive for hosts and guests, along with notable local attractions. Consider these locations based on your target guest profile and investment strategy.
| Neighborhood / Area | Why Host Here? (Target Guests & Appeal) | Key Attractions & Landmarks |
|---|---|---|
| Castro de Ouro | An archaeological site and ancient fortress that draws history enthusiasts and tourists interested in Galician culture. | Castro de Ouro, Local vineyards, Rural walking trails, Traditional Galician cuisine |
| Pazo de Tor | A beautiful manor house that attracts visitors interested in Galician architecture and nature, suitable for hosting guests who appreciate history and tranquility. | Pazo de Tor, Gardens, Rural surroundings, Art and culture events |
| Fervenza do Ézaro | A stunning waterfall and natural site that offers outdoor activities and breathtaking views, perfect for nature lovers and adventure tourists. | Fervenza do Ézaro, Hiking trails, Boat trips, Picnic areas |
| Aldea de Loio | A charming village that showcases traditional Galician life, ideal for immersive experiences in local culture and hospitality. | Traditional village experience, Local festivals, Culinary tours, Cultural workshops |
| Meirás Beach | A picturesque beach area popular for summer visitors, suitable for those looking for a seaside getaway with plenty of outdoor fun. | Meirás Beach, Water sports, Seaside restaurants, Coastal hiking |
| Vilouchada | Known for its scenic beauty and proximity to various nature reserves, it attracts eco-tourists and visitors seeking peace and quiet. | Nature reserves, Birdwatching, Botanical gardens, Hiking expeditions |
| Monasterio de San Pedro de Cálvoz | An ancient monastery offering a glimpse into history, perfect for guests interested in spirituality and historical architecture. | Monastery, Historical tours, Cultural events, Scenic views |
| Camino de Santiago | Part of the famous pilgrimage route, attracting travelers looking for spiritual journeys or adventure tourism, providing a vibrant local hospitality scene. | Camino de Santiago route, Pilgrimage experiences, Local accommodations, Cultural heritage sites |
Understanding Airbnb License Requirements & STR Laws in Pantón (2026)
Yes, Pantón, Galicia, Spain enforces high STR regulations. Obtaining a license and ensuring compliance is almost certainly required according to current 2026 STR laws. Always verify the latest short term rental regulations and Airbnb license requirements directly with local government authorities for Pantón to ensure full compliance before hosting.
(Source: AirROI data, 2026, based on 68% licensed listings)
Top Performing Airbnb Properties in Pantón (2026)
Benchmark your potential! Explore examples of top-performing Airbnb properties in Pantónbased on Trailing Twelve Month (TTM) revenue. Analyze their characteristics, revenue, occupancy rate, and ADR to understand what drives success in this market.
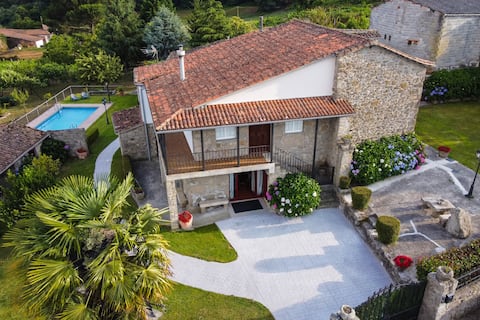
Villa in Ribeira Sacra with pool
Entire Place • 6 bedrooms

Lovely house with vineyard in Ribeira Sacra
Entire Place • 6 bedrooms

casa para grupos en la Ribeira sacra
Entire Place • 7 bedrooms
Villa in the Ribera Sacra or Batuxo
Entire Place • 1 bedroom

O Pendello Country House
Entire Place • 4 bedrooms

Vila Riveiro (Vilamelle, Pantón, Ribeira Sacra)
Entire Place • 2 bedrooms
Note: Performance varies based on location, size, amenities, seasonality, and management quality. Data reflects the past 12 months.
Top Performing Airbnb Hosts in Pantón (2026)
Learn from the best! This table showcases top-performing Airbnb hosts in Pantón based on the number of properties managed and estimated total revenue over the past year. Analyze their scale and performance metrics.
| Host Name | Properties | Grossing Revenue | Stay Reviews | Avg Rating |
|---|---|---|---|---|
| Carlos Manuel | 4 | $57,765 | 23 | 5.00/5.0 |
| Aldeade | 1 | $53,851 | 12 | 5.00/5.0 |
| Adrian | 3 | $47,129 | 234 | 4.94/5.0 |
| Berni | 4 | $45,485 | 19 | 4.88/5.0 |
| Isabel | 1 | $45,465 | 15 | 5.00/5.0 |
| Casa Rural | 6 | $20,580 | 13 | 5.00/5.0 |
| Vicente | 1 | $20,556 | 69 | 4.94/5.0 |
| Erik | 1 | $14,667 | 10 | 4.90/5.0 |
| Jl & Dn | 1 | $13,764 | 14 | 5.00/5.0 |
| Alicia | 1 | $12,734 | 11 | 4.64/5.0 |
Analyzing the strategies of top hosts, such as their property selection, pricing, and guest communication, can offer valuable lessons for optimizing your own Airbnb operations in Pantón.
Dive Deeper: Advanced Pantón STR Market Data (2026)
Ready to unlock more insights? AirROI provides access to advanced metrics and comprehensive Airbnb data for Pantón. Explore detailed analytics beyond this report to refine your investment strategy, optimize pricing, and maximize your vacation rental profits.
Explore Advanced MetricsPantón Short-Term Rental Market Composition (2026): Property & Room Types
Room Type Distribution
Property Type Distribution
Market Composition Insights for Pantón
- The Pantón Airbnb market composition is heavily skewed towards Entire Home/Apt listings, which make up 89.2% of the 37 active rentals. This indicates strong guest preference for privacy and space.
- Looking at the property type distribution in Pantón, House properties are the most common (70.3%), reflecting the local real estate landscape.
- Houses represent a significant 70.3% portion, catering likely to families or larger groups.
- The presence of 10.8% Hotel/Boutique listings indicates integration with traditional hospitality.
- Smaller segments like outdoor/unique (combined 2.7%) offer potential for unique stay experiences.
Pantón Airbnb Room Capacity Analysis (2026): Bedroom Distribution
Distribution of Listings by Number of Bedrooms
Room Capacity Insights for Pantón
- The dominant room capacity in Pantón is 2 bedrooms listings, making up 29.7% of the market. This suggests a strong demand for properties suitable for couples or solo travelers.
- Together, 2 bedrooms and 1 bedroom properties represent 51.3% of the active Airbnb listings in Pantón, indicating a high concentration in these sizes.
- A significant 40.5% of listings offer 3+ bedrooms, catering to larger groups and families seeking more space in Pantón.
Pantón Vacation Rental Guest Capacity Trends (2026)
Distribution of Listings by Guest Capacity
Guest Capacity Insights for Pantón
- The most common guest capacity trend in Pantón vacation rentals is listings accommodating 4 guests (27%). This suggests the primary traveler segment is likely small families or groups.
- Properties designed for 4 guests and 8+ guests dominate the Pantón STR market, accounting for 48.6% of listings.
- 43.2% of properties accommodate 6+ guests, serving the market segment for larger families or group travel in Pantón.
- On average, properties in Pantón are equipped to host 5.0 guests.
Pantón Airbnb Booking Patterns (2026): Available vs. Booked Days
Available Days Distribution
Booked Days Distribution
Booking Pattern Insights for Pantón
- The most common availability pattern in Pantón falls within the 271-366 days range, representing 78.4% of listings. This suggests many properties have significant open periods on their calendars.
- Approximately 97.3% of listings show high availability (181+ days open annually), indicating potential for increased bookings or specific owner usage patterns.
- For booked days, the 31-90 days range is most frequent in Pantón (51.4%), reflecting common guest stay durations or potential owner blocking patterns.
- A notable 2.7% of properties secure long booking periods (181+ days booked per year), highlighting successful long-term rental strategies or significant owner usage.
Pantón Airbnb Minimum Stay Requirements Analysis
Distribution of Listings by Minimum Night Requirement
1 Night
1 listings
2.7% of total
2 Nights
10 listings
27% of total
3 Nights
2 listings
5.4% of total
4-6 Nights
3 listings
8.1% of total
30+ Nights
21 listings
56.8% of total
Key Insights
- The most prevalent minimum stay requirement in Pantón is 30+ Nights, adopted by 56.8% of listings. This highlights the market's preference for longer commitments.
- A significant segment (56.8%) caters to monthly stays (30+ nights) in Pantón, pointing to opportunities in the extended-stay market.
Recommendations
- Align with the market by considering a 30+ Nights minimum stay, as 56.8% of Pantón hosts use this setting.
- If feasible, allowing 1-night stays, especially midweek or during low season, could capture last-minute bookings, as only 2.7% currently do.
- Explore offering discounts for stays of 30+ nights to attract the 56.8% of the market seeking extended stays.
- Adjust minimum nights based on seasonality – potentially shorter during low season and longer during peak demand periods in Pantón.
Pantón Airbnb Cancellation Policy Trends Analysis (2026)
Flexible
11 listings
29.7% of total
Moderate
13 listings
35.1% of total
Firm
8 listings
21.6% of total
Strict
5 listings
13.5% of total
Cancellation Policy Insights for Pantón
- The prevailing Airbnb cancellation policy trend in Pantón is Moderate, used by 35.1% of listings.
- There's a relatively balanced mix between guest-friendly (64.8%) and stricter (35.1%) policies, offering choices for different guest needs.
Recommendations for Hosts
- Consider adopting a Moderate policy to align with the 35.1% market standard in Pantón.
- Using a Strict policy might deter some guests, as only 13.5% of listings use it. Evaluate if potential revenue protection outweighs possible lower booking rates.
- Regularly review your cancellation policy against competitors and market demand shifts in Pantón.
Pantón STR Booking Lead Time Analysis (2026)
Average Booking Lead Time by Month
Booking Lead Time Insights for Pantón
- The overall average booking lead time for vacation rentals in Pantón is 40 days.
- Guests book furthest in advance for stays during August (average 83 days), likely coinciding with peak travel demand or local events.
- The shortest booking windows occur for stays in January (average 15 days), indicating more last-minute travel plans during this time.
- Seasonally, Summer (53 days avg.) sees the longest lead times, while Winter (22 days avg.) has the shortest, reflecting typical travel planning cycles.
Recommendations for Hosts
- Use the overall average lead time (40 days) as a baseline for your pricing and availability strategy in Pantón.
- For August stays, consider implementing length-of-stay discounts or slightly higher rates for bookings made less than 83 days out to capitalize on advance planning.
- Target marketing efforts for the Summer season well in advance (at least 53 days) to capture early planners.
- Monitor your own booking lead times against these Pantón averages to identify opportunities for dynamic pricing adjustments.
Popular & Essential Airbnb Amenities in Pantón (2026)
Amenity Prevalence
Amenity Insights for Pantón
- Essential amenities in Pantón that guests expect include: Kitchen. Lacking these (this) could significantly impact bookings.
- Popular amenities like TV, Hair dryer, Hot water are common but not universal. Offering these can provide a competitive edge.
Recommendations for Hosts
- Ensure your listing includes all essential amenities for Pantón: Kitchen.
- Consider adding popular differentiators like TV or Hair dryer to increase appeal.
- Highlight unique or less common amenities you offer (e.g., hot tub, dedicated workspace, EV charger) in your listing description and photos.
- Regularly check competitor amenities in Pantón to stay competitive.
Pantón Airbnb Guest Demographics & Profile Analysis (2026)
Guest Profile Summary for Pantón
- The typical guest profile for Airbnb in Pantón consists of primarily domestic travelers (76%), often arriving from nearby Madrid, typically belonging to the Post-2000s (Gen Z/Alpha) group (50%), primarily speaking Spanish or English.
- Domestic travelers account for 75.8% of guests.
- Key international markets include Spain (75.8%) and United Kingdom (9.1%).
- Top languages spoken are Spanish (36.8%) followed by English (29.8%).
- A significant demographic segment is the Post-2000s (Gen Z/Alpha) group, representing 50% of guests.
Recommendations for Hosts
- Target domestic marketing efforts towards travelers from Madrid and Seville.
- Tailor amenities and listing descriptions to appeal to the dominant Post-2000s (Gen Z/Alpha) demographic (e.g., highlight fast WiFi, smart home features, local guides).
- Highlight unique local experiences or amenities relevant to the primary guest profile.
- Consider seasonal promotions aligned with peak travel times for key origin markets.
Nearby Short-Term Rental Market Comparison
How does the Pantón Airbnb market stack up against its neighbors? Compare key performance metrics like average monthly revenue, ADR, and occupancy rates in surrounding areas to understand the broader regional STR landscape.
| Market | Active Properties | Monthly Revenue | Daily Rate | Avg. Occupancy |
|---|---|---|---|---|
| Penhalonga e Paços de Gaiolo | 23 | $4,304 | $357.04 | 40% |
| Sande e São Lourenço do Douro | 19 | $3,009 | $319.97 | 37% |
| Armamar | 66 | $2,578 | $266.43 | 36% |
| Alpendorada, Várzea e Torrão | 19 | $2,503 | $264.40 | 35% |
| Vila Boa de Quires e Maureles | 10 | $2,316 | $202.63 | 48% |
| Alijó | 69 | $2,072 | $250.65 | 30% |
| Cinfães | 16 | $2,059 | $253.86 | 28% |
| Portomarín | 12 | $2,006 | $181.90 | 49% |
| Barreiros | 10 | $1,928 | $192.32 | 39% |
| Pazos | 10 | $1,928 | $225.59 | 36% |