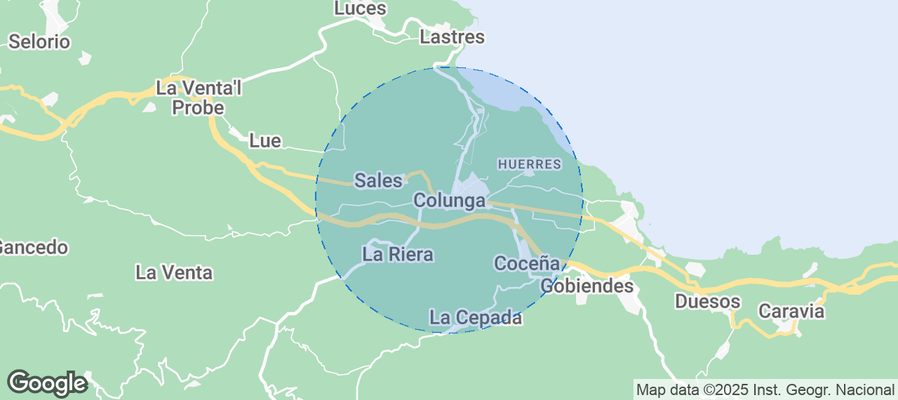
Colunga Airbnb Market Analysis 2026: Short Term Rental Data & Vacation Rental Statistics in Principado de Asturias, Spain
Is Airbnb profitable in Colunga in 2026? Explore comprehensive Airbnb analytics for Colunga, Principado de Asturias, Spain to uncover income potential. This 2026 STR market report for Colunga, based on AirROI data from February 2025 to January 2026, reveals key trends in the niche market of 127 active listings.
Whether you're considering an Airbnb investment in Colunga, optimizing your existing vacation rental, or exploring rental arbitrage opportunities, understanding the Colunga Airbnb data is crucial. Navigating the high regulation landscape is key to maximizing your short term rental income potential. Let's dive into the specifics.
Key Colunga Airbnb Performance Metrics Overview
Monthly Airbnb Revenue Variations & Income Potential in Colunga (2026)
Understanding the monthly revenue variations for Airbnb listings in Colunga is key to maximizing your short term rental income potential. Seasonality significantly impacts earnings. Our analysis, based on data from the past 12 months, shows that the peak revenue month for STRs in Colunga is typically August, while February often presents the lowest earnings, highlighting opportunities for strategic pricing adjustments during shoulder and low seasons. Explore the typical Airbnb income in Colunga across different performance tiers:
- Best-in-class properties (Top 10%) achieve $3,208+ monthly, often utilizing dynamic pricing and superior guest experiences.
- Strong performing properties (Top 25%) earn $2,137 or more, indicating effective management and desirable locations/amenities.
- Typical properties (Median) generate around $1,323 per month, representing the average market performance.
- Entry-level properties (Bottom 25%) see earnings around $758, often with potential for optimization.
Average Monthly Airbnb Earnings Trend in Colunga
Colunga Airbnb Occupancy Rate Trends (2026)
Maximize your bookings by understanding the Colunga STR occupancy trends. Seasonal demand shifts significantly influence how often properties are booked. Typically, Augustsees the highest demand (peak season occupancy), while January experiences the lowest (low season). Effective strategies, like adjusting minimum stays or offering promotions, can boost occupancy during slower periods. Here's how different property tiers perform in Colunga:
- Best-in-class properties (Top 10%) achieve 64%+ occupancy, indicating high desirability and potentially optimized availability.
- Strong performing properties (Top 25%) maintain 48% or higher occupancy, suggesting good market fit and guest satisfaction.
- Typical properties (Median) have an occupancy rate around 31%.
- Entry-level properties (Bottom 25%) average 15% occupancy, potentially facing higher vacancy.
Average Monthly Occupancy Rate Trend in Colunga
Average Daily Rate (ADR) Airbnb Trends in Colunga (2026)
Effective short term rental pricing strategy in Colunga involves understanding monthly ADR fluctuations. The Average Daily Rate (ADR) for Airbnb in Colunga typically peaks in August and dips lowest during February. Leveraging Airbnb dynamic pricing tools or strategies based on this seasonality can significantly boost revenue. Here's a look at the typical nightly rates achieved:
- Best-in-class properties (Top 10%) command rates of $261+ per night, often due to premium features or locations.
- Strong performing properties (Top 25%) achieve nightly rates of $174 or more.
- Typical properties (Median) charge around $131 per night.
- Entry-level properties (Bottom 25%) earn around $109 per night.
Average Daily Rate (ADR) Trend by Month in Colunga
Get Live Colunga Market Intelligence 👇
Explore Real-time Analytics
Airbnb Seasonality Analysis & Trends in Colunga (2026)
Peak Season (August, July, September)
- Revenue averages $3,100 per month
- Occupancy rates average 53.4%
- Daily rates average $177
Shoulder Season
- Revenue averages $1,305 per month
- Occupancy maintains around 28.8%
- Daily rates hold near $159
Low Season (January, February, March)
- Revenue drops to average $832 per month
- Occupancy decreases to average 23.0%
- Daily rates adjust to average $151
Seasonality Insights for Colunga
- The Airbnb seasonality in Colunga shows highly seasonal trends requiring careful strategy. While the sections above show seasonal averages, it's also insightful to look at the extremes:
- During the high season, the absolute peak month showcases Colunga's highest earning potential, with monthly revenues capable of climbing to $4,044, occupancy reaching a high of 65.9%, and ADRs peaking at $181.
- Conversely, the slowest single month of the year, typically falling within the low season, marks the market's lowest point. In this month, revenue might dip to $654, occupancy could drop to 19.6%, and ADRs may adjust down to $146.
- Understanding both the seasonal averages and these monthly peaks and troughs in revenue, occupancy, and ADR is crucial for maximizing your Airbnb profit potential in Colunga.
Seasonal Strategies for Maximizing Profit
- Peak Season: Maximize revenue through premium pricing and potentially longer minimum stays. Ensure high availability.
- Low Season: Offer competitive pricing, special promotions (e.g., extended stay discounts), and flexible cancellation policies. Target off-season travelers like remote workers or budget-conscious guests.
- Shoulder Seasons: Implement dynamic pricing that balances peak and low rates. Target weekend travelers or specific events. Offer slightly more flexible terms than peak season.
- Regularly analyze your own performance against these Colunga seasonality benchmarks and adjust your pricing and availability strategy accordingly.
Best Areas for Airbnb Investment in Colunga (2026)
Exploring the top neighborhoods for short-term rentals in Colunga? This section highlights key areas, outlining why they are attractive for hosts and guests, along with notable local attractions. Consider these locations based on your target guest profile and investment strategy.
| Neighborhood / Area | Why Host Here? (Target Guests & Appeal) | Key Attractions & Landmarks |
|---|---|---|
| Colunga Town | The charming town center offers authentic Asturian culture, traditional architecture, and a local lifestyle. It's a popular spot among tourists wanting to experience local attractions and events. | Church of San Juan de Duz, Local restaurants serving Asturian cider, Colunga's annual cider festival, Asturian museums |
| Beach of La Griega | A beautiful beach known for its scenic views and family-friendly environment. It attracts beachgoers and surfers, making it ideal for vacation rentals during the summer season. | La Griega Beach, Surfing schools, Coastal walking trails |
| The Jurassic Museum of Asturias | A significant attraction featuring dinosaur exhibits and paleontology, attracting families and educational groups. It's an excellent location for Airbnb stays aimed at educational tourism. | Jurassic Museum tours, Dinosaur fossil exhibits, Workshops for children |
| Cove of Lastres | The picturesque fishing village nearby is famous for its scenic coves and seafood cuisine. A fantastic retreat for those looking to unwind by the coast. | Lastres viewpoint, Local seafood restaurants, Historical fishing port |
| Pico Pienzu | Popular hiking destination offering stunning views of the Picos de Europa and the surrounding landscape. Ideal for nature lovers and adventure seekers. | Hiking trails, Scenic viewpoints, Picnic areas |
| Villaviciosa River | A serene area known for its natural beauty, offering walking paths and birdwatching opportunities. Attracts eco-tourists and nature enthusiasts. | Walking trails along the river, Biodiversity spots, Fishing locations |
| Llanes | Nearby coastal town famous for its beaches and historic town center. A gateway for tourists exploring the eastern Asturias coast. | Plaia de Toró, Llanes historical center, Coastal hiking paths |
| The Asturian Coast Path (Senda Costera) | A stunning coastal trail that runs along the coastline of Asturias. It attracts outdoor enthusiasts and hikers looking to experience the local landscape. | Coastal walkways, Nature reserves, Scenic viewpoints |
Understanding Airbnb License Requirements & STR Laws in Colunga (2026)
Yes, Colunga, Principado de Asturias, Spain enforces high STR regulations. Obtaining a license and ensuring compliance is almost certainly required according to current 2026 STR laws. Always verify the latest short term rental regulations and Airbnb license requirements directly with local government authorities for Colunga to ensure full compliance before hosting.
(Source: AirROI data, 2026, based on 76% licensed listings)
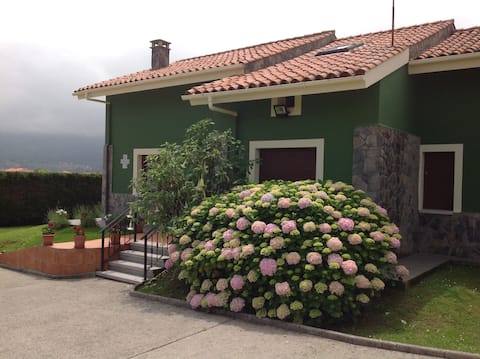
Top Performing Airbnb Properties in Colunga (2026)
Benchmark your potential! Explore examples of top-performing Airbnb properties in Colungabased on Trailing Twelve Month (TTM) revenue. Analyze their characteristics, revenue, occupancy rate, and ADR to understand what drives success in this market.

La Casita de la Higuera. "A window to paradise."
Entire Place • 1 bedroom
House with estate in La Isla (Colunga) 100 meters from the sea
Entire Place • 6 bedrooms

"Olas y Estrellas" luxury holiday home by the sea
Entire Place • 3 bedrooms

El Tresmayu country house. Garden and ocean views.
Entire Place • 4 bedrooms

Your dream getaway between the sea and the mountains!
Entire Place • 5 bedrooms

Spotless Stone House 10' from Colunga Beach
Entire Place • 6 bedrooms
Note: Performance varies based on location, size, amenities, seasonality, and management quality. Data reflects the past 12 months.
Top Performing Airbnb Hosts in Colunga (2026)
Learn from the best! This table showcases top-performing Airbnb hosts in Colunga based on the number of properties managed and estimated total revenue over the past year. Analyze their scale and performance metrics.
| Host Name | Properties | Grossing Revenue | Stay Reviews | Avg Rating |
|---|---|---|---|---|
| Julian | 14 | $182,044 | 309 | 4.68/5.0 |
| Jose Luis | 2 | $95,528 | 391 | 4.98/5.0 |
| Fernando | 5 | $57,458 | 108 | 4.61/5.0 |
| Luis Manuel | 2 | $54,717 | 330 | 4.91/5.0 |
| Herederos Blanco Sienra | 1 | $45,761 | 58 | 4.88/5.0 |
| Will | 1 | $45,686 | 111 | 4.86/5.0 |
| Cristina | 1 | $44,816 | 24 | 4.92/5.0 |
| R2R Consulting | 3 | $44,603 | 26 | 4.17/5.0 |
| Ramon | 1 | $42,669 | 23 | 4.96/5.0 |
| Nora | 1 | $41,261 | 1 | Not Rated |
Analyzing the strategies of top hosts, such as their property selection, pricing, and guest communication, can offer valuable lessons for optimizing your own Airbnb operations in Colunga.
Dive Deeper: Advanced Colunga STR Market Data (2026)
Ready to unlock more insights? AirROI provides access to advanced metrics and comprehensive Airbnb data for Colunga. Explore detailed analytics beyond this report to refine your investment strategy, optimize pricing, and maximize your vacation rental profits.
Explore Advanced MetricsColunga Short-Term Rental Market Composition (2026): Property & Room Types
Room Type Distribution
Property Type Distribution
Market Composition Insights for Colunga
- The Colunga Airbnb market composition is heavily skewed towards Entire Home/Apt listings, which make up 99.2% of the 127 active rentals. This indicates strong guest preference for privacy and space.
- Looking at the property type distribution in Colunga, House properties are the most common (52.8%), reflecting the local real estate landscape.
- Houses represent a significant 52.8% portion, catering likely to families or larger groups.
- Smaller segments like unique stays, hotel/boutique (combined 3.2%) offer potential for unique stay experiences.
Colunga Airbnb Room Capacity Analysis (2026): Bedroom Distribution
Distribution of Listings by Number of Bedrooms
Room Capacity Insights for Colunga
- The dominant room capacity in Colunga is 3 bedrooms listings, making up 33.1% of the market. This suggests a strong demand for properties suitable for families or small groups.
- Together, 3 bedrooms and 2 bedrooms properties represent 60.7% of the active Airbnb listings in Colunga, indicating a high concentration in these sizes.
- A significant 44.9% of listings offer 3+ bedrooms, catering to larger groups and families seeking more space in Colunga.
Colunga Vacation Rental Guest Capacity Trends (2026)
Distribution of Listings by Guest Capacity
Guest Capacity Insights for Colunga
- The most common guest capacity trend in Colunga vacation rentals is listings accommodating 4 guests (33.1%). This suggests the primary traveler segment is likely small families or groups.
- Properties designed for 4 guests and 6 guests dominate the Colunga STR market, accounting for 55.9% of listings.
- 38.5% of properties accommodate 6+ guests, serving the market segment for larger families or group travel in Colunga.
- On average, properties in Colunga are equipped to host 4.8 guests.
Colunga Airbnb Booking Patterns (2026): Available vs. Booked Days
Available Days Distribution
Booked Days Distribution
Booking Pattern Insights for Colunga
- The most common availability pattern in Colunga falls within the 271-366 days range, representing 71.7% of listings. This suggests many properties have significant open periods on their calendars.
- Approximately 93.0% of listings show high availability (181+ days open annually), indicating potential for increased bookings or specific owner usage patterns.
- For booked days, the 31-90 days range is most frequent in Colunga (44.9%), reflecting common guest stay durations or potential owner blocking patterns.
- A notable 7.9% of properties secure long booking periods (181+ days booked per year), highlighting successful long-term rental strategies or significant owner usage.
Colunga Airbnb Minimum Stay Requirements Analysis
Distribution of Listings by Minimum Night Requirement
2 Nights
16 listings
12.6% of total
3 Nights
16 listings
12.6% of total
4-6 Nights
14 listings
11% of total
7-29 Nights
3 listings
2.4% of total
30+ Nights
78 listings
61.4% of total
Key Insights
- The most prevalent minimum stay requirement in Colunga is 30+ Nights, adopted by 61.4% of listings. This highlights the market's preference for longer commitments.
- Very short stays (1-2 nights) are less common (12.6%), suggesting hosts prefer slightly longer bookings to optimize turnover.
- A significant segment (61.4%) caters to monthly stays (30+ nights) in Colunga, pointing to opportunities in the extended-stay market.
Recommendations
- Align with the market by considering a 30+ Nights minimum stay, as 61.4% of Colunga hosts use this setting.
- Explore offering discounts for stays of 30+ nights to attract the 61.4% of the market seeking extended stays.
- Adjust minimum nights based on seasonality – potentially shorter during low season and longer during peak demand periods in Colunga.
Colunga Airbnb Cancellation Policy Trends Analysis (2026)
Limited
3 listings
2.4% of total
Super Strict 60 Days
2 listings
1.6% of total
Flexible
20 listings
15.7% of total
Moderate
31 listings
24.4% of total
Firm
45 listings
35.4% of total
Strict
26 listings
20.5% of total
Cancellation Policy Insights for Colunga
- The prevailing Airbnb cancellation policy trend in Colunga is Firm, used by 35.4% of listings.
- A majority (55.9%) of hosts in Colunga utilize Firm or Strict policies, indicating a market where hosts prioritize booking security.
Recommendations for Hosts
- Consider adopting a Firm policy to align with the 35.4% market standard in Colunga.
- Regularly review your cancellation policy against competitors and market demand shifts in Colunga.
Colunga STR Booking Lead Time Analysis (2026)
Average Booking Lead Time by Month
Booking Lead Time Insights for Colunga
- The overall average booking lead time for vacation rentals in Colunga is 60 days.
- Guests book furthest in advance for stays during August (average 113 days), likely coinciding with peak travel demand or local events.
- The shortest booking windows occur for stays in February (average 23 days), indicating more last-minute travel plans during this time.
- Seasonally, Summer (81 days avg.) sees the longest lead times, while Winter (34 days avg.) has the shortest, reflecting typical travel planning cycles.
Recommendations for Hosts
- Use the overall average lead time (60 days) as a baseline for your pricing and availability strategy in Colunga.
- For August stays, consider implementing length-of-stay discounts or slightly higher rates for bookings made less than 113 days out to capitalize on advance planning.
- Target marketing efforts for the Summer season well in advance (at least 81 days) to capture early planners.
- Monitor your own booking lead times against these Colunga averages to identify opportunities for dynamic pricing adjustments.
Popular & Essential Airbnb Amenities in Colunga (2026)
Amenity Prevalence
Amenity Insights for Colunga
- Essential amenities in Colunga that guests expect include: Washer, TV, Kitchen. Lacking these (any) could significantly impact bookings.
- Popular amenities like Hot water, Iron, Heating are common but not universal. Offering these can provide a competitive edge.
Recommendations for Hosts
- Ensure your listing includes all essential amenities for Colunga: Washer, TV, Kitchen.
- Prioritize adding missing essentials: Washer, TV, Kitchen.
- Consider adding popular differentiators like Hot water or Iron to increase appeal.
- Highlight unique or less common amenities you offer (e.g., hot tub, dedicated workspace, EV charger) in your listing description and photos.
- Regularly check competitor amenities in Colunga to stay competitive.
Colunga Airbnb Guest Demographics & Profile Analysis (2026)
Guest Profile Summary for Colunga
- The typical guest profile for Airbnb in Colunga consists of a mix of domestic (53%) and international guests, often arriving from nearby Madrid, typically belonging to the Post-2000s (Gen Z/Alpha) group (50%), primarily speaking English or Spanish.
- Domestic travelers account for 52.9% of guests.
- Key international markets include Spain (52.9%) and France (8.8%).
- Top languages spoken are English (33.4%) followed by Spanish (30.5%).
- A significant demographic segment is the Post-2000s (Gen Z/Alpha) group, representing 50% of guests.
Recommendations for Hosts
- Balance marketing efforts between domestic and international channels based on the guest mix.
- Tailor amenities and listing descriptions to appeal to the dominant Post-2000s (Gen Z/Alpha) demographic (e.g., highlight fast WiFi, smart home features, local guides).
- Highlight unique local experiences or amenities relevant to the primary guest profile.
- Consider seasonal promotions aligned with peak travel times for key origin markets.
Nearby Short-Term Rental Market Comparison
How does the Colunga Airbnb market stack up against its neighbors? Compare key performance metrics like average monthly revenue, ADR, and occupancy rates in surrounding areas to understand the broader regional STR landscape.
| Market | Active Properties | Monthly Revenue | Daily Rate | Avg. Occupancy |
|---|---|---|---|---|
| Hermandad de Campoo de Suso | 30 | $2,144 | $393.46 | 24% |
| Llanera | 14 | $2,037 | $274.76 | 39% |
| Camaleño | 96 | $1,417 | $146.42 | 42% |
| Reocín | 41 | $1,406 | $238.07 | 38% |
| Mazcuerras | 22 | $1,403 | $214.82 | 29% |
| Villaviciosa | 242 | $1,399 | $196.93 | 36% |
| Molledo | 15 | $1,373 | $219.83 | 30% |
| Potes | 72 | $1,307 | $140.84 | 38% |
| Alfoz de Lloredo | 74 | $1,286 | $207.68 | 34% |
| Suances | 231 | $1,282 | $190.90 | 36% |