Ribeseya Airbnb Market Analysis 2026: Short Term Rental Data & Vacation Rental Statistics in Principado de Asturias, Spain
Is Airbnb profitable in Ribeseya in 2026? Explore comprehensive Airbnb analytics for Ribeseya, Principado de Asturias, Spain to uncover income potential. This 2026 STR market report for Ribeseya, based on AirROI data from February 2025 to January 2026, reveals key trends in the market of 240 active listings.
Whether you're considering an Airbnb investment in Ribeseya, optimizing your existing vacation rental, or exploring rental arbitrage opportunities, understanding the Ribeseya Airbnb data is crucial. Navigating the high regulation landscape is key to maximizing your short term rental income potential. Let's dive into the specifics.
Key Ribeseya Airbnb Performance Metrics Overview
Monthly Airbnb Revenue Variations & Income Potential in Ribeseya (2026)
Understanding the monthly revenue variations for Airbnb listings in Ribeseya is key to maximizing your short term rental income potential. Seasonality significantly impacts earnings. Our analysis, based on data from the past 12 months, shows that the peak revenue month for STRs in Ribeseya is typically August, while February often presents the lowest earnings, highlighting opportunities for strategic pricing adjustments during shoulder and low seasons. Explore the typical Airbnb income in Ribeseya across different performance tiers:
- Best-in-class properties (Top 10%) achieve $3,839+ monthly, often utilizing dynamic pricing and superior guest experiences.
- Strong performing properties (Top 25%) earn $2,431 or more, indicating effective management and desirable locations/amenities.
- Typical properties (Median) generate around $1,396 per month, representing the average market performance.
- Entry-level properties (Bottom 25%) see earnings around $767, often with potential for optimization.
Average Monthly Airbnb Earnings Trend in Ribeseya
Ribeseya Airbnb Occupancy Rate Trends (2026)
Maximize your bookings by understanding the Ribeseya STR occupancy trends. Seasonal demand shifts significantly influence how often properties are booked. Typically, Augustsees the highest demand (peak season occupancy), while January experiences the lowest (low season). Effective strategies, like adjusting minimum stays or offering promotions, can boost occupancy during slower periods. Here's how different property tiers perform in Ribeseya:
- Best-in-class properties (Top 10%) achieve 69%+ occupancy, indicating high desirability and potentially optimized availability.
- Strong performing properties (Top 25%) maintain 48% or higher occupancy, suggesting good market fit and guest satisfaction.
- Typical properties (Median) have an occupancy rate around 30%.
- Entry-level properties (Bottom 25%) average 15% occupancy, potentially facing higher vacancy.
Average Monthly Occupancy Rate Trend in Ribeseya
Average Daily Rate (ADR) Airbnb Trends in Ribeseya (2026)
Effective short term rental pricing strategy in Ribeseya involves understanding monthly ADR fluctuations. The Average Daily Rate (ADR) for Airbnb in Ribeseya typically peaks in August and dips lowest during March. Leveraging Airbnb dynamic pricing tools or strategies based on this seasonality can significantly boost revenue. Here's a look at the typical nightly rates achieved:
- Best-in-class properties (Top 10%) command rates of $341+ per night, often due to premium features or locations.
- Strong performing properties (Top 25%) achieve nightly rates of $220 or more.
- Typical properties (Median) charge around $150 per night.
- Entry-level properties (Bottom 25%) earn around $107 per night.
Average Daily Rate (ADR) Trend by Month in Ribeseya
Get Live Ribeseya Market Intelligence 👇
Explore Real-time Analytics
Airbnb Seasonality Analysis & Trends in Ribeseya (2026)
Peak Season (August, July, September)
- Revenue averages $3,360 per month
- Occupancy rates average 53.2%
- Daily rates average $210
Shoulder Season
- Revenue averages $1,490 per month
- Occupancy maintains around 30.5%
- Daily rates hold near $186
Low Season (January, February, November)
- Revenue drops to average $1,129 per month
- Occupancy decreases to average 22.5%
- Daily rates adjust to average $186
Seasonality Insights for Ribeseya
- The Airbnb seasonality in Ribeseya shows highly seasonal trends requiring careful strategy. While the sections above show seasonal averages, it's also insightful to look at the extremes:
- During the high season, the absolute peak month showcases Ribeseya's highest earning potential, with monthly revenues capable of climbing to $4,459, occupancy reaching a high of 64.0%, and ADRs peaking at $216.
- Conversely, the slowest single month of the year, typically falling within the low season, marks the market's lowest point. In this month, revenue might dip to $911, occupancy could drop to 20.6%, and ADRs may adjust down to $174.
- Understanding both the seasonal averages and these monthly peaks and troughs in revenue, occupancy, and ADR is crucial for maximizing your Airbnb profit potential in Ribeseya.
Seasonal Strategies for Maximizing Profit
- Peak Season: Maximize revenue through premium pricing and potentially longer minimum stays. Ensure high availability.
- Low Season: Offer competitive pricing, special promotions (e.g., extended stay discounts), and flexible cancellation policies. Target off-season travelers like remote workers or budget-conscious guests.
- Shoulder Seasons: Implement dynamic pricing that balances peak and low rates. Target weekend travelers or specific events. Offer slightly more flexible terms than peak season.
- Regularly analyze your own performance against these Ribeseya seasonality benchmarks and adjust your pricing and availability strategy accordingly.
Best Areas for Airbnb Investment in Ribeseya (2026)
Exploring the top neighborhoods for short-term rentals in Ribeseya? This section highlights key areas, outlining why they are attractive for hosts and guests, along with notable local attractions. Consider these locations based on your target guest profile and investment strategy.
| Neighborhood / Area | Why Host Here? (Target Guests & Appeal) | Key Attractions & Landmarks |
|---|---|---|
| Cangas de Onís | Famous for its stunning landscapes and proximity to the Picos de Europa National Park, this town is a gateway for outdoor enthusiasts and attracts tourists year-round. | Picos de Europa National Park, Roman Bridge, Covadonga Lakes, Cangas de Onís Basilica |
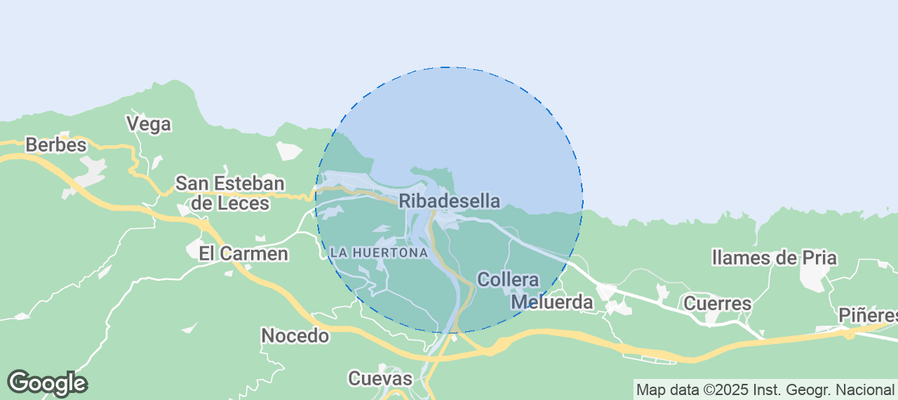
| Ribadesella | A charming coastal town known for its beautiful beaches and prehistoric caves, Ribadesella is popular among families and adventure seekers. | Ribadesella Beach, Cueva de Tito Bustillo, Sella River, Cuevas de las Foces |
| Llanes | Renowned for its picturesque seaside views and rich cultural heritage, Llanes offers a blend of relaxation and exploration with its numerous scenic spots. | Playa de Toró, Castillo de Cubera, Llanes Old Town, Basilica de Santa Maria |
| Gijón | A vibrant city with a rich industrial heritage and a growing cultural scene, Gijón attracts both tourists and business travelers with its dynamic atmosphere. | Cerro de Sta Catalina, Playa de San Lorenzo, Jardín Botánico Atlántico, Casino de Asturias |
| Oviedo | The capital of Asturias, famous for its historical architecture and lively atmosphere. A great location for tourists exploring the cultural side of the region. | Catedral de Oviedo, San Francisco Park, Museo de Bellas Artes de Asturias, Old Town |
| Avilés | Known for its medieval old town and modern architectural marvels, Avilés is an up-and-coming spot for travelers seeking diversity in experiences. | Oscar Niemeyer International Cultural Centre, Old Town, Avilés Church, Parque de las Meanas |
| Sotres | The highest village in the Picos de Europa with breathtaking mountain views and outdoor activities, perfect for nature lovers. | Picos de Europa National Park, Hiking Trails, Local Cheese Production, Sotres Caves |
| Cudillero | A picturesque fishing village with colorful houses and a scenic harbor, Cudillero is a prime location for coastal tourism and authentic experiences. | Cudillero Harbor, Mirador de la Garita, Viejo Cudillero, Local Seafood Restaurants |
Understanding Airbnb License Requirements & STR Laws in Ribeseya (2026)
Yes, Ribeseya, Principado de Asturias, Spain enforces high STR regulations. Obtaining a license and ensuring compliance is almost certainly required according to current 2026 STR laws. Always verify the latest short term rental regulations and Airbnb license requirements directly with local government authorities for Ribeseya to ensure full compliance before hosting.
(Source: AirROI data, 2026, based on 76% licensed listings)
Top Performing Airbnb Properties in Ribeseya (2026)
Benchmark your potential! Explore examples of top-performing Airbnb properties in Ribeseyabased on Trailing Twelve Month (TTM) revenue. Analyze their characteristics, revenue, occupancy rate, and ADR to understand what drives success in this market.
Guadamia Beach and Bufones de Pria
Entire Place • 7 bedrooms

El Jogueru, Rural Houses
Entire Place • 10 bedrooms

The Casona de la Mesana
Entire Place • 6 bedrooms

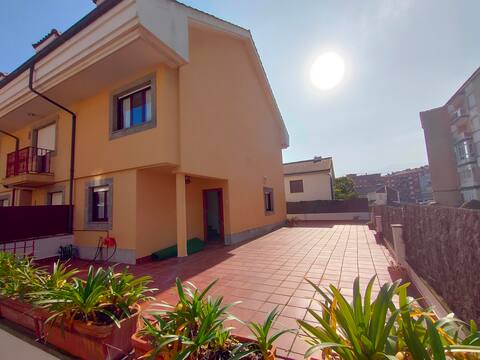
New house at Vega beach with great views.
Entire Place • 3 bedrooms

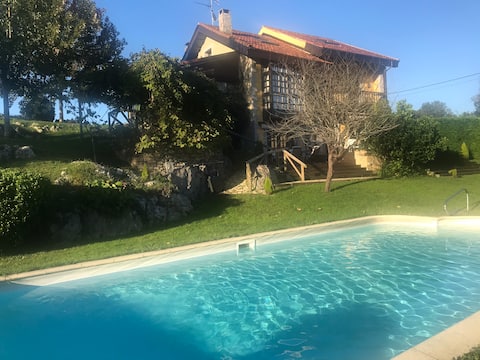
Mi Aldea Chica. House C with a private pool.
Entire Place • 2 bedrooms
A chalet one block from the BEACH, (Napalucri)
Entire Place • 4 bedrooms
Note: Performance varies based on location, size, amenities, seasonality, and management quality. Data reflects the past 12 months.
Top Performing Airbnb Hosts in Ribeseya (2026)
Learn from the best! This table showcases top-performing Airbnb hosts in Ribeseya based on the number of properties managed and estimated total revenue over the past year. Analyze their scale and performance metrics.
| Host Name | Properties | Grossing Revenue | Stay Reviews | Avg Rating |
|---|---|---|---|---|
| Cesar | 19 | $129,506 | 141 | 4.75/5.0 |
| Mi Aldea Chica | 2 | $99,501 | 67 | 4.98/5.0 |
| La Cortina De Pandiello | 2 | $91,966 | 8 | 4.80/5.0 |
| Teresa | 1 | $89,116 | 30 | 4.97/5.0 |
| R2R Consulting | 5 | $87,200 | 63 | 4.38/5.0 |
| Sara | 10 | $83,664 | 369 | 4.41/5.0 |
| Fernanda | 7 | $82,510 | 37 | 4.96/5.0 |
| Noelia | 5 | $75,072 | 132 | 4.80/5.0 |
| María | 1 | $68,592 | 16 | 5.00/5.0 |
| Mª Angeles | 3 | $68,496 | 35 | 4.68/5.0 |
Analyzing the strategies of top hosts, such as their property selection, pricing, and guest communication, can offer valuable lessons for optimizing your own Airbnb operations in Ribeseya.
Dive Deeper: Advanced Ribeseya STR Market Data (2026)
Ready to unlock more insights? AirROI provides access to advanced metrics and comprehensive Airbnb data for Ribeseya. Explore detailed analytics beyond this report to refine your investment strategy, optimize pricing, and maximize your vacation rental profits.
Explore Advanced MetricsRibeseya Short-Term Rental Market Composition (2026): Property & Room Types
Room Type Distribution
Property Type Distribution
Market Composition Insights for Ribeseya
- The Ribeseya Airbnb market composition is heavily skewed towards Entire Home/Apt listings, which make up 95.4% of the 240 active rentals. This indicates strong guest preference for privacy and space.
- Looking at the property type distribution in Ribeseya, House properties are the most common (50%), reflecting the local real estate landscape.
- Houses represent a significant 50% portion, catering likely to families or larger groups.
- Smaller segments like others, unique stays, hotel/boutique, outdoor/unique (combined 8.4%) offer potential for unique stay experiences.
Ribeseya Airbnb Room Capacity Analysis (2026): Bedroom Distribution
Distribution of Listings by Number of Bedrooms
Room Capacity Insights for Ribeseya
- The dominant room capacity in Ribeseya is 1 bedroom listings, making up 30% of the market. This suggests a strong demand for properties suitable for couples or solo travelers.
- Together, 1 bedroom and 2 bedrooms properties represent 58.3% of the active Airbnb listings in Ribeseya, indicating a high concentration in these sizes.
- A significant 40.0% of listings offer 3+ bedrooms, catering to larger groups and families seeking more space in Ribeseya.
Ribeseya Vacation Rental Guest Capacity Trends (2026)
Distribution of Listings by Guest Capacity
Guest Capacity Insights for Ribeseya
- The most common guest capacity trend in Ribeseya vacation rentals is listings accommodating 4 guests (32.1%). This suggests the primary traveler segment is likely small families or groups.
- Properties designed for 4 guests and 6 guests dominate the Ribeseya STR market, accounting for 49.2% of listings.
- 37.9% of properties accommodate 6+ guests, serving the market segment for larger families or group travel in Ribeseya.
- On average, properties in Ribeseya are equipped to host 4.8 guests.
Ribeseya Airbnb Booking Patterns (2026): Available vs. Booked Days
Available Days Distribution
Booked Days Distribution
Booking Pattern Insights for Ribeseya
- The most common availability pattern in Ribeseya falls within the 271-366 days range, representing 65% of listings. This suggests many properties have significant open periods on their calendars.
- Approximately 94.2% of listings show high availability (181+ days open annually), indicating potential for increased bookings or specific owner usage patterns.
- For booked days, the 31-90 days range is most frequent in Ribeseya (34.2%), reflecting common guest stay durations or potential owner blocking patterns.
- A notable 6.2% of properties secure long booking periods (181+ days booked per year), highlighting successful long-term rental strategies or significant owner usage.
Ribeseya Airbnb Minimum Stay Requirements Analysis
Distribution of Listings by Minimum Night Requirement
1 Night
14 listings
5.9% of total
2 Nights
21 listings
8.8% of total
3 Nights
15 listings
6.3% of total
4-6 Nights
40 listings
16.7% of total
7-29 Nights
9 listings
3.8% of total
30+ Nights
140 listings
58.6% of total
Key Insights
- The most prevalent minimum stay requirement in Ribeseya is 30+ Nights, adopted by 58.6% of listings. This highlights the market's preference for longer commitments.
- Very short stays (1-2 nights) are less common (14.7%), suggesting hosts prefer slightly longer bookings to optimize turnover.
- A significant segment (58.6%) caters to monthly stays (30+ nights) in Ribeseya, pointing to opportunities in the extended-stay market.
Recommendations
- Align with the market by considering a 30+ Nights minimum stay, as 58.6% of Ribeseya hosts use this setting.
- If feasible, allowing 1-night stays, especially midweek or during low season, could capture last-minute bookings, as only 5.9% currently do.
- Explore offering discounts for stays of 30+ nights to attract the 58.6% of the market seeking extended stays.
- Adjust minimum nights based on seasonality – potentially shorter during low season and longer during peak demand periods in Ribeseya.
Ribeseya Airbnb Cancellation Policy Trends Analysis (2026)
Super Strict 30 Days
3 listings
1.3% of total
Super Strict 60 Days
19 listings
8.1% of total
Limited
8 listings
3.4% of total
Flexible
26 listings
11% of total
Moderate
74 listings
31.4% of total
Firm
71 listings
30.1% of total
Strict
35 listings
14.8% of total
Cancellation Policy Insights for Ribeseya
- The prevailing Airbnb cancellation policy trend in Ribeseya is Moderate, used by 31.4% of listings.
- There's a relatively balanced mix between guest-friendly (42.4%) and stricter (44.9%) policies, offering choices for different guest needs.
Recommendations for Hosts
- Consider adopting a Moderate policy to align with the 31.4% market standard in Ribeseya.
- Using a Strict policy might deter some guests, as only 14.8% of listings use it. Evaluate if potential revenue protection outweighs possible lower booking rates.
- Regularly review your cancellation policy against competitors and market demand shifts in Ribeseya.
Ribeseya STR Booking Lead Time Analysis (2026)
Average Booking Lead Time by Month
Booking Lead Time Insights for Ribeseya
- The overall average booking lead time for vacation rentals in Ribeseya is 63 days.
- Guests book furthest in advance for stays during August (average 132 days), likely coinciding with peak travel demand or local events.
- The shortest booking windows occur for stays in February (average 19 days), indicating more last-minute travel plans during this time.
- Seasonally, Summer (87 days avg.) sees the longest lead times, while Winter (31 days avg.) has the shortest, reflecting typical travel planning cycles.
Recommendations for Hosts
- Use the overall average lead time (63 days) as a baseline for your pricing and availability strategy in Ribeseya.
- For August stays, consider implementing length-of-stay discounts or slightly higher rates for bookings made less than 132 days out to capitalize on advance planning.
- Target marketing efforts for the Summer season well in advance (at least 87 days) to capture early planners.
- Monitor your own booking lead times against these Ribeseya averages to identify opportunities for dynamic pricing adjustments.
Popular & Essential Airbnb Amenities in Ribeseya (2026)
Amenity Prevalence
Amenity Insights for Ribeseya
- Essential amenities in Ribeseya that guests expect include: TV. Lacking these (this) could significantly impact bookings.
- Popular amenities like Hot water, Washer, Kitchen are common but not universal. Offering these can provide a competitive edge.
Recommendations for Hosts
- Ensure your listing includes all essential amenities for Ribeseya: TV.
- Prioritize adding missing essentials: TV.
- Consider adding popular differentiators like Hot water or Washer to increase appeal.
- Highlight unique or less common amenities you offer (e.g., hot tub, dedicated workspace, EV charger) in your listing description and photos.
- Regularly check competitor amenities in Ribeseya to stay competitive.
Ribeseya Airbnb Guest Demographics & Profile Analysis (2026)
Guest Profile Summary for Ribeseya
- The typical guest profile for Airbnb in Ribeseya consists of a mix of domestic (60%) and international guests, often arriving from nearby Madrid, typically belonging to the Post-2000s (Gen Z/Alpha) group (50%), primarily speaking English or Spanish.
- Domestic travelers account for 60.3% of guests.
- Key international markets include Spain (60.3%) and France (7.8%).
- Top languages spoken are English (36%) followed by Spanish (34.5%).
- A significant demographic segment is the Post-2000s (Gen Z/Alpha) group, representing 50% of guests.
Recommendations for Hosts
- Target domestic marketing efforts towards travelers from Madrid and Zaragoza.
- Tailor amenities and listing descriptions to appeal to the dominant Post-2000s (Gen Z/Alpha) demographic (e.g., highlight fast WiFi, smart home features, local guides).
- Highlight unique local experiences or amenities relevant to the primary guest profile.
- Consider seasonal promotions aligned with peak travel times for key origin markets.
Nearby Short-Term Rental Market Comparison
How does the Ribeseya Airbnb market stack up against its neighbors? Compare key performance metrics like average monthly revenue, ADR, and occupancy rates in surrounding areas to understand the broader regional STR landscape.
| Market | Active Properties | Monthly Revenue | Daily Rate | Avg. Occupancy |
|---|---|---|---|---|
| Hermandad de Campoo de Suso | 30 | $2,144 | $393.46 | 24% |
| Llanera | 14 | $2,037 | $274.76 | 39% |
| Camaleño | 96 | $1,417 | $146.42 | 42% |
| Reocín | 41 | $1,406 | $238.07 | 38% |
| Mazcuerras | 22 | $1,403 | $214.82 | 29% |
| Villaviciosa | 242 | $1,399 | $196.93 | 36% |
| Molledo | 15 | $1,373 | $219.83 | 30% |
| Potes | 72 | $1,307 | $140.84 | 38% |
| Alfoz de Lloredo | 74 | $1,286 | $207.68 | 34% |
| Suances | 231 | $1,282 | $190.90 | 36% |