Salas Airbnb Market Analysis 2026: Short Term Rental Data & Vacation Rental Statistics in Principado de Asturias, Spain
Is Airbnb profitable in Salas in 2026? Explore comprehensive Airbnb analytics for Salas, Principado de Asturias, Spain to uncover income potential. This 2026 STR market report for Salas, based on AirROI data from February 2025 to January 2026, reveals key trends in the niche market of 28 active listings.
Whether you're considering an Airbnb investment in Salas, optimizing your existing vacation rental, or exploring rental arbitrage opportunities, understanding the Salas Airbnb data is crucial. Navigating the high regulation landscape is key to maximizing your short term rental income potential. Let's dive into the specifics.
Key Salas Airbnb Performance Metrics Overview
Monthly Airbnb Revenue Variations & Income Potential in Salas (2026)
Understanding the monthly revenue variations for Airbnb listings in Salas is key to maximizing your short term rental income potential. Seasonality significantly impacts earnings. Our analysis, based on data from the past 12 months, shows that the peak revenue month for STRs in Salas is typically August, while March often presents the lowest earnings, highlighting opportunities for strategic pricing adjustments during shoulder and low seasons. Explore the typical Airbnb income in Salas across different performance tiers:
- Best-in-class properties (Top 10%) achieve $2,976+ monthly, often utilizing dynamic pricing and superior guest experiences.
- Strong performing properties (Top 25%) earn $1,521 or more, indicating effective management and desirable locations/amenities.
- Typical properties (Median) generate around $765 per month, representing the average market performance.
- Entry-level properties (Bottom 25%) see earnings around $372, often with potential for optimization.
Average Monthly Airbnb Earnings Trend in Salas
Salas Airbnb Occupancy Rate Trends (2026)
Maximize your bookings by understanding the Salas STR occupancy trends. Seasonal demand shifts significantly influence how often properties are booked. Typically, Augustsees the highest demand (peak season occupancy), while February experiences the lowest (low season). Effective strategies, like adjusting minimum stays or offering promotions, can boost occupancy during slower periods. Here's how different property tiers perform in Salas:
- Best-in-class properties (Top 10%) achieve 53%+ occupancy, indicating high desirability and potentially optimized availability.
- Strong performing properties (Top 25%) maintain 33% or higher occupancy, suggesting good market fit and guest satisfaction.
- Typical properties (Median) have an occupancy rate around 21%.
- Entry-level properties (Bottom 25%) average 11% occupancy, potentially facing higher vacancy.
Average Monthly Occupancy Rate Trend in Salas
Average Daily Rate (ADR) Airbnb Trends in Salas (2026)
Effective short term rental pricing strategy in Salas involves understanding monthly ADR fluctuations. The Average Daily Rate (ADR) for Airbnb in Salas typically peaks in August and dips lowest during March. Leveraging Airbnb dynamic pricing tools or strategies based on this seasonality can significantly boost revenue. Here's a look at the typical nightly rates achieved:
- Best-in-class properties (Top 10%) command rates of $196+ per night, often due to premium features or locations.
- Strong performing properties (Top 25%) achieve nightly rates of $145 or more.
- Typical properties (Median) charge around $108 per night.
- Entry-level properties (Bottom 25%) earn around $82 per night.
Average Daily Rate (ADR) Trend by Month in Salas
Get Live Salas Market Intelligence 👇
Explore Real-time Analytics
Airbnb Seasonality Analysis & Trends in Salas (2026)
Peak Season (August, July, September)
- Revenue averages $2,075 per month
- Occupancy rates average 39.9%
- Daily rates average $151
Shoulder Season
- Revenue averages $1,168 per month
- Occupancy maintains around 23.2%
- Daily rates hold near $141
Low Season (January, February, March)
- Revenue drops to average $542 per month
- Occupancy decreases to average 16.7%
- Daily rates adjust to average $133
Seasonality Insights for Salas
- The Airbnb seasonality in Salas shows highly seasonal trends requiring careful strategy. While the sections above show seasonal averages, it's also insightful to look at the extremes:
- During the high season, the absolute peak month showcases Salas's highest earning potential, with monthly revenues capable of climbing to $2,839, occupancy reaching a high of 53.7%, and ADRs peaking at $155.
- Conversely, the slowest single month of the year, typically falling within the low season, marks the market's lowest point. In this month, revenue might dip to $479, occupancy could drop to 15.6%, and ADRs may adjust down to $124.
- Understanding both the seasonal averages and these monthly peaks and troughs in revenue, occupancy, and ADR is crucial for maximizing your Airbnb profit potential in Salas.
Seasonal Strategies for Maximizing Profit
- Peak Season: Maximize revenue through premium pricing and potentially longer minimum stays. Ensure high availability.
- Low Season: Offer competitive pricing, special promotions (e.g., extended stay discounts), and flexible cancellation policies. Target off-season travelers like remote workers or budget-conscious guests.
- Shoulder Seasons: Implement dynamic pricing that balances peak and low rates. Target weekend travelers or specific events. Offer slightly more flexible terms than peak season.
- Regularly analyze your own performance against these Salas seasonality benchmarks and adjust your pricing and availability strategy accordingly.
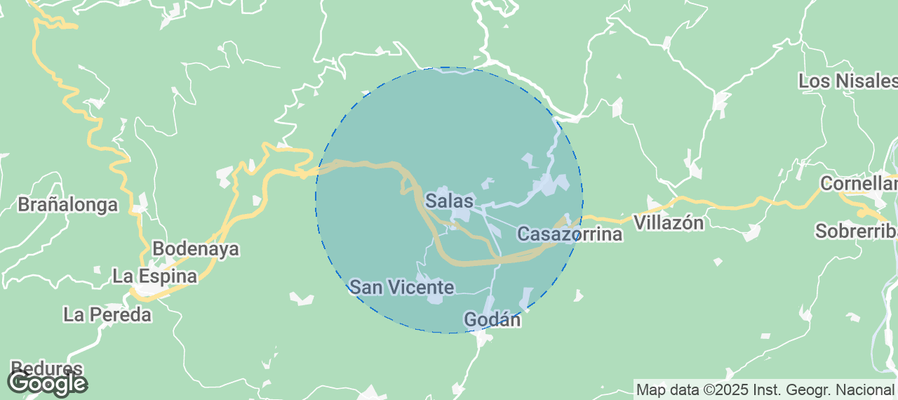
Best Areas for Airbnb Investment in Salas (2026)
Exploring the top neighborhoods for short-term rentals in Salas? This section highlights key areas, outlining why they are attractive for hosts and guests, along with notable local attractions. Consider these locations based on your target guest profile and investment strategy.
| Neighborhood / Area | Why Host Here? (Target Guests & Appeal) | Key Attractions & Landmarks |
|---|---|---|
| Salas Historic Center | Rich in history with medieval architecture and charming streets. Attracts tourists interested in cultural heritage and local traditions. | Palacio de Valdecarzana, Church of Santa Maria, Salas Museum of History, Cathedral of San Pedro, Plaza de la Villa |
| Natural Park of Las Ubiñas-La Mesa | Stunning natural landscapes ideal for outdoor activities. Attracts nature lovers, hikers, and those seeking tranquility in nature. | Hiking trails, Scenic viewpoints, Wildlife watching, Photos of mountain landscapes, Local flora and fauna |
| Villayón | A quaint village surrounded by lush nature, perfect for those looking for a peaceful getaway. Offers a glimpse of rural Asturian life. | Village communal spaces, Traditional Asturian architecture, Nature walks, Cultural events |
| Tineo | Nearby town with excellent access to the Asturian countryside and stunning views. Popular for both local tourism and outdoor activities. | Tineo Town Square, Basilica of Santa Maria, Hiking trails to Tineo, Charming local restaurants |
| Cangas del Narcea | Known for its picturesque landscapes and the nearby natural park, it attracts nature lovers and those interested in outdoor sports. | Natural Park of Fuentes del Narcea, Cangas del Narcea Historical Museum, Scenic Drives, Traditional Asturian cuisine |
| Grado | A charming town known for its rich gastronomy and proximity to the countryside, making it a great spot for food and nature enthusiasts. | Town Market, Traditional Asturian cider houses, Grado's historic center, Caminos de Santiago |
| Baja de la Montaña | A picturesque area perfect for tranquility and mountain scenery, appealing to tourists seeking remote escapes. | Mountain biking trails, Sky views, Local fauna, Camping spots |
| Cudillero | Beautiful coastal town known for its colorful houses and fishing culture. Great spot for tourists interested in seafood and local culture. | Cudillero Port, Scenic viewpoints, Fresh seafood restaurants, Charming streets |
Understanding Airbnb License Requirements & STR Laws in Salas (2026)
Yes, Salas, Principado de Asturias, Spain enforces high STR regulations. Obtaining a license and ensuring compliance is almost certainly required according to current 2026 STR laws. Always verify the latest short term rental regulations and Airbnb license requirements directly with local government authorities for Salas to ensure full compliance before hosting.
(Source: AirROI data, 2026, based on 64% licensed listings)
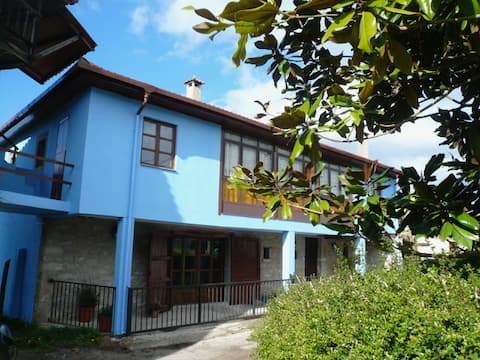
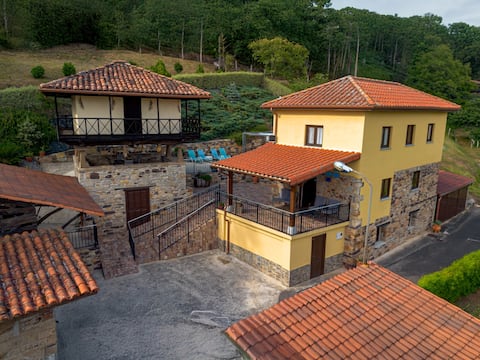
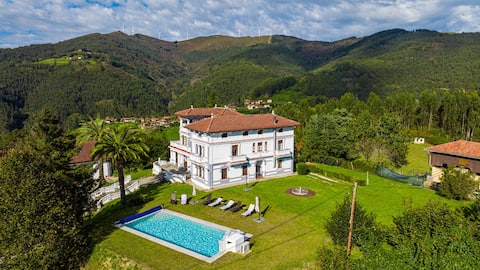
Top Performing Airbnb Properties in Salas (2026)
Benchmark your potential! Explore examples of top-performing Airbnb properties in Salasbased on Trailing Twelve Month (TTM) revenue. Analyze their characteristics, revenue, occupancy rate, and ADR to understand what drives success in this market.
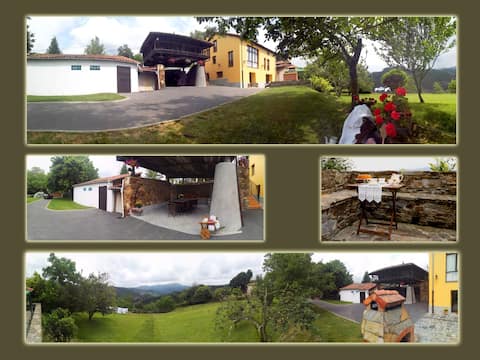
Casa Hortensia, paradise in Asturias
Entire Place • 6 bedrooms
Charming house for 6-9 people, meadow + bread maker
Entire Place • 5 bedrooms

house with a pool and a hot tub
Entire Place • 3 bedrooms
Las Vistas Vacation Home
Entire Place • 3 bedrooms
Villa with pool. Villa Alicia. La Perla Indiana
Entire Place • 8 bedrooms
The Casita del Campillo
Entire Place • 3 bedrooms
Note: Performance varies based on location, size, amenities, seasonality, and management quality. Data reflects the past 12 months.
Top Performing Airbnb Hosts in Salas (2026)
Learn from the best! This table showcases top-performing Airbnb hosts in Salas based on the number of properties managed and estimated total revenue over the past year. Analyze their scale and performance metrics.
| Host Name | Properties | Grossing Revenue | Stay Reviews | Avg Rating |
|---|---|---|---|---|
| Maria Elena | 1 | $40,829 | 20 | 4.90/5.0 |
| María | 1 | $34,001 | 7 | 4.86/5.0 |
| Inverdoriga | 6 | $31,051 | 39 | 4.44/5.0 |
| Faustino | 1 | $30,689 | 115 | 4.94/5.0 |
| Dolores | 3 | $30,670 | 4 | Not Rated |
| Maria Luisa | 5 | $24,354 | 97 | 4.92/5.0 |
| Mónica | 1 | $21,947 | 39 | 4.97/5.0 |
| Rafael | 1 | $19,268 | 52 | 4.94/5.0 |
| Leticia | 1 | $11,365 | 3 | 5.00/5.0 |
| Alfonso | 3 | $9,197 | 9 | 4.54/5.0 |
Analyzing the strategies of top hosts, such as their property selection, pricing, and guest communication, can offer valuable lessons for optimizing your own Airbnb operations in Salas.
Dive Deeper: Advanced Salas STR Market Data (2026)
Ready to unlock more insights? AirROI provides access to advanced metrics and comprehensive Airbnb data for Salas. Explore detailed analytics beyond this report to refine your investment strategy, optimize pricing, and maximize your vacation rental profits.
Explore Advanced MetricsSalas Short-Term Rental Market Composition (2026): Property & Room Types
Room Type Distribution
Property Type Distribution
Market Composition Insights for Salas
- The Salas Airbnb market composition is heavily skewed towards Entire Home/Apt listings, which make up 75% of the 28 active rentals. This indicates strong guest preference for privacy and space.
- Looking at the property type distribution in Salas, House properties are the most common (71.4%), reflecting the local real estate landscape.
- Houses represent a significant 71.4% portion, catering likely to families or larger groups.
- Smaller segments like others (combined 3.6%) offer potential for unique stay experiences.
Salas Airbnb Room Capacity Analysis (2026): Bedroom Distribution
Distribution of Listings by Number of Bedrooms
Room Capacity Insights for Salas
- The dominant room capacity in Salas is 1 bedroom listings, making up 35.7% of the market. This suggests a strong demand for properties suitable for couples or solo travelers.
- Together, 1 bedroom and 3 bedrooms properties represent 53.6% of the active Airbnb listings in Salas, indicating a high concentration in these sizes.
- A significant 35.8% of listings offer 3+ bedrooms, catering to larger groups and families seeking more space in Salas.
Salas Vacation Rental Guest Capacity Trends (2026)
Distribution of Listings by Guest Capacity
Guest Capacity Insights for Salas
- The most common guest capacity trend in Salas vacation rentals is listings accommodating 2 guests (35.7%). This suggests the primary traveler segment is likely couples or solo travelers.
- Properties designed for 2 guests and 6 guests dominate the Salas STR market, accounting for 50.0% of listings.
- 32.2% of properties accommodate 6+ guests, serving the market segment for larger families or group travel in Salas.
- On average, properties in Salas are equipped to host 3.6 guests.
Salas Airbnb Booking Patterns (2026): Available vs. Booked Days
Available Days Distribution
Booked Days Distribution
Booking Pattern Insights for Salas
- The most common availability pattern in Salas falls within the 271-366 days range, representing 82.1% of listings. This suggests many properties have significant open periods on their calendars.
- Approximately 100.0% of listings show high availability (181+ days open annually), indicating potential for increased bookings or specific owner usage patterns.
- For booked days, the 31-90 days range is most frequent in Salas (57.1%), reflecting common guest stay durations or potential owner blocking patterns.
- A notable 3.6% of properties secure long booking periods (181+ days booked per year), highlighting successful long-term rental strategies or significant owner usage.
Salas Airbnb Minimum Stay Requirements Analysis
Distribution of Listings by Minimum Night Requirement
1 Night
3 listings
10.7% of total
2 Nights
8 listings
28.6% of total
3 Nights
1 listings
3.6% of total
4-6 Nights
2 listings
7.1% of total
30+ Nights
14 listings
50% of total
Key Insights
- The most prevalent minimum stay requirement in Salas is 30+ Nights, adopted by 50% of listings. This highlights the market's preference for longer commitments.
- A significant segment (50%) caters to monthly stays (30+ nights) in Salas, pointing to opportunities in the extended-stay market.
Recommendations
- Align with the market by considering a 30+ Nights minimum stay, as 50% of Salas hosts use this setting.
- If feasible, allowing 1-night stays, especially midweek or during low season, could capture last-minute bookings, as only 10.7% currently do.
- Explore offering discounts for stays of 30+ nights to attract the 50% of the market seeking extended stays.
- Adjust minimum nights based on seasonality – potentially shorter during low season and longer during peak demand periods in Salas.
Salas Airbnb Cancellation Policy Trends Analysis (2026)
Flexible
4 listings
14.3% of total
Moderate
12 listings
42.9% of total
Firm
10 listings
35.7% of total
Strict
2 listings
7.1% of total
Cancellation Policy Insights for Salas
- The prevailing Airbnb cancellation policy trend in Salas is Moderate, used by 42.9% of listings.
- There's a relatively balanced mix between guest-friendly (57.2%) and stricter (42.8%) policies, offering choices for different guest needs.
- Strict cancellation policies are quite rare (7.1%), potentially making listings with this policy less competitive unless justified by high demand or property type.
Recommendations for Hosts
- Consider adopting a Moderate policy to align with the 42.9% market standard in Salas.
- Using a Strict policy might deter some guests, as only 7.1% of listings use it. Evaluate if potential revenue protection outweighs possible lower booking rates.
- Regularly review your cancellation policy against competitors and market demand shifts in Salas.
Salas STR Booking Lead Time Analysis (2026)
Average Booking Lead Time by Month
Booking Lead Time Insights for Salas
- The overall average booking lead time for vacation rentals in Salas is 65 days.
- Guests book furthest in advance for stays during August (average 95 days), likely coinciding with peak travel demand or local events.
- The shortest booking windows occur for stays in January (average 17 days), indicating more last-minute travel plans during this time.
- Seasonally, Summer (72 days avg.) sees the longest lead times, while Winter (33 days avg.) has the shortest, reflecting typical travel planning cycles.
Recommendations for Hosts
- Use the overall average lead time (65 days) as a baseline for your pricing and availability strategy in Salas.
- For August stays, consider implementing length-of-stay discounts or slightly higher rates for bookings made less than 95 days out to capitalize on advance planning.
- Target marketing efforts for the Summer season well in advance (at least 72 days) to capture early planners.
- Monitor your own booking lead times against these Salas averages to identify opportunities for dynamic pricing adjustments.
Popular & Essential Airbnb Amenities in Salas (2026)
Amenity Prevalence
Amenity Insights for Salas
- Popular amenities like Washer, Wifi, Essentials are common but not universal. Offering these can provide a competitive edge.
- Warning: Wifi is not universally provided but is considered essential globally. Ensure reliable Wifi is offered.
Recommendations for Hosts
- Consider adding popular differentiators like Washer or Wifi to increase appeal.
- Highlight unique or less common amenities you offer (e.g., hot tub, dedicated workspace, EV charger) in your listing description and photos.
- Regularly check competitor amenities in Salas to stay competitive.
Salas Airbnb Guest Demographics & Profile Analysis (2026)
Guest Profile Summary for Salas
- The typical guest profile for Airbnb in Salas consists of primarily domestic travelers (68%), often arriving from nearby Madrid, typically belonging to the Post-2000s (Gen Z/Alpha) group (50%), primarily speaking English or Spanish.
- Domestic travelers account for 68.0% of guests.
- Key international markets include Spain (68%) and France (6%).
- Top languages spoken are English (36.2%) followed by Spanish (29.3%).
- A significant demographic segment is the Post-2000s (Gen Z/Alpha) group, representing 50% of guests.
Recommendations for Hosts
- Target domestic marketing efforts towards travelers from Madrid and London.
- Tailor amenities and listing descriptions to appeal to the dominant Post-2000s (Gen Z/Alpha) demographic (e.g., highlight fast WiFi, smart home features, local guides).
- Highlight unique local experiences or amenities relevant to the primary guest profile.
- Consider seasonal promotions aligned with peak travel times for key origin markets.
Nearby Short-Term Rental Market Comparison
How does the Salas Airbnb market stack up against its neighbors? Compare key performance metrics like average monthly revenue, ADR, and occupancy rates in surrounding areas to understand the broader regional STR landscape.
| Market | Active Properties | Monthly Revenue | Daily Rate | Avg. Occupancy |
|---|---|---|---|---|
| Llanera | 14 | $2,037 | $274.76 | 39% |
| Portomarín | 12 | $2,006 | $181.90 | 49% |
| Villaviciosa | 242 | $1,399 | $196.93 | 36% |
| O Saviñao | 24 | $1,286 | $174.07 | 30% |
| San Andrés del Rabanedo | 12 | $1,281 | $155.26 | 34% |
| Palas de Rei | 19 | $1,279 | $142.71 | 43% |
| Gijón | 1,258 | $1,256 | $148.44 | 39% |
| Candamo | 19 | $1,250 | $210.81 | 30% |
| Riaño | 10 | $1,224 | $160.31 | 36% |
| Samos | 11 | $1,206 | $189.22 | 30% |