Soto del Barco Airbnb Market Analysis 2026: Short Term Rental Data & Vacation Rental Statistics in Principado de Asturias, Spain
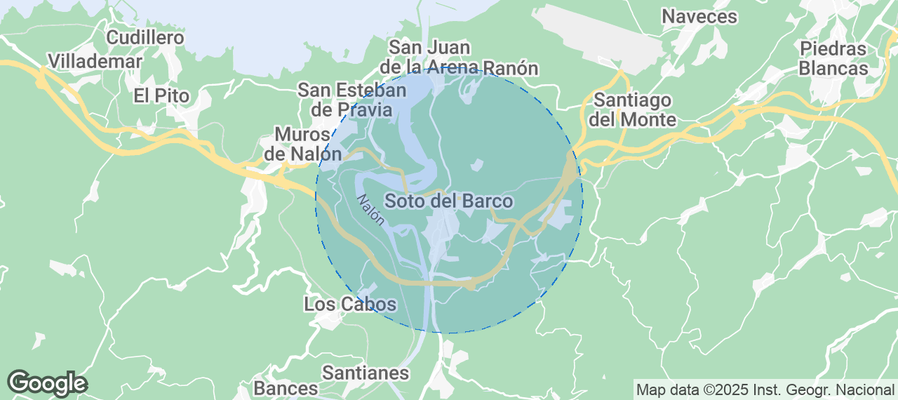
Is Airbnb profitable in Soto del Barco in 2026? Explore comprehensive Airbnb analytics for Soto del Barco, Principado de Asturias, Spain to uncover income potential. This 2026 STR market report for Soto del Barco, based on AirROI data from February 2025 to January 2026, reveals key trends in the niche market of 49 active listings.
Whether you're considering an Airbnb investment in Soto del Barco, optimizing your existing vacation rental, or exploring rental arbitrage opportunities, understanding the Soto del Barco Airbnb data is crucial. Navigating the high regulation landscape is key to maximizing your short term rental income potential. Let's dive into the specifics.
Key Soto del Barco Airbnb Performance Metrics Overview
Monthly Airbnb Revenue Variations & Income Potential in Soto del Barco (2026)
Understanding the monthly revenue variations for Airbnb listings in Soto del Barco is key to maximizing your short term rental income potential. Seasonality significantly impacts earnings. Our analysis, based on data from the past 12 months, shows that the peak revenue month for STRs in Soto del Barco is typically August, while January often presents the lowest earnings, highlighting opportunities for strategic pricing adjustments during shoulder and low seasons. Explore the typical Airbnb income in Soto del Barco across different performance tiers:
- Best-in-class properties (Top 10%) achieve $2,645+ monthly, often utilizing dynamic pricing and superior guest experiences.
- Strong performing properties (Top 25%) earn $1,877 or more, indicating effective management and desirable locations/amenities.
- Typical properties (Median) generate around $1,196 per month, representing the average market performance.
- Entry-level properties (Bottom 25%) see earnings around $707, often with potential for optimization.
Average Monthly Airbnb Earnings Trend in Soto del Barco
Soto del Barco Airbnb Occupancy Rate Trends (2026)
Maximize your bookings by understanding the Soto del Barco STR occupancy trends. Seasonal demand shifts significantly influence how often properties are booked. Typically, Augustsees the highest demand (peak season occupancy), while January experiences the lowest (low season). Effective strategies, like adjusting minimum stays or offering promotions, can boost occupancy during slower periods. Here's how different property tiers perform in Soto del Barco:
- Best-in-class properties (Top 10%) achieve 67%+ occupancy, indicating high desirability and potentially optimized availability.
- Strong performing properties (Top 25%) maintain 46% or higher occupancy, suggesting good market fit and guest satisfaction.
- Typical properties (Median) have an occupancy rate around 34%.
- Entry-level properties (Bottom 25%) average 18% occupancy, potentially facing higher vacancy.
Average Monthly Occupancy Rate Trend in Soto del Barco
Average Daily Rate (ADR) Airbnb Trends in Soto del Barco (2026)
Effective short term rental pricing strategy in Soto del Barco involves understanding monthly ADR fluctuations. The Average Daily Rate (ADR) for Airbnb in Soto del Barco typically peaks in August and dips lowest during February. Leveraging Airbnb dynamic pricing tools or strategies based on this seasonality can significantly boost revenue. Here's a look at the typical nightly rates achieved:
- Best-in-class properties (Top 10%) command rates of $227+ per night, often due to premium features or locations.
- Strong performing properties (Top 25%) achieve nightly rates of $169 or more.
- Typical properties (Median) charge around $119 per night.
- Entry-level properties (Bottom 25%) earn around $90 per night.
Average Daily Rate (ADR) Trend by Month in Soto del Barco
Get Live Soto del Barco Market Intelligence 👇
Explore Real-time Analytics
Airbnb Seasonality Analysis & Trends in Soto del Barco (2026)
Peak Season (August, July, September)
- Revenue averages $2,721 per month
- Occupancy rates average 57.0%
- Daily rates average $149
Shoulder Season
- Revenue averages $1,255 per month
- Occupancy maintains around 29.5%
- Daily rates hold near $139
Low Season (January, February, April)
- Revenue drops to average $832 per month
- Occupancy decreases to average 23.3%
- Daily rates adjust to average $131
Seasonality Insights for Soto del Barco
- The Airbnb seasonality in Soto del Barco shows highly seasonal trends requiring careful strategy. While the sections above show seasonal averages, it's also insightful to look at the extremes:
- During the high season, the absolute peak month showcases Soto del Barco's highest earning potential, with monthly revenues capable of climbing to $3,675, occupancy reaching a high of 73.0%, and ADRs peaking at $152.
- Conversely, the slowest single month of the year, typically falling within the low season, marks the market's lowest point. In this month, revenue might dip to $690, occupancy could drop to 16.0%, and ADRs may adjust down to $125.
- Understanding both the seasonal averages and these monthly peaks and troughs in revenue, occupancy, and ADR is crucial for maximizing your Airbnb profit potential in Soto del Barco.
Seasonal Strategies for Maximizing Profit
- Peak Season: Maximize revenue through premium pricing and potentially longer minimum stays. Ensure high availability.
- Low Season: Offer competitive pricing, special promotions (e.g., extended stay discounts), and flexible cancellation policies. Target off-season travelers like remote workers or budget-conscious guests.
- Shoulder Seasons: Implement dynamic pricing that balances peak and low rates. Target weekend travelers or specific events. Offer slightly more flexible terms than peak season.
- Regularly analyze your own performance against these Soto del Barco seasonality benchmarks and adjust your pricing and availability strategy accordingly.
Best Areas for Airbnb Investment in Soto del Barco (2026)
Exploring the top neighborhoods for short-term rentals in Soto del Barco? This section highlights key areas, outlining why they are attractive for hosts and guests, along with notable local attractions. Consider these locations based on your target guest profile and investment strategy.
| Neighborhood / Area | Why Host Here? (Target Guests & Appeal) | Key Attractions & Landmarks |
|---|---|---|
| Soto del Barco Town Center | The heart of Soto del Barco, offering easy access to shops, restaurants, and local life. A prime location for travelers wishing to experience the charm of a small coastal town. | Plaza de la Villa, Local restaurants, Shops, Cultural events, Nearby beaches |
| Avilés | A nearby city known for its historic architecture and vibrant cultural scene. Popular among tourists for its art, parks, and maritime activities. | Oscar Niemeyer Cultural Centre, Historic old town, Paseo de la Ría, Avilés harbor, Local festivals |
| Cudillero | A picturesque fishing village famous for its colorful houses and stunning scenery. Attracts tourists seeking picturesque views and authentic Spanish culture. | Cudillero harbor, Mirador de la Garita, Local seafood restaurants, Beaches, Photography spots |
| Las Caldas | A serene area known for its natural hot springs and wellness tourism. Ideal for travelers looking for relaxation and nature activities. | Natural hot springs, Spa hotels, Walking trails, Nature parks, Scenic landscapes |
| Asturian Coast | The beautiful coastline of Asturias, featuring stunning landscapes and outdoor activities. Perfect for tourists seeking adventure and nature. | Cliffs and beaches, Surfing spots, Hiking trails, Nature reserves, Seaside towns |
| El Espinar | A charming rural location with a tranquil atmosphere. Suitable for those looking to escape the city and enjoy nature. | Hiking trails, Rural landscape, Local traditions, Wildlife watching, Countryside activities |
| Pola de Lena | A small town surrounded by mountains, offering nature lovers hiking and stunning views. Great for experiencing local culture in a natural setting. | Mountains and hills, Cultural heritage sites, Outdoor sports, Local festivals, Picturesque scenery |
| La Barca | A quiet area near Soto del Barco, close to nature and perfect for rural tourism. Offers a peaceful retreat while still being near attractions. | Nature walks, Camping spots, Bird watching, Countryside experiences, Local gastronomy |
Understanding Airbnb License Requirements & STR Laws in Soto del Barco (2026)
Yes, Soto del Barco, Principado de Asturias, Spain enforces high STR regulations. Obtaining a license and ensuring compliance is almost certainly required according to current 2026 STR laws. Always verify the latest short term rental regulations and Airbnb license requirements directly with local government authorities for Soto del Barco to ensure full compliance before hosting.
(Source: AirROI data, 2026, based on 69% licensed listings)
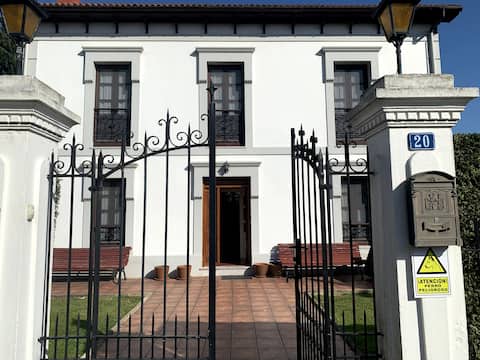
Top Performing Airbnb Properties in Soto del Barco (2026)
Benchmark your potential! Explore examples of top-performing Airbnb properties in Soto del Barcobased on Trailing Twelve Month (TTM) revenue. Analyze their characteristics, revenue, occupancy rate, and ADR to understand what drives success in this market.

Tábara, on the riverbank
Entire Place • 4 bedrooms
The Casona de Barganaz
Entire Place • 5 bedrooms

San Juan apartment. Pool and private parking.
Entire Place • 2 bedrooms

La Panera del Carbain, a refuge between the sea and the mountains
Entire Place • 3 bedrooms

Casa Xuan, beautiful country house with a farm
Entire Place • 4 bedrooms

L'Arena Apartment, 2 bedrooms in Asturias
Entire Place • 2 bedrooms
Note: Performance varies based on location, size, amenities, seasonality, and management quality. Data reflects the past 12 months.
Top Performing Airbnb Hosts in Soto del Barco (2026)
Learn from the best! This table showcases top-performing Airbnb hosts in Soto del Barco based on the number of properties managed and estimated total revenue over the past year. Analyze their scale and performance metrics.
| Host Name | Properties | Grossing Revenue | Stay Reviews | Avg Rating |
|---|---|---|---|---|
| Beatriz | 2 | $80,177 | 92 | 4.98/5.0 |
| Carlos | 6 | $74,021 | 18 | 4.83/5.0 |
| Maria Jesus | 1 | $47,277 | 15 | 4.87/5.0 |
| Mirador | 4 | $44,388 | 222 | 4.75/5.0 |
| AsturGuest | 1 | $25,132 | 8 | 4.63/5.0 |
| Yara | 1 | $23,684 | 21 | 5.00/5.0 |
| RentitUP Housing Experience | 1 | $21,905 | 28 | 4.36/5.0 |
| Angela | 3 | $21,874 | 40 | 4.89/5.0 |
| Isaac | 1 | $21,154 | 208 | 4.81/5.0 |
| Silastur | 2 | $20,192 | 4 | 4.67/5.0 |
Analyzing the strategies of top hosts, such as their property selection, pricing, and guest communication, can offer valuable lessons for optimizing your own Airbnb operations in Soto del Barco.
Dive Deeper: Advanced Soto del Barco STR Market Data (2026)
Ready to unlock more insights? AirROI provides access to advanced metrics and comprehensive Airbnb data for Soto del Barco. Explore detailed analytics beyond this report to refine your investment strategy, optimize pricing, and maximize your vacation rental profits.
Explore Advanced MetricsSoto del Barco Short-Term Rental Market Composition (2026): Property & Room Types
Room Type Distribution
Property Type Distribution
Market Composition Insights for Soto del Barco
- The Soto del Barco Airbnb market composition is heavily skewed towards Entire Home/Apt listings, which make up 89.8% of the 49 active rentals. This indicates strong guest preference for privacy and space.
- Looking at the property type distribution in Soto del Barco, House properties are the most common (44.9%), reflecting the local real estate landscape.
- Houses represent a significant 44.9% portion, catering likely to families or larger groups.
- The presence of 10.2% Hotel/Boutique listings indicates integration with traditional hospitality.
Soto del Barco Airbnb Room Capacity Analysis (2026): Bedroom Distribution
Distribution of Listings by Number of Bedrooms
Room Capacity Insights for Soto del Barco
- The dominant room capacity in Soto del Barco is 2 bedrooms listings, making up 46.9% of the market. This suggests a strong demand for properties suitable for couples or solo travelers.
- Together, 2 bedrooms and 1 bedroom properties represent 75.5% of the active Airbnb listings in Soto del Barco, indicating a high concentration in these sizes.
- A significant 22.5% of listings offer 3+ bedrooms, catering to larger groups and families seeking more space in Soto del Barco.
Soto del Barco Vacation Rental Guest Capacity Trends (2026)
Distribution of Listings by Guest Capacity
Guest Capacity Insights for Soto del Barco
- The most common guest capacity trend in Soto del Barco vacation rentals is listings accommodating 4 guests (36.7%). This suggests the primary traveler segment is likely small families or groups.
- Properties designed for 4 guests and 2 guests dominate the Soto del Barco STR market, accounting for 53.0% of listings.
- 24.5% of properties accommodate 6+ guests, serving the market segment for larger families or group travel in Soto del Barco.
- On average, properties in Soto del Barco are equipped to host 4.3 guests.
Soto del Barco Airbnb Booking Patterns (2026): Available vs. Booked Days
Available Days Distribution
Booked Days Distribution
Booking Pattern Insights for Soto del Barco
- The most common availability pattern in Soto del Barco falls within the 271-366 days range, representing 61.2% of listings. This suggests many properties have significant open periods on their calendars.
- Approximately 91.8% of listings show high availability (181+ days open annually), indicating potential for increased bookings or specific owner usage patterns.
- For booked days, the 31-90 days range is most frequent in Soto del Barco (42.9%), reflecting common guest stay durations or potential owner blocking patterns.
- A notable 10.2% of properties secure long booking periods (181+ days booked per year), highlighting successful long-term rental strategies or significant owner usage.
Soto del Barco Airbnb Minimum Stay Requirements Analysis
Distribution of Listings by Minimum Night Requirement
1 Night
5 listings
10.2% of total
2 Nights
13 listings
26.5% of total
3 Nights
5 listings
10.2% of total
4-6 Nights
5 listings
10.2% of total
7-29 Nights
2 listings
4.1% of total
30+ Nights
19 listings
38.8% of total
Key Insights
- The most prevalent minimum stay requirement in Soto del Barco is 30+ Nights, adopted by 38.8% of listings. This highlights the market's preference for longer commitments.
- A significant segment (38.8%) caters to monthly stays (30+ nights) in Soto del Barco, pointing to opportunities in the extended-stay market.
Recommendations
- Align with the market by considering a 30+ Nights minimum stay, as 38.8% of Soto del Barco hosts use this setting.
- If feasible, allowing 1-night stays, especially midweek or during low season, could capture last-minute bookings, as only 10.2% currently do.
- Explore offering discounts for stays of 30+ nights to attract the 38.8% of the market seeking extended stays.
- Adjust minimum nights based on seasonality – potentially shorter during low season and longer during peak demand periods in Soto del Barco.
Soto del Barco Airbnb Cancellation Policy Trends Analysis (2026)
Limited
1 listings
2% of total
Flexible
15 listings
30.6% of total
Moderate
19 listings
38.8% of total
Firm
9 listings
18.4% of total
Strict
5 listings
10.2% of total
Cancellation Policy Insights for Soto del Barco
- The prevailing Airbnb cancellation policy trend in Soto del Barco is Moderate, used by 38.8% of listings.
- There's a relatively balanced mix between guest-friendly (69.4%) and stricter (28.6%) policies, offering choices for different guest needs.
Recommendations for Hosts
- Consider adopting a Moderate policy to align with the 38.8% market standard in Soto del Barco.
- Using a Strict policy might deter some guests, as only 10.2% of listings use it. Evaluate if potential revenue protection outweighs possible lower booking rates.
- Regularly review your cancellation policy against competitors and market demand shifts in Soto del Barco.
Soto del Barco STR Booking Lead Time Analysis (2026)
Average Booking Lead Time by Month
Booking Lead Time Insights for Soto del Barco
- The overall average booking lead time for vacation rentals in Soto del Barco is 68 days.
- Guests book furthest in advance for stays during August (average 142 days), likely coinciding with peak travel demand or local events.
- The shortest booking windows occur for stays in November (average 13 days), indicating more last-minute travel plans during this time.
- Seasonally, Summer (102 days avg.) sees the longest lead times, while Winter (34 days avg.) has the shortest, reflecting typical travel planning cycles.
Recommendations for Hosts
- Use the overall average lead time (68 days) as a baseline for your pricing and availability strategy in Soto del Barco.
- For August stays, consider implementing length-of-stay discounts or slightly higher rates for bookings made less than 142 days out to capitalize on advance planning.
- During November, focus on last-minute booking availability and promotions, as guests book with very short notice (13 days avg.).
- Target marketing efforts for the Summer season well in advance (at least 102 days) to capture early planners.
- Monitor your own booking lead times against these Soto del Barco averages to identify opportunities for dynamic pricing adjustments.
Popular & Essential Airbnb Amenities in Soto del Barco (2026)
Amenity Prevalence
Amenity Insights for Soto del Barco
- Essential amenities in Soto del Barco that guests expect include: TV. Lacking these (this) could significantly impact bookings.
- Popular amenities like Heating, Kitchen, Hangers are common but not universal. Offering these can provide a competitive edge.
Recommendations for Hosts
- Ensure your listing includes all essential amenities for Soto del Barco: TV.
- Consider adding popular differentiators like Heating or Kitchen to increase appeal.
- Highlight unique or less common amenities you offer (e.g., hot tub, dedicated workspace, EV charger) in your listing description and photos.
- Regularly check competitor amenities in Soto del Barco to stay competitive.
Soto del Barco Airbnb Guest Demographics & Profile Analysis (2026)
Guest Profile Summary for Soto del Barco
- The typical guest profile for Airbnb in Soto del Barco consists of primarily domestic travelers (71%), often arriving from nearby Madrid, typically belonging to the Post-2000s (Gen Z/Alpha) group (50%), primarily speaking Spanish or English.
- Domestic travelers account for 70.9% of guests.
- Key international markets include Spain (70.9%) and France (9.5%).
- Top languages spoken are Spanish (36.9%) followed by English (32.8%).
- A significant demographic segment is the Post-2000s (Gen Z/Alpha) group, representing 50% of guests.
Recommendations for Hosts
- Target domestic marketing efforts towards travelers from Madrid and León.
- Tailor amenities and listing descriptions to appeal to the dominant Post-2000s (Gen Z/Alpha) demographic (e.g., highlight fast WiFi, smart home features, local guides).
- Highlight unique local experiences or amenities relevant to the primary guest profile.
- Consider seasonal promotions aligned with peak travel times for key origin markets.
Nearby Short-Term Rental Market Comparison
How does the Soto del Barco Airbnb market stack up against its neighbors? Compare key performance metrics like average monthly revenue, ADR, and occupancy rates in surrounding areas to understand the broader regional STR landscape.
| Market | Active Properties | Monthly Revenue | Daily Rate | Avg. Occupancy |
|---|---|---|---|---|
| Llanera | 14 | $2,037 | $274.76 | 39% |
| Portomarín | 12 | $2,006 | $181.90 | 49% |
| Villaviciosa | 242 | $1,399 | $196.93 | 36% |
| O Saviñao | 24 | $1,286 | $174.07 | 30% |
| San Andrés del Rabanedo | 12 | $1,281 | $155.26 | 34% |
| Palas de Rei | 19 | $1,279 | $142.71 | 43% |
| Gijón | 1,258 | $1,256 | $148.44 | 39% |
| Candamo | 19 | $1,250 | $210.81 | 30% |
| Riaño | 10 | $1,224 | $160.31 | 36% |
| Samos | 11 | $1,206 | $189.22 | 30% |