Teverga Airbnb Market Analysis 2026: Short Term Rental Data & Vacation Rental Statistics in Principado de Asturias, Spain
Is Airbnb profitable in Teverga in 2026? Explore comprehensive Airbnb analytics for Teverga, Principado de Asturias, Spain to uncover income potential. This 2026 STR market report for Teverga, based on AirROI data from February 2025 to January 2026, reveals key trends in the niche market of 19 active listings.
Whether you're considering an Airbnb investment in Teverga, optimizing your existing vacation rental, or exploring rental arbitrage opportunities, understanding the Teverga Airbnb data is crucial. Navigating the high regulation landscape is key to maximizing your short term rental income potential. Let's dive into the specifics.
Key Teverga Airbnb Performance Metrics Overview
Monthly Airbnb Revenue Variations & Income Potential in Teverga (2026)
Understanding the monthly revenue variations for Airbnb listings in Teverga is key to maximizing your short term rental income potential. Seasonality significantly impacts earnings. Our analysis, based on data from the past 12 months, shows that the peak revenue month for STRs in Teverga is typically August, while October often presents the lowest earnings, highlighting opportunities for strategic pricing adjustments during shoulder and low seasons. Explore the typical Airbnb income in Teverga across different performance tiers:
- Best-in-class properties (Top 10%) achieve $2,319+ monthly, often utilizing dynamic pricing and superior guest experiences.
- Strong performing properties (Top 25%) earn $1,633 or more, indicating effective management and desirable locations/amenities.
- Typical properties (Median) generate around $1,009 per month, representing the average market performance.
- Entry-level properties (Bottom 25%) see earnings around $497, often with potential for optimization.
Average Monthly Airbnb Earnings Trend in Teverga
Teverga Airbnb Occupancy Rate Trends (2026)
Maximize your bookings by understanding the Teverga STR occupancy trends. Seasonal demand shifts significantly influence how often properties are booked. Typically, Augustsees the highest demand (peak season occupancy), while January experiences the lowest (low season). Effective strategies, like adjusting minimum stays or offering promotions, can boost occupancy during slower periods. Here's how different property tiers perform in Teverga:
- Best-in-class properties (Top 10%) achieve 55%+ occupancy, indicating high desirability and potentially optimized availability.
- Strong performing properties (Top 25%) maintain 37% or higher occupancy, suggesting good market fit and guest satisfaction.
- Typical properties (Median) have an occupancy rate around 24%.
- Entry-level properties (Bottom 25%) average 13% occupancy, potentially facing higher vacancy.
Average Monthly Occupancy Rate Trend in Teverga
Average Daily Rate (ADR) Airbnb Trends in Teverga (2026)
Effective short term rental pricing strategy in Teverga involves understanding monthly ADR fluctuations. The Average Daily Rate (ADR) for Airbnb in Teverga typically peaks in August and dips lowest during November. Leveraging Airbnb dynamic pricing tools or strategies based on this seasonality can significantly boost revenue. Here's a look at the typical nightly rates achieved:
- Best-in-class properties (Top 10%) command rates of $211+ per night, often due to premium features or locations.
- Strong performing properties (Top 25%) achieve nightly rates of $177 or more.
- Typical properties (Median) charge around $150 per night.
- Entry-level properties (Bottom 25%) earn around $104 per night.
Average Daily Rate (ADR) Trend by Month in Teverga
Get Live Teverga Market Intelligence 👇
Explore Real-time Analytics
Airbnb Seasonality Analysis & Trends in Teverga (2026)
Peak Season (August, July, March)
- Revenue averages $2,119 per month
- Occupancy rates average 44.6%
- Daily rates average $170
Shoulder Season
- Revenue averages $1,019 per month
- Occupancy maintains around 23.2%
- Daily rates hold near $164
Low Season (January, October, November)
- Revenue drops to average $760 per month
- Occupancy decreases to average 20.2%
- Daily rates adjust to average $158
Seasonality Insights for Teverga
- The Airbnb seasonality in Teverga shows highly seasonal trends requiring careful strategy. While the sections above show seasonal averages, it's also insightful to look at the extremes:
- During the high season, the absolute peak month showcases Teverga's highest earning potential, with monthly revenues capable of climbing to $3,010, occupancy reaching a high of 55.3%, and ADRs peaking at $178.
- Conversely, the slowest single month of the year, typically falling within the low season, marks the market's lowest point. In this month, revenue might dip to $719, occupancy could drop to 12.3%, and ADRs may adjust down to $155.
- Understanding both the seasonal averages and these monthly peaks and troughs in revenue, occupancy, and ADR is crucial for maximizing your Airbnb profit potential in Teverga.
Seasonal Strategies for Maximizing Profit
- Peak Season: Maximize revenue through premium pricing and potentially longer minimum stays. Ensure high availability.
- Low Season: Offer competitive pricing, special promotions (e.g., extended stay discounts), and flexible cancellation policies. Target off-season travelers like remote workers or budget-conscious guests.
- Shoulder Seasons: Implement dynamic pricing that balances peak and low rates. Target weekend travelers or specific events. Offer slightly more flexible terms than peak season.
- Regularly analyze your own performance against these Teverga seasonality benchmarks and adjust your pricing and availability strategy accordingly.
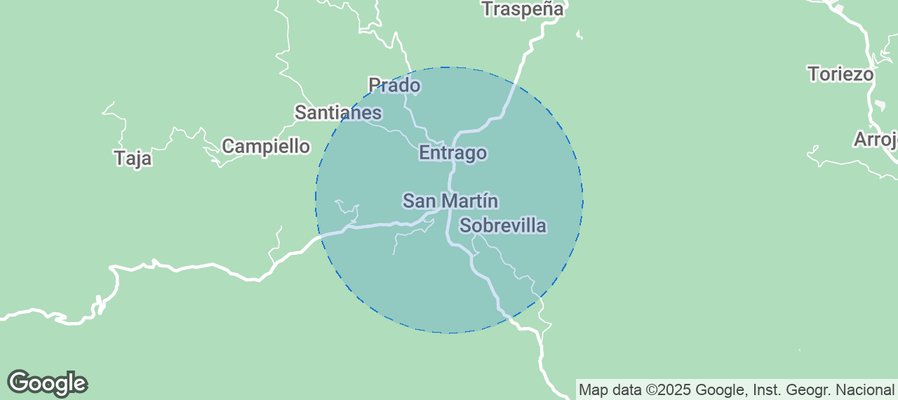
Best Areas for Airbnb Investment in Teverga (2026)
Exploring the top neighborhoods for short-term rentals in Teverga? This section highlights key areas, outlining why they are attractive for hosts and guests, along with notable local attractions. Consider these locations based on your target guest profile and investment strategy.
| Neighborhood / Area | Why Host Here? (Target Guests & Appeal) | Key Attractions & Landmarks |
|---|---|---|
| Teverga Town Center | The heart of Teverga, where visitors can experience the local culture, architecture, and cuisine. It's a convenient location for guests wishing to explore nearby attractions. | Teverga Archaeological Museum, Church of Santa María, Cascada de Oneta, Local restaurants and cafes, Scenic walking trails |
| Natural Park of Las Ubiñas-La Mesa | A stunning natural area perfect for outdoor enthusiasts. Attracts nature lovers and offers opportunities for hiking, bird watching, and connecting with nature. | Hiking trails, Mountain scenery, Biodiversity, Wildlife observation, Picnic areas |
| San Salvador de Avilés | A nearby quaint village, ideal for those looking for a peaceful retreat. Guests can enjoy the charm of rural Asturias while being close to Teverga. | Rural architecture, Local artisan shops, Traditional Asturian cider houses, Natural trails |
| Valle de Teverga | Known for its breathtaking landscapes and rural experiences, this valley attracts visitors seeking tranquility and outdoor activities. | Scenic views, Cave of Cuevas de Foces, Agricultural tourism, Local festivals, Adventure sports |
| Bocamina de La Senda | A historical site reflecting the region's mining heritage, great for history buffs and those interested in cultural tourism. | Mining history tours, Interpretive hiking routes, Visitor center, Cultural events |
| Villanueva | A picturesque village that offers a genuine Asturian experience with its stunning scenery, ideal for families and couples looking for a peaceful escape. | Charming village atmosphere, Cultural heritage, Local cheese factory, Hiking options |
| Cueva Huerta | A fascinating cave system known for its geological formations, attracting adventure seekers and those interested in spelunking. | Cave exploring, Guided tours, Unique geological features, Photography opportunities |
| Teverga Valley | A tranquil valley that offers plenty of opportunities for relaxation and exploration, making it a perfect getaway for families and couples. | Rural landscapes, Countryside activities, Local festivals, Wildlife watching |
Understanding Airbnb License Requirements & STR Laws in Teverga (2026)
Yes, Teverga, Principado de Asturias, Spain enforces high STR regulations. Obtaining a license and ensuring compliance is almost certainly required according to current 2026 STR laws. Always verify the latest short term rental regulations and Airbnb license requirements directly with local government authorities for Teverga to ensure full compliance before hosting.
(Source: AirROI data, 2026, based on 74% licensed listings)
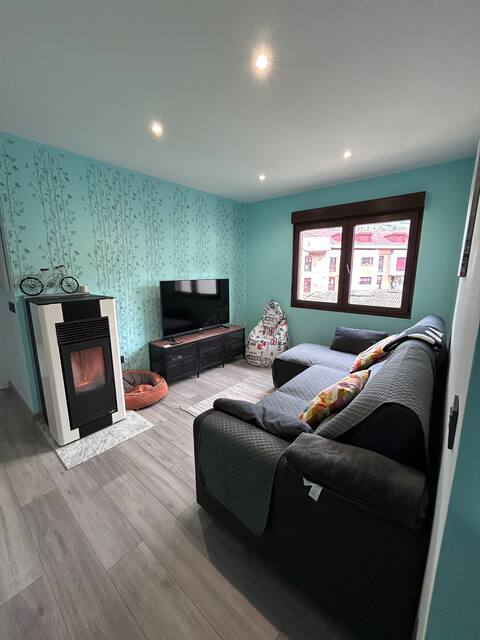
Top Performing Airbnb Properties in Teverga (2026)
Benchmark your potential! Explore examples of top-performing Airbnb properties in Tevergabased on Trailing Twelve Month (TTM) revenue. Analyze their characteristics, revenue, occupancy rate, and ADR to understand what drives success in this market.

La Casona de Alesga, Asturias-Fresnedo, Spain
Entire Place • 6 bedrooms

Country house at the foot of the Senda del Oso
Entire Place • 4 bedrooms

La Carrozal Senda del Oso, in the heart of the Natural Park
Entire Place • 2 bedrooms

Blanca (Xiblu) Rural Apartments
Entire Place • 1 bedroom
Apartment in San Martin
Entire Place • 3 bedrooms

La Congosta, a Jacuzzi in a village surrounded by mountains
Entire Place • 1 bedroom
Note: Performance varies based on location, size, amenities, seasonality, and management quality. Data reflects the past 12 months.
Top Performing Airbnb Hosts in Teverga (2026)
Learn from the best! This table showcases top-performing Airbnb hosts in Teverga based on the number of properties managed and estimated total revenue over the past year. Analyze their scale and performance metrics.
| Host Name | Properties | Grossing Revenue | Stay Reviews | Avg Rating |
|---|---|---|---|---|
| Mari Carmen | 3 | $41,768 | 32 | 4.58/5.0 |
| Raul Sanchez V. | 1 | $32,704 | 17 | 4.88/5.0 |
| Pilar | 3 | $24,084 | 32 | 4.93/5.0 |
| Daniel | 1 | $22,754 | 46 | 4.83/5.0 |
| Ana | 5 | $22,191 | 19 | 4.89/5.0 |
| Antonio | 1 | $12,456 | 8 | 5.00/5.0 |
| Pablo | 1 | $9,969 | 29 | 4.86/5.0 |
| Mary | 1 | $9,854 | 31 | 4.74/5.0 |
| Cecilia | 1 | $9,172 | 39 | 4.97/5.0 |
| Maria Dolores | 1 | $7,396 | 51 | 4.86/5.0 |
Analyzing the strategies of top hosts, such as their property selection, pricing, and guest communication, can offer valuable lessons for optimizing your own Airbnb operations in Teverga.
Dive Deeper: Advanced Teverga STR Market Data (2026)
Ready to unlock more insights? AirROI provides access to advanced metrics and comprehensive Airbnb data for Teverga. Explore detailed analytics beyond this report to refine your investment strategy, optimize pricing, and maximize your vacation rental profits.
Explore Advanced MetricsTeverga Short-Term Rental Market Composition (2026): Property & Room Types
Room Type Distribution
Property Type Distribution
Market Composition Insights for Teverga
- The Teverga Airbnb market composition is heavily skewed towards Entire Home/Apt listings, which make up 94.7% of the 19 active rentals. This indicates strong guest preference for privacy and space.
- Looking at the property type distribution in Teverga, Apartment/Condo properties are the most common (63.2%), reflecting the local real estate landscape.
- Houses represent a significant 31.6% portion, catering likely to families or larger groups.
- The presence of 5.3% Hotel/Boutique listings indicates integration with traditional hospitality.
Teverga Airbnb Room Capacity Analysis (2026): Bedroom Distribution
Distribution of Listings by Number of Bedrooms
Room Capacity Insights for Teverga
- The dominant room capacity in Teverga is 1 bedroom listings, making up 42.1% of the market. This suggests a strong demand for properties suitable for couples or solo travelers.
- Together, 1 bedroom and 2 bedrooms properties represent 73.7% of the active Airbnb listings in Teverga, indicating a high concentration in these sizes.
- A significant 26.4% of listings offer 3+ bedrooms, catering to larger groups and families seeking more space in Teverga.
Teverga Vacation Rental Guest Capacity Trends (2026)
Distribution of Listings by Guest Capacity
Guest Capacity Insights for Teverga
- The most common guest capacity trend in Teverga vacation rentals is listings accommodating 4 guests (31.6%). This suggests the primary traveler segment is likely small families or groups.
- Properties designed for 4 guests and 3 guests dominate the Teverga STR market, accounting for 52.7% of listings.
- 15.8% of properties accommodate 6+ guests, serving the market segment for larger families or group travel in Teverga.
- On average, properties in Teverga are equipped to host 4.2 guests.
Teverga Airbnb Booking Patterns (2026): Available vs. Booked Days
Available Days Distribution
Booked Days Distribution
Booking Pattern Insights for Teverga
- The most common availability pattern in Teverga falls within the 271-366 days range, representing 73.7% of listings. This suggests many properties have significant open periods on their calendars.
- Approximately 100.0% of listings show high availability (181+ days open annually), indicating potential for increased bookings or specific owner usage patterns.
- For booked days, the 31-90 days range is most frequent in Teverga (36.8%), reflecting common guest stay durations or potential owner blocking patterns.
Teverga Airbnb Minimum Stay Requirements Analysis
Distribution of Listings by Minimum Night Requirement
2 Nights
3 listings
15.8% of total
3 Nights
1 listings
5.3% of total
4-6 Nights
1 listings
5.3% of total
30+ Nights
14 listings
73.7% of total
Key Insights
- The most prevalent minimum stay requirement in Teverga is 30+ Nights, adopted by 73.7% of listings. This highlights the market's preference for longer commitments.
- Very short stays (1-2 nights) are less common (15.8%), suggesting hosts prefer slightly longer bookings to optimize turnover.
- A significant segment (73.7%) caters to monthly stays (30+ nights) in Teverga, pointing to opportunities in the extended-stay market.
Recommendations
- Align with the market by considering a 30+ Nights minimum stay, as 73.7% of Teverga hosts use this setting.
- Explore offering discounts for stays of 30+ nights to attract the 73.7% of the market seeking extended stays.
- Adjust minimum nights based on seasonality – potentially shorter during low season and longer during peak demand periods in Teverga.
Teverga Airbnb Cancellation Policy Trends Analysis (2026)
Flexible
1 listings
5.3% of total
Moderate
4 listings
21.1% of total
Firm
8 listings
42.1% of total
Strict
6 listings
31.6% of total
Cancellation Policy Insights for Teverga
- The prevailing Airbnb cancellation policy trend in Teverga is Firm, used by 42.1% of listings.
- A majority (73.7%) of hosts in Teverga utilize Firm or Strict policies, indicating a market where hosts prioritize booking security.
Recommendations for Hosts
- Consider adopting a Firm policy to align with the 42.1% market standard in Teverga.
- With 31.6% using Strict terms, this is a viable option in Teverga, particularly for high-value properties or during peak demand periods.
- Regularly review your cancellation policy against competitors and market demand shifts in Teverga.
Teverga STR Booking Lead Time Analysis (2026)
Average Booking Lead Time by Month
Booking Lead Time Insights for Teverga
- The overall average booking lead time for vacation rentals in Teverga is 53 days.
- Guests book furthest in advance for stays during August (average 104 days), likely coinciding with peak travel demand or local events.
- The shortest booking windows occur for stays in November (average 24 days), indicating more last-minute travel plans during this time.
- Seasonally, Summer (69 days avg.) sees the longest lead times, while Winter (41 days avg.) has the shortest, reflecting typical travel planning cycles.
Recommendations for Hosts
- Use the overall average lead time (53 days) as a baseline for your pricing and availability strategy in Teverga.
- For August stays, consider implementing length-of-stay discounts or slightly higher rates for bookings made less than 104 days out to capitalize on advance planning.
- Target marketing efforts for the Summer season well in advance (at least 69 days) to capture early planners.
- Monitor your own booking lead times against these Teverga averages to identify opportunities for dynamic pricing adjustments.
Popular & Essential Airbnb Amenities in Teverga (2026)
Amenity Prevalence
Amenity Insights for Teverga
- Essential amenities in Teverga that guests expect include: Wifi, TV, Fire extinguisher. Lacking these (any) could significantly impact bookings.
- Popular amenities like Heating, Essentials, Hair dryer are common but not universal. Offering these can provide a competitive edge.
Recommendations for Hosts
- Ensure your listing includes all essential amenities for Teverga: Wifi, TV, Fire extinguisher.
- Consider adding popular differentiators like Heating or Essentials to increase appeal.
- Highlight unique or less common amenities you offer (e.g., hot tub, dedicated workspace, EV charger) in your listing description and photos.
- Regularly check competitor amenities in Teverga to stay competitive.
Teverga Airbnb Guest Demographics & Profile Analysis (2026)
Guest Profile Summary for Teverga
- The typical guest profile for Airbnb in Teverga consists of a mix of domestic (59%) and international guests, often arriving from nearby Madrid, typically belonging to the Post-2000s (Gen Z/Alpha) group (50%), primarily speaking English or Spanish.
- Domestic travelers account for 59.0% of guests.
- Key international markets include Spain (59%) and Belgium (10.3%).
- Top languages spoken are English (35.7%) followed by Spanish (19%).
- A significant demographic segment is the Post-2000s (Gen Z/Alpha) group, representing 50% of guests.
Recommendations for Hosts
- Balance marketing efforts between domestic and international channels based on the guest mix.
- Tailor amenities and listing descriptions to appeal to the dominant Post-2000s (Gen Z/Alpha) demographic (e.g., highlight fast WiFi, smart home features, local guides).
- Highlight unique local experiences or amenities relevant to the primary guest profile.
- Consider seasonal promotions aligned with peak travel times for key origin markets.
Nearby Short-Term Rental Market Comparison
How does the Teverga Airbnb market stack up against its neighbors? Compare key performance metrics like average monthly revenue, ADR, and occupancy rates in surrounding areas to understand the broader regional STR landscape.
| Market | Active Properties | Monthly Revenue | Daily Rate | Avg. Occupancy |
|---|---|---|---|---|
| Llanera | 14 | $2,037 | $274.76 | 39% |
| Portomarín | 12 | $2,006 | $181.90 | 49% |
| Villaviciosa | 242 | $1,399 | $196.93 | 36% |
| O Saviñao | 24 | $1,286 | $174.07 | 30% |
| San Andrés del Rabanedo | 12 | $1,281 | $155.26 | 34% |
| Palas de Rei | 19 | $1,279 | $142.71 | 43% |
| Gijón | 1,258 | $1,256 | $148.44 | 39% |
| Candamo | 19 | $1,250 | $210.81 | 30% |
| Riaño | 10 | $1,224 | $160.31 | 36% |
| Samos | 11 | $1,206 | $189.22 | 30% |