Villaviciosa Airbnb Market Analysis 2026: Short Term Rental Data & Vacation Rental Statistics in Principado de Asturias, Spain
Is Airbnb profitable in Villaviciosa in 2026? Explore comprehensive Airbnb analytics for Villaviciosa, Principado de Asturias, Spain to uncover income potential. This 2026 STR market report for Villaviciosa, based on AirROI data from February 2025 to January 2026, reveals key trends in the market of 242 active listings.
Whether you're considering an Airbnb investment in Villaviciosa, optimizing your existing vacation rental, or exploring rental arbitrage opportunities, understanding the Villaviciosa Airbnb data is crucial. Navigating the high regulation landscape is key to maximizing your short term rental income potential. Let's dive into the specifics.
Key Villaviciosa Airbnb Performance Metrics Overview
Monthly Airbnb Revenue Variations & Income Potential in Villaviciosa (2026)
Understanding the monthly revenue variations for Airbnb listings in Villaviciosa is key to maximizing your short term rental income potential. Seasonality significantly impacts earnings. Our analysis, based on data from the past 12 months, shows that the peak revenue month for STRs in Villaviciosa is typically August, while January often presents the lowest earnings, highlighting opportunities for strategic pricing adjustments during shoulder and low seasons. Explore the typical Airbnb income in Villaviciosa across different performance tiers:
- Best-in-class properties (Top 10%) achieve $4,633+ monthly, often utilizing dynamic pricing and superior guest experiences.
- Strong performing properties (Top 25%) earn $2,638 or more, indicating effective management and desirable locations/amenities.
- Typical properties (Median) generate around $1,533 per month, representing the average market performance.
- Entry-level properties (Bottom 25%) see earnings around $813, often with potential for optimization.
Average Monthly Airbnb Earnings Trend in Villaviciosa
Villaviciosa Airbnb Occupancy Rate Trends (2026)
Maximize your bookings by understanding the Villaviciosa STR occupancy trends. Seasonal demand shifts significantly influence how often properties are booked. Typically, Augustsees the highest demand (peak season occupancy), while January experiences the lowest (low season). Effective strategies, like adjusting minimum stays or offering promotions, can boost occupancy during slower periods. Here's how different property tiers perform in Villaviciosa:
- Best-in-class properties (Top 10%) achieve 69%+ occupancy, indicating high desirability and potentially optimized availability.
- Strong performing properties (Top 25%) maintain 50% or higher occupancy, suggesting good market fit and guest satisfaction.
- Typical properties (Median) have an occupancy rate around 31%.
- Entry-level properties (Bottom 25%) average 17% occupancy, potentially facing higher vacancy.
Average Monthly Occupancy Rate Trend in Villaviciosa
Average Daily Rate (ADR) Airbnb Trends in Villaviciosa (2026)
Effective short term rental pricing strategy in Villaviciosa involves understanding monthly ADR fluctuations. The Average Daily Rate (ADR) for Airbnb in Villaviciosa typically peaks in August and dips lowest during March. Leveraging Airbnb dynamic pricing tools or strategies based on this seasonality can significantly boost revenue. Here's a look at the typical nightly rates achieved:
- Best-in-class properties (Top 10%) command rates of $372+ per night, often due to premium features or locations.
- Strong performing properties (Top 25%) achieve nightly rates of $234 or more.
- Typical properties (Median) charge around $146 per night.
- Entry-level properties (Bottom 25%) earn around $109 per night.
Average Daily Rate (ADR) Trend by Month in Villaviciosa
Get Live Villaviciosa Market Intelligence 👇
Explore Real-time Analytics
Airbnb Seasonality Analysis & Trends in Villaviciosa (2026)
Peak Season (August, July, September)
- Revenue averages $3,714 per month
- Occupancy rates average 55.5%
- Daily rates average $209
Shoulder Season
- Revenue averages $1,730 per month
- Occupancy maintains around 30.4%
- Daily rates hold near $194
Low Season (January, February, May)
- Revenue drops to average $1,343 per month
- Occupancy decreases to average 25.1%
- Daily rates adjust to average $192
Seasonality Insights for Villaviciosa
- The Airbnb seasonality in Villaviciosa shows highly seasonal trends requiring careful strategy. While the sections above show seasonal averages, it's also insightful to look at the extremes:
- During the high season, the absolute peak month showcases Villaviciosa's highest earning potential, with monthly revenues capable of climbing to $4,864, occupancy reaching a high of 69.3%, and ADRs peaking at $216.
- Conversely, the slowest single month of the year, typically falling within the low season, marks the market's lowest point. In this month, revenue might dip to $1,239, occupancy could drop to 19.7%, and ADRs may adjust down to $183.
- Understanding both the seasonal averages and these monthly peaks and troughs in revenue, occupancy, and ADR is crucial for maximizing your Airbnb profit potential in Villaviciosa.
Seasonal Strategies for Maximizing Profit
- Peak Season: Maximize revenue through premium pricing and potentially longer minimum stays. Ensure high availability.
- Low Season: Offer competitive pricing, special promotions (e.g., extended stay discounts), and flexible cancellation policies. Target off-season travelers like remote workers or budget-conscious guests.
- Shoulder Seasons: Implement dynamic pricing that balances peak and low rates. Target weekend travelers or specific events. Offer slightly more flexible terms than peak season.
- Regularly analyze your own performance against these Villaviciosa seasonality benchmarks and adjust your pricing and availability strategy accordingly.
Best Areas for Airbnb Investment in Villaviciosa (2026)
Exploring the top neighborhoods for short-term rentals in Villaviciosa? This section highlights key areas, outlining why they are attractive for hosts and guests, along with notable local attractions. Consider these locations based on your target guest profile and investment strategy.
| Neighborhood / Area | Why Host Here? (Target Guests & Appeal) | Key Attractions & Landmarks |
|---|---|---|
| Villaviciosa Town Center | The heart of Villaviciosa, with easy access to shops, restaurants, and historical sites. Ideal for guests wanting to experience local culture and cuisine. | Church of Santa Maria, Local markets, Cider houses, Main square, Villaviciosa River |
| Quinta de Nia | A peaceful rural area with stunning natural scenery. Great for nature lovers and those looking for a quiet getaway, with options for hiking and exploring the outdoors. | Natural parks, Scenic walks, Local farms, Countryside views |
| Tazones | A picturesque coastal village known for its beautiful seafront and traditional architecture. Attracts beachgoers and those interested in seafood gastronomy. | Tazones Beach, Traditional restaurants, Fishing harbor, Cultural festivals |
| La ruta de la sidra | An area famous for Asturias' cider culture. Offers visitors the chance to explore cider houses and enjoy local tastings. | Cider houses, Cider museums, Scenic rural drives, Local festivals |
| El Gaitero | A renowned local destination for tasting traditional Asturian cider. Popular among tourists who want to learn about local beverages and customs. | Cider tasting, Cultural workshops, Asturian gastronomy, Local history |
| Ria de Villaviciosa | A natural reserve that showcases the area's rich biodiversity. Ideal for outdoor activities like bird watching and kayaking. | Wildlife watching, Kayaking tours, Scenic viewpoints, Nature trails |
| San Justo Beach | A nearby beach known for its tranquil waters and beautiful surroundings. Perfect for sunbathers and water sports enthusiasts. | Beach activities, Relaxation spots, Coastal trails, Sunset views |
| Biofábrica de La Rasa | An innovative project focused on sustainable farming and education. Ideal for eco-tourists interested in sustainability. | Sustainable farming tours, Local produce markets, Workshops on sustainability |
Understanding Airbnb License Requirements & STR Laws in Villaviciosa (2026)
Yes, Villaviciosa, Principado de Asturias, Spain enforces high STR regulations. Obtaining a license and ensuring compliance is almost certainly required according to current 2026 STR laws. Always verify the latest short term rental regulations and Airbnb license requirements directly with local government authorities for Villaviciosa to ensure full compliance before hosting.
(Source: AirROI data, 2026, based on 79% licensed listings)
Top Performing Airbnb Properties in Villaviciosa (2026)
Benchmark your potential! Explore examples of top-performing Airbnb properties in Villaviciosabased on Trailing Twelve Month (TTM) revenue. Analyze their characteristics, revenue, occupancy rate, and ADR to understand what drives success in this market.

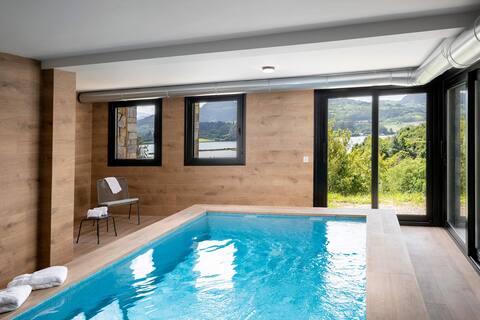
Luxury house in Asturias with amazing sea view
Entire Place • 3 bedrooms

La Llosuca Rural - Beautiful Stone Manor
Entire Place • 6 bedrooms
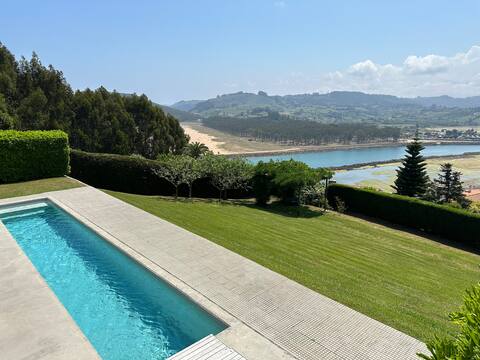
Luxury house in Asturias. San Martin del Mar
Entire Place • 5 bedrooms
Quail
Entire Place • 6 bedrooms
Luxurious villa with a pool.
Entire Place • 6 bedrooms

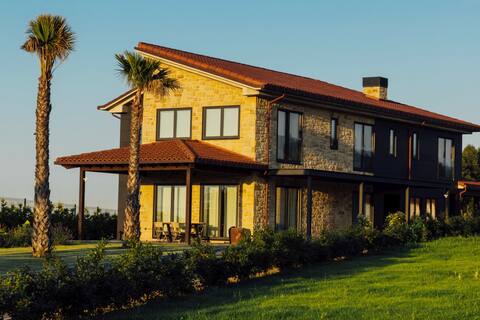
Finca Canal - Private Villa
Entire Place • 7 bedrooms
Note: Performance varies based on location, size, amenities, seasonality, and management quality. Data reflects the past 12 months.
Top Performing Airbnb Hosts in Villaviciosa (2026)
Learn from the best! This table showcases top-performing Airbnb hosts in Villaviciosa based on the number of properties managed and estimated total revenue over the past year. Analyze their scale and performance metrics.
| Host Name | Properties | Grossing Revenue | Stay Reviews | Avg Rating |
|---|---|---|---|---|
| Margemar Alquileres Turísticos | 6 | $193,107 | 125 | 4.54/5.0 |
| Merly | 2 | $136,284 | 28 | 5.00/5.0 |
| Dani | 3 | $118,952 | 357 | 4.94/5.0 |
| Go | 1 | $108,327 | 53 | 4.98/5.0 |
| El Faro Unkempt | 5 | $103,629 | 66 | 4.53/5.0 |
| Elena | 1 | $100,223 | 24 | 4.83/5.0 |
| Casa Armero Pon Tu Casa A Trab | 2 | $91,168 | 9 | 5.00/5.0 |
| Angel | 2 | $84,838 | 3 | Not Rated |
| Javier | 5 | $77,783 | 152 | 4.93/5.0 |
| Finca Canal | 1 | $68,808 | 33 | 4.94/5.0 |
Analyzing the strategies of top hosts, such as their property selection, pricing, and guest communication, can offer valuable lessons for optimizing your own Airbnb operations in Villaviciosa.
Dive Deeper: Advanced Villaviciosa STR Market Data (2026)
Ready to unlock more insights? AirROI provides access to advanced metrics and comprehensive Airbnb data for Villaviciosa. Explore detailed analytics beyond this report to refine your investment strategy, optimize pricing, and maximize your vacation rental profits.
Explore Advanced MetricsVillaviciosa Short-Term Rental Market Composition (2026): Property & Room Types
Room Type Distribution
Property Type Distribution
Market Composition Insights for Villaviciosa
- The Villaviciosa Airbnb market composition is heavily skewed towards Entire Home/Apt listings, which make up 96.7% of the 242 active rentals. This indicates strong guest preference for privacy and space.
- Looking at the property type distribution in Villaviciosa, House properties are the most common (49.6%), reflecting the local real estate landscape.
- Houses represent a significant 49.6% portion, catering likely to families or larger groups.
- Smaller segments like hotel/boutique, outdoor/unique, others (combined 3.7%) offer potential for unique stay experiences.
Villaviciosa Airbnb Room Capacity Analysis (2026): Bedroom Distribution
Distribution of Listings by Number of Bedrooms
Room Capacity Insights for Villaviciosa
- The dominant room capacity in Villaviciosa is 2 bedrooms listings, making up 38% of the market. This suggests a strong demand for properties suitable for couples or solo travelers.
- Together, 2 bedrooms and 1 bedroom properties represent 62.0% of the active Airbnb listings in Villaviciosa, indicating a high concentration in these sizes.
- A significant 37.2% of listings offer 3+ bedrooms, catering to larger groups and families seeking more space in Villaviciosa.
Villaviciosa Vacation Rental Guest Capacity Trends (2026)
Distribution of Listings by Guest Capacity
Guest Capacity Insights for Villaviciosa
- The most common guest capacity trend in Villaviciosa vacation rentals is listings accommodating 4 guests (31%). This suggests the primary traveler segment is likely small families or groups.
- Properties designed for 4 guests and 8+ guests dominate the Villaviciosa STR market, accounting for 50.8% of listings.
- 37.2% of properties accommodate 6+ guests, serving the market segment for larger families or group travel in Villaviciosa.
- On average, properties in Villaviciosa are equipped to host 5.0 guests.
Villaviciosa Airbnb Booking Patterns (2026): Available vs. Booked Days
Available Days Distribution
Booked Days Distribution
Booking Pattern Insights for Villaviciosa
- The most common availability pattern in Villaviciosa falls within the 271-366 days range, representing 63.2% of listings. This suggests many properties have significant open periods on their calendars.
- Approximately 90.9% of listings show high availability (181+ days open annually), indicating potential for increased bookings or specific owner usage patterns.
- For booked days, the 31-90 days range is most frequent in Villaviciosa (37.2%), reflecting common guest stay durations or potential owner blocking patterns.
- A notable 9.9% of properties secure long booking periods (181+ days booked per year), highlighting successful long-term rental strategies or significant owner usage.
Villaviciosa Airbnb Minimum Stay Requirements Analysis
Distribution of Listings by Minimum Night Requirement
1 Night
7 listings
2.9% of total
2 Nights
44 listings
18.2% of total
3 Nights
20 listings
8.3% of total
4-6 Nights
28 listings
11.6% of total
7-29 Nights
6 listings
2.5% of total
30+ Nights
137 listings
56.6% of total
Key Insights
- The most prevalent minimum stay requirement in Villaviciosa is 30+ Nights, adopted by 56.6% of listings. This highlights the market's preference for longer commitments.
- A significant segment (56.6%) caters to monthly stays (30+ nights) in Villaviciosa, pointing to opportunities in the extended-stay market.
Recommendations
- Align with the market by considering a 30+ Nights minimum stay, as 56.6% of Villaviciosa hosts use this setting.
- If feasible, allowing 1-night stays, especially midweek or during low season, could capture last-minute bookings, as only 2.9% currently do.
- Explore offering discounts for stays of 30+ nights to attract the 56.6% of the market seeking extended stays.
- Adjust minimum nights based on seasonality – potentially shorter during low season and longer during peak demand periods in Villaviciosa.
Villaviciosa Airbnb Cancellation Policy Trends Analysis (2026)
Limited
7 listings
2.9% of total
Super Strict 60 Days
2 listings
0.8% of total
Flexible
32 listings
13.3% of total
Moderate
63 listings
26.1% of total
Firm
101 listings
41.9% of total
Strict
36 listings
14.9% of total
Cancellation Policy Insights for Villaviciosa
- The prevailing Airbnb cancellation policy trend in Villaviciosa is Firm, used by 41.9% of listings.
- A majority (56.8%) of hosts in Villaviciosa utilize Firm or Strict policies, indicating a market where hosts prioritize booking security.
Recommendations for Hosts
- Consider adopting a Firm policy to align with the 41.9% market standard in Villaviciosa.
- Using a Strict policy might deter some guests, as only 14.9% of listings use it. Evaluate if potential revenue protection outweighs possible lower booking rates.
- Regularly review your cancellation policy against competitors and market demand shifts in Villaviciosa.
Villaviciosa STR Booking Lead Time Analysis (2026)
Average Booking Lead Time by Month
Booking Lead Time Insights for Villaviciosa
- The overall average booking lead time for vacation rentals in Villaviciosa is 59 days.
- Guests book furthest in advance for stays during August (average 113 days), likely coinciding with peak travel demand or local events.
- The shortest booking windows occur for stays in February (average 17 days), indicating more last-minute travel plans during this time.
- Seasonally, Summer (80 days avg.) sees the longest lead times, while Winter (38 days avg.) has the shortest, reflecting typical travel planning cycles.
Recommendations for Hosts
- Use the overall average lead time (59 days) as a baseline for your pricing and availability strategy in Villaviciosa.
- For August stays, consider implementing length-of-stay discounts or slightly higher rates for bookings made less than 113 days out to capitalize on advance planning.
- Target marketing efforts for the Summer season well in advance (at least 80 days) to capture early planners.
- Monitor your own booking lead times against these Villaviciosa averages to identify opportunities for dynamic pricing adjustments.
Popular & Essential Airbnb Amenities in Villaviciosa (2026)
Amenity Prevalence
Amenity Insights for Villaviciosa
- Essential amenities in Villaviciosa that guests expect include: TV. Lacking these (this) could significantly impact bookings.
- Popular amenities like Kitchen, Washer, Hangers are common but not universal. Offering these can provide a competitive edge.
Recommendations for Hosts
- Ensure your listing includes all essential amenities for Villaviciosa: TV.
- Prioritize adding missing essentials: TV.
- Consider adding popular differentiators like Kitchen or Washer to increase appeal.
- Highlight unique or less common amenities you offer (e.g., hot tub, dedicated workspace, EV charger) in your listing description and photos.
- Regularly check competitor amenities in Villaviciosa to stay competitive.
Villaviciosa Airbnb Guest Demographics & Profile Analysis (2026)
Guest Profile Summary for Villaviciosa
- The typical guest profile for Airbnb in Villaviciosa consists of a mix of domestic (62%) and international guests, often arriving from nearby Madrid, typically belonging to the Post-2000s (Gen Z/Alpha) group (50%), primarily speaking English or Spanish.
- Domestic travelers account for 61.7% of guests.
- Key international markets include Spain (61.7%) and France (9.4%).
- Top languages spoken are English (34.8%) followed by Spanish (31.4%).
- A significant demographic segment is the Post-2000s (Gen Z/Alpha) group, representing 50% of guests.
Recommendations for Hosts
- Target domestic marketing efforts towards travelers from Madrid and Barcelona.
- Tailor amenities and listing descriptions to appeal to the dominant Post-2000s (Gen Z/Alpha) demographic (e.g., highlight fast WiFi, smart home features, local guides).
- Highlight unique local experiences or amenities relevant to the primary guest profile.
- Consider seasonal promotions aligned with peak travel times for key origin markets.
Nearby Short-Term Rental Market Comparison
How does the Villaviciosa Airbnb market stack up against its neighbors? Compare key performance metrics like average monthly revenue, ADR, and occupancy rates in surrounding areas to understand the broader regional STR landscape.
| Market | Active Properties | Monthly Revenue | Daily Rate | Avg. Occupancy |
|---|---|---|---|---|
| Hermandad de Campoo de Suso | 30 | $2,144 | $393.46 | 24% |
| Llanera | 14 | $2,037 | $274.76 | 39% |
| Camaleño | 96 | $1,417 | $146.42 | 42% |
| Reocín | 41 | $1,406 | $238.07 | 38% |
| Mazcuerras | 22 | $1,403 | $214.82 | 29% |
| Molledo | 15 | $1,373 | $219.83 | 30% |
| Potes | 72 | $1,307 | $140.84 | 38% |
| Alfoz de Lloredo | 74 | $1,286 | $207.68 | 34% |
| Suances | 231 | $1,282 | $190.90 | 36% |
| San Andrés del Rabanedo | 12 | $1,281 | $155.26 | 34% |