Fortuna Airbnb Market Analysis 2026: Short Term Rental Data & Vacation Rental Statistics in Region of Murcia, Spain
Is Airbnb profitable in Fortuna in 2026? Explore comprehensive Airbnb analytics for Fortuna, Region of Murcia, Spain to uncover income potential. This 2026 STR market report for Fortuna, based on AirROI data from February 2025 to January 2026, reveals key trends in the niche market of 36 active listings.
Whether you're considering an Airbnb investment in Fortuna, optimizing your existing vacation rental, or exploring rental arbitrage opportunities, understanding the Fortuna Airbnb data is crucial. Navigating the high regulation landscape is key to maximizing your short term rental income potential. Let's dive into the specifics.
Key Fortuna Airbnb Performance Metrics Overview
Monthly Airbnb Revenue Variations & Income Potential in Fortuna (2026)
Understanding the monthly revenue variations for Airbnb listings in Fortuna is key to maximizing your short term rental income potential. Seasonality significantly impacts earnings. Our analysis, based on data from the past 12 months, shows that the peak revenue month for STRs in Fortuna is typically August, while May often presents the lowest earnings, highlighting opportunities for strategic pricing adjustments during shoulder and low seasons. Explore the typical Airbnb income in Fortuna across different performance tiers:
- Best-in-class properties (Top 10%) achieve $5,898+ monthly, often utilizing dynamic pricing and superior guest experiences.
- Strong performing properties (Top 25%) earn $2,913 or more, indicating effective management and desirable locations/amenities.
- Typical properties (Median) generate around $1,477 per month, representing the average market performance.
- Entry-level properties (Bottom 25%) see earnings around $637, often with potential for optimization.
Average Monthly Airbnb Earnings Trend in Fortuna
Fortuna Airbnb Occupancy Rate Trends (2026)
Maximize your bookings by understanding the Fortuna STR occupancy trends. Seasonal demand shifts significantly influence how often properties are booked. Typically, Augustsees the highest demand (peak season occupancy), while May experiences the lowest (low season). Effective strategies, like adjusting minimum stays or offering promotions, can boost occupancy during slower periods. Here's how different property tiers perform in Fortuna:
- Best-in-class properties (Top 10%) achieve 70%+ occupancy, indicating high desirability and potentially optimized availability.
- Strong performing properties (Top 25%) maintain 53% or higher occupancy, suggesting good market fit and guest satisfaction.
- Typical properties (Median) have an occupancy rate around 33%.
- Entry-level properties (Bottom 25%) average 16% occupancy, potentially facing higher vacancy.
Average Monthly Occupancy Rate Trend in Fortuna
Average Daily Rate (ADR) Airbnb Trends in Fortuna (2026)
Effective short term rental pricing strategy in Fortuna involves understanding monthly ADR fluctuations. The Average Daily Rate (ADR) for Airbnb in Fortuna typically peaks in August and dips lowest during February. Leveraging Airbnb dynamic pricing tools or strategies based on this seasonality can significantly boost revenue. Here's a look at the typical nightly rates achieved:
- Best-in-class properties (Top 10%) command rates of $372+ per night, often due to premium features or locations.
- Strong performing properties (Top 25%) achieve nightly rates of $246 or more.
- Typical properties (Median) charge around $147 per night.
- Entry-level properties (Bottom 25%) earn around $99 per night.
Average Daily Rate (ADR) Trend by Month in Fortuna
Get Live Fortuna Market Intelligence 👇

Explore Real-time Analytics
Airbnb Seasonality Analysis & Trends in Fortuna (2026)
Peak Season (August, July, November)
- Revenue averages $3,211 per month
- Occupancy rates average 43.2%
- Daily rates average $194
Shoulder Season
- Revenue averages $2,243 per month
- Occupancy maintains around 38.9%
- Daily rates hold near $184
Low Season (January, May, June)
- Revenue drops to average $1,823 per month
- Occupancy decreases to average 26.7%
- Daily rates adjust to average $189
Seasonality Insights for Fortuna
- The Airbnb seasonality in Fortuna shows highly seasonal trends requiring careful strategy. While the sections above show seasonal averages, it's also insightful to look at the extremes:
- During the high season, the absolute peak month showcases Fortuna's highest earning potential, with monthly revenues capable of climbing to $3,835, occupancy reaching a high of 47.4%, and ADRs peaking at $200.
- Conversely, the slowest single month of the year, typically falling within the low season, marks the market's lowest point. In this month, revenue might dip to $1,619, occupancy could drop to 25.7%, and ADRs may adjust down to $174.
- Understanding both the seasonal averages and these monthly peaks and troughs in revenue, occupancy, and ADR is crucial for maximizing your Airbnb profit potential in Fortuna.
Seasonal Strategies for Maximizing Profit
- Peak Season: Maximize revenue through premium pricing and potentially longer minimum stays. Ensure high availability.
- Low Season: Offer competitive pricing, special promotions (e.g., extended stay discounts), and flexible cancellation policies. Target off-season travelers like remote workers or budget-conscious guests.
- Shoulder Seasons: Implement dynamic pricing that balances peak and low rates. Target weekend travelers or specific events. Offer slightly more flexible terms than peak season.
- Regularly analyze your own performance against these Fortuna seasonality benchmarks and adjust your pricing and availability strategy accordingly.
Best Areas for Airbnb Investment in Fortuna (2026)
Exploring the top neighborhoods for short-term rentals in Fortuna? This section highlights key areas, outlining why they are attractive for hosts and guests, along with notable local attractions. Consider these locations based on your target guest profile and investment strategy.
| Neighborhood / Area | Why Host Here? (Target Guests & Appeal) | Key Attractions & Landmarks |
|---|---|---|
| Cartagena | A historic port city with beautiful architecture and rich maritime history. It's a popular destination for tourists who want to explore ancient Roman sites and enjoy the coastal views. | Cartagena's Roman Theatre, Castillo de la Concepción, Museo Nacional de Arqueología Subacuática, Playa de la Concha, La Mar de Músicas festival |
| Murcia City | The vibrant capital of the Region of Murcia, known for its stunning cathedral and lively cultural scene. A great location for both leisure and business travelers with plenty of amenities. | Cathedral of Murcia, Casino de Murcia, Real Casino de Murcia, Museo de Bellas Artes de Murcia, Jardín de Floridablanca |
| Mazarrón | Known for its beautiful beaches and landscapes, Mazarrón offers a relaxed coastal environment. Attracts beachgoers and those looking for outdoor activities. | Playa de Bolnuevo, Mazarrón Port, Mazarrón Circuit, Cabo Tiñoso Natural Park, Punta de Algas |
| Águilas | A stunning beach town with a mix of beautiful shorelines and historical sites. Popular for summer vacations and water sports enthusiasts. | Águilas Castle, El Hornillo Beach, Calabardina Beach, La Casica Verde, Carnival of Águilas |
| San Javier | Home to the famous La Manga strip and beautiful beaches, San Javier is a popular summer destination for Spaniards and tourists alike. | La Manga del Mar Menor, Mar Menor, San Javier Airport, Cabo de Palos, Playa de la Mota |
| Lorca | A historic city known for its medieval castle and baroque architecture. It attracts visitors interested in history and culture. | Lorca Castle, Iglesia de San Francisco, Museo de Bordados, Centro de Interpretación de Lorca, Plaza de España |
| Elche | Famous for its palm groves and the UNESCO-listed Mystery Play of Elche, it draws visitors interested in cultural events and natural beauty. | Palm Grove of Elche, Elche's Historic Centre, Basilica de Santa María, Huerto del Cura, Elche Mystery Play |
| Cieza | Known for the Segura River and natural parks, Cieza is ideal for nature lovers and those seeking a peaceful getaway retreat. | Cueva de la Serreta, Cieza's Natural Park, Río Segura, Cieza Railway Station, Semana Santa de Cieza |
Understanding Airbnb License Requirements & STR Laws in Fortuna (2026)
Yes, Fortuna, Region of Murcia, Spain enforces high STR regulations. Obtaining a license and ensuring compliance is almost certainly required according to current 2026 STR laws. Always verify the latest short term rental regulations and Airbnb license requirements directly with local government authorities for Fortuna to ensure full compliance before hosting.
(Source: AirROI data, 2026, based on 58% licensed listings)
Top Performing Airbnb Properties in Fortuna (2026)
Benchmark your potential! Explore examples of top-performing Airbnb properties in Fortunabased on Trailing Twelve Month (TTM) revenue. Analyze their characteristics, revenue, occupancy rate, and ADR to understand what drives success in this market.
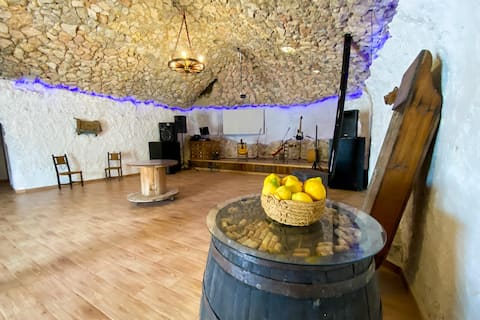
Cave accommodation for groups with an event room
Entire Place • 5 bedrooms
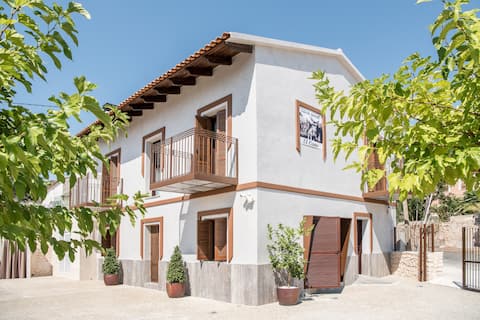
El Cano Rural House
Entire Place • 6 bedrooms
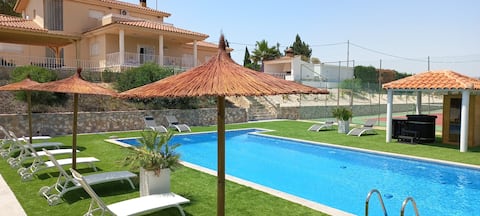
Paradise Spain, Murcia Tennis court, 12m Pool
Entire Place • 7 bedrooms

Villa 3 Soles
Entire Place • 4 bedrooms

A rural house in Caprés with mountain views
Entire Place • 4 bedrooms

Modern Villa in Murcia Province
Entire Place • 2 bedrooms
Note: Performance varies based on location, size, amenities, seasonality, and management quality. Data reflects the past 12 months.
Top Performing Airbnb Hosts in Fortuna (2026)
Learn from the best! This table showcases top-performing Airbnb hosts in Fortuna based on the number of properties managed and estimated total revenue over the past year. Analyze their scale and performance metrics.
| Host Name | Properties | Grossing Revenue | Stay Reviews | Avg Rating |
|---|---|---|---|---|
| Inmaculada | 1 | $101,522 | 14 | 5.00/5.0 |
| Emi | 1 | $91,834 | 35 | 4.94/5.0 |
| Mark | 1 | $64,618 | 14 | 4.86/5.0 |
| Jesús Sälvador | 2 | $39,628 | 25 | 4.42/5.0 |
| Alex | 1 | $34,574 | 153 | 4.88/5.0 |
| Marie-Laure | 1 | $29,175 | 12 | 4.75/5.0 |
| Laura | 1 | $28,010 | 21 | 5.00/5.0 |
| Lesley | 1 | $25,373 | 8 | 5.00/5.0 |
| Jenny | 1 | $23,488 | 56 | 4.86/5.0 |
| Samantha & Yohan | 1 | $22,190 | 81 | 4.88/5.0 |
Analyzing the strategies of top hosts, such as their property selection, pricing, and guest communication, can offer valuable lessons for optimizing your own Airbnb operations in Fortuna.
Dive Deeper: Advanced Fortuna STR Market Data (2026)
Ready to unlock more insights? AirROI provides access to advanced metrics and comprehensive Airbnb data for Fortuna. Explore detailed analytics beyond this report to refine your investment strategy, optimize pricing, and maximize your vacation rental profits.
Explore Advanced MetricsFortuna Short-Term Rental Market Composition (2026): Property & Room Types
Room Type Distribution
Property Type Distribution
Market Composition Insights for Fortuna
- The Fortuna Airbnb market composition is heavily skewed towards Entire Home/Apt listings, which make up 86.1% of the 36 active rentals. This indicates strong guest preference for privacy and space.
- Looking at the property type distribution in Fortuna, House properties are the most common (52.8%), reflecting the local real estate landscape.
- Houses represent a significant 52.8% portion, catering likely to families or larger groups.
- The presence of 19.4% Hotel/Boutique listings indicates integration with traditional hospitality.
- Smaller segments like others (combined 2.8%) offer potential for unique stay experiences.
Fortuna Airbnb Room Capacity Analysis (2026): Bedroom Distribution
Distribution of Listings by Number of Bedrooms
Room Capacity Insights for Fortuna
- The dominant room capacity in Fortuna is 2 bedrooms listings, making up 30.6% of the market. This suggests a strong demand for properties suitable for couples or solo travelers.
- Together, 2 bedrooms and 5+ bedrooms properties represent 47.3% of the active Airbnb listings in Fortuna, indicating a high concentration in these sizes.
- A significant 47.3% of listings offer 3+ bedrooms, catering to larger groups and families seeking more space in Fortuna.
Fortuna Vacation Rental Guest Capacity Trends (2026)
Distribution of Listings by Guest Capacity
Guest Capacity Insights for Fortuna
- The most common guest capacity trend in Fortuna vacation rentals is listings accommodating 8+ guests (33.3%). This suggests the primary traveler segment is likely larger groups.
- Properties designed for 8+ guests and 4 guests dominate the Fortuna STR market, accounting for 63.9% of listings.
- 44.4% of properties accommodate 6+ guests, serving the market segment for larger families or group travel in Fortuna.
- On average, properties in Fortuna are equipped to host 5.1 guests.
Fortuna Airbnb Booking Patterns (2026): Available vs. Booked Days
Available Days Distribution
Booked Days Distribution
Booking Pattern Insights for Fortuna
- The most common availability pattern in Fortuna falls within the 271-366 days range, representing 61.1% of listings. This suggests many properties have significant open periods on their calendars.
- Approximately 86.1% of listings show high availability (181+ days open annually), indicating potential for increased bookings or specific owner usage patterns.
- For booked days, the 1-30 days range is most frequent in Fortuna (36.1%), reflecting common guest stay durations or potential owner blocking patterns.
- A notable 13.9% of properties secure long booking periods (181+ days booked per year), highlighting successful long-term rental strategies or significant owner usage.
Fortuna Airbnb Minimum Stay Requirements Analysis
Distribution of Listings by Minimum Night Requirement
1 Night
10 listings
27.8% of total
2 Nights
11 listings
30.6% of total
3 Nights
2 listings
5.6% of total
4-6 Nights
5 listings
13.9% of total
7-29 Nights
1 listings
2.8% of total
30+ Nights
7 listings
19.4% of total
Key Insights
- The most prevalent minimum stay requirement in Fortuna is 2 Nights, adopted by 30.6% of listings. This highlights the market's preference for shorter, flexible bookings.
- A significant segment (19.4%) caters to monthly stays (30+ nights) in Fortuna, pointing to opportunities in the extended-stay market.
Recommendations
- Align with the market by considering a 2 Nights minimum stay, as 30.6% of Fortuna hosts use this setting.
- If feasible, allowing 1-night stays, especially midweek or during low season, could capture last-minute bookings, as only 27.8% currently do.
- Explore offering discounts for stays of 30+ nights to attract the 19.4% of the market seeking extended stays.
- Adjust minimum nights based on seasonality – potentially shorter during low season and longer during peak demand periods in Fortuna.
Fortuna Airbnb Cancellation Policy Trends Analysis (2026)
Limited
1 listings
2.9% of total
Flexible
14 listings
40% of total
Moderate
7 listings
20% of total
Firm
11 listings
31.4% of total
Strict
2 listings
5.7% of total
Cancellation Policy Insights for Fortuna
- The prevailing Airbnb cancellation policy trend in Fortuna is Flexible, used by 40% of listings.
- There's a relatively balanced mix between guest-friendly (60.0%) and stricter (37.1%) policies, offering choices for different guest needs.
- Strict cancellation policies are quite rare (5.7%), potentially making listings with this policy less competitive unless justified by high demand or property type.
Recommendations for Hosts
- Consider adopting a Flexible policy to align with the 40% market standard in Fortuna.
- Using a Strict policy might deter some guests, as only 5.7% of listings use it. Evaluate if potential revenue protection outweighs possible lower booking rates.
- Regularly review your cancellation policy against competitors and market demand shifts in Fortuna.
Fortuna STR Booking Lead Time Analysis (2026)
Average Booking Lead Time by Month
Booking Lead Time Insights for Fortuna
- The overall average booking lead time for vacation rentals in Fortuna is 44 days.
- Guests book furthest in advance for stays during August (average 86 days), likely coinciding with peak travel demand or local events.
- The shortest booking windows occur for stays in March (average 19 days), indicating more last-minute travel plans during this time.
- Seasonally, Summer (59 days avg.) sees the longest lead times, while Spring (30 days avg.) has the shortest, reflecting typical travel planning cycles.
Recommendations for Hosts
- Use the overall average lead time (44 days) as a baseline for your pricing and availability strategy in Fortuna.
- For August stays, consider implementing length-of-stay discounts or slightly higher rates for bookings made less than 86 days out to capitalize on advance planning.
- Target marketing efforts for the Summer season well in advance (at least 59 days) to capture early planners.
- Monitor your own booking lead times against these Fortuna averages to identify opportunities for dynamic pricing adjustments.
Popular & Essential Airbnb Amenities in Fortuna (2026)
Amenity Prevalence
Amenity Insights for Fortuna
- Essential amenities in Fortuna that guests expect include: TV, Wifi. Lacking these (any) could significantly impact bookings.
- Popular amenities like Free parking on premises, Kitchen, Air conditioning are common but not universal. Offering these can provide a competitive edge.
- A pool is a highly desired but not standard amenity, making it a key feature for attracting guests seeking leisure in Fortuna.
Recommendations for Hosts
- Ensure your listing includes all essential amenities for Fortuna: TV, Wifi.
- Prioritize adding missing essentials: TV, Wifi.
- Consider adding popular differentiators like Free parking on premises or Kitchen to increase appeal.
- Highlight unique or less common amenities you offer (e.g., hot tub, dedicated workspace, EV charger) in your listing description and photos.
- Regularly check competitor amenities in Fortuna to stay competitive.
Fortuna Airbnb Guest Demographics & Profile Analysis (2026)
Guest Profile Summary for Fortuna
- The typical guest profile for Airbnb in Fortuna consists of a mix of domestic (48%) and international guests, with top international origins including France, typically belonging to the Post-2000s (Gen Z/Alpha) group (50%), primarily speaking English or Spanish.
- Domestic travelers account for 47.9% of guests.
- Key international markets include Spain (47.9%) and France (13.7%).
- Top languages spoken are English (36%) followed by Spanish (33.3%).
- A significant demographic segment is the Post-2000s (Gen Z/Alpha) group, representing 50% of guests.
Recommendations for Hosts
- Balance marketing efforts between domestic and international channels based on the guest mix.
- Tailor amenities and listing descriptions to appeal to the dominant Post-2000s (Gen Z/Alpha) demographic (e.g., highlight fast WiFi, smart home features, local guides).
- Highlight unique local experiences or amenities relevant to the primary guest profile.
- Consider seasonal promotions aligned with peak travel times for key origin markets.
Nearby Short-Term Rental Market Comparison
How does the Fortuna Airbnb market stack up against its neighbors? Compare key performance metrics like average monthly revenue, ADR, and occupancy rates in surrounding areas to understand the broader regional STR landscape.
| Market | Active Properties | Monthly Revenue | Daily Rate | Avg. Occupancy |
|---|---|---|---|---|
| Olocau | 10 | $3,229 | $460.93 | 36% |
| Corbera | 16 | $2,781 | $231.25 | 45% |
| Picassent | 16 | $2,618 | $274.61 | 43% |
| Macastre | 15 | $2,518 | $312.89 | 34% |
| Manises | 27 | $2,511 | $201.27 | 43% |
| l'Eliana | 32 | $2,454 | $314.51 | 40% |
| Alboraia / Alboraya | 244 | $2,297 | $201.35 | 47% |
| Catral | 14 | $2,222 | $220.78 | 40% |
| Bétera | 25 | $2,155 | $264.29 | 42% |
| la Pobla de Vallbona | 13 | $2,114 | $196.20 | 50% |