Salas Airbnb Market Analysis 2025: Short Term Rental Data & Vacation Rental Statistics in Salas, Spain
Is Airbnb profitable in Salas in 2025? Explore comprehensive Airbnb analytics for Salas, Salas, Spain to uncover income potential. This 2025 STR market report for Salas, based on AirROI data from May 2024 to April 2025, reveals key trends in the niche market of 27 active listings.
Whether you're considering an Airbnb investment in Salas, optimizing your existing vacation rental, or exploring rental arbitrage opportunities, understanding the Salas Airbnb data is crucial. Understanding the local regulations is key to maximizing your short term rental income potential. Let's dive into the specifics.
Key Salas Airbnb Performance Metrics Overview
Monthly Airbnb Revenue Variations & Income Potential in Salas (2025)
Understanding the monthly revenue variations for Airbnb listings in Salas is key to maximizing your short term rental income potential. Seasonality significantly impacts earnings. Our analysis, based on data from the past 12 months, shows that the peak revenue month for STRs in Salas is typically August, while March often presents the lowest earnings, highlighting opportunities for strategic pricing adjustments during shoulder and low seasons. Explore the typical Airbnb income in Salas across different performance tiers:
- Best-in-class properties (Top 10%) achieve $2,892+ monthly, often utilizing dynamic pricing and superior guest experiences.
- Strong performing properties (Top 25%) earn $1,707 or more, indicating effective management and desirable locations/amenities.
- Typical properties (Median) generate around $926 per month, representing the average market performance.
- Entry-level properties (Bottom 25%) see earnings around $384, often with potential for optimization.
Average Monthly Airbnb Earnings Trend in Salas
Salas Airbnb Occupancy Rate Trends (2025)
Maximize your bookings by understanding the Salas STR occupancy trends. Seasonal demand shifts significantly influence how often properties are booked. Typically, Augustsees the highest demand (peak season occupancy), while February experiences the lowest (low season). Effective strategies, like adjusting minimum stays or offering promotions, can boost occupancy during slower periods. Here's how different property tiers perform in Salas:
- Best-in-class properties (Top 10%) achieve 61%+ occupancy, indicating high desirability and potentially optimized availability.
- Strong performing properties (Top 25%) maintain 43% or higher occupancy, suggesting good market fit and guest satisfaction.
- Typical properties (Median) have an occupancy rate around 25%.
- Entry-level properties (Bottom 25%) average 11% occupancy, potentially facing higher vacancy.
Average Monthly Occupancy Rate Trend in Salas
Average Daily Rate (ADR) Airbnb Trends in Salas (2025)
Effective short term rental pricing strategy in Salas involves understanding monthly ADR fluctuations. The Average Daily Rate (ADR) for Airbnb in Salas typically peaks in January and dips lowest during May. Leveraging Airbnb dynamic pricing tools or strategies based on this seasonality can significantly boost revenue. Here's a look at the typical nightly rates achieved:
- Best-in-class properties (Top 10%) command rates of $212+ per night, often due to premium features or locations.
- Strong performing properties (Top 25%) achieve nightly rates of $134 or more.
- Typical properties (Median) charge around $88 per night.
- Entry-level properties (Bottom 25%) earn around $61 per night.
Average Daily Rate (ADR) Trend by Month in Salas
Get Live Salas Market Intelligence 👇

Explore Real-time Analytics
Airbnb Seasonality Analysis & Trends in Salas (2025)
Peak Season (August, July, January)
- Revenue averages $1,894 per month
- Occupancy rates average 41.8%
- Daily rates average $115
Shoulder Season
- Revenue averages $1,224 per month
- Occupancy maintains around 29.0%
- Daily rates hold near $107
Low Season (February, March, October)
- Revenue drops to average $560 per month
- Occupancy decreases to average 18.7%
- Daily rates adjust to average $124
Seasonality Insights for Salas
- The Airbnb seasonality in Salas shows highly seasonal trends requiring careful strategy. While the sections above show seasonal averages, it's also insightful to look at the extremes:
- During the high season, the absolute peak month showcases Salas's highest earning potential, with monthly revenues capable of climbing to $2,363, occupancy reaching a high of 51.2%, and ADRs peaking at $140.
- Conversely, the slowest single month of the year, typically falling within the low season, marks the market's lowest point. In this month, revenue might dip to $444, occupancy could drop to 15.6%, and ADRs may adjust down to $98.
- Understanding both the seasonal averages and these monthly peaks and troughs in revenue, occupancy, and ADR is crucial for maximizing your Airbnb profit potential in Salas.
Seasonal Strategies for Maximizing Profit
- Peak Season: Maximize revenue through premium pricing and potentially longer minimum stays. Ensure high availability.
- Low Season: Offer competitive pricing, special promotions (e.g., extended stay discounts), and flexible cancellation policies. Target off-season travelers like remote workers or budget-conscious guests.
- Shoulder Seasons: Implement dynamic pricing that balances peak and low rates. Target weekend travelers or specific events. Offer slightly more flexible terms than peak season.
- Regularly analyze your own performance against these Salas seasonality benchmarks and adjust your pricing and availability strategy accordingly.
Best Areas for Airbnb Investment in Salas (2025)
Exploring the top neighborhoods for short-term rentals in Salas? This section highlights key areas, outlining why they are attractive for hosts and guests, along with notable local attractions. Consider these locations based on your target guest profile and investment strategy.
| Neighborhood / Area | Why Host Here? (Target Guests & Appeal) | Key Attractions & Landmarks |
|---|---|---|
| Salas Historic Center | The charming historic center of Salas features gorgeous architecture, narrow streets, and a rich history, attracting tourists interested in cultural experiences and local traditions. | Palace of the Marquis of Salas, Church of Santa María, Museo de la Historia de Salas, Casa de la Cultura, Parque del Doctor Alvargonzalez |
| Parque de la Gándara | A beautiful natural park ideal for outdoor activities and relaxation. A great spot for families and nature lovers, enhancing the appeal of Airbnb rentals in the area. | Nature trails, Picnic areas, Scenic viewpoints, Wildlife watching |
| Salas Market Area | The bustling market area is vibrant and lively, ideal for guests wanting to experience local food and produce. A key area for shorter stays and those looking for local flavor. | Local food markets, Traditional food stalls, Cafes, Artisan shops |
| Calle del Camino | A picturesque street known for its quaint shops and local eateries, ideal for visitors wanting to enjoy the local environment and culture of Salas. | Local boutiques, Restaurants, Historic buildings |
| Estate of Salas | Surrounding rural areas rich in natural beauty and agricultural landscapes. Great for guests looking for tranquility and simplicity away from the town center. | Countryside views, Hiking trails, Traditional farms, Local festivals |
| Salas River Walk | A scenic area along the river offering beautiful walking paths, ideal for tourists who enjoy leisurely strolls and nature. | Walking/biking trails, Natural scenery, Fishing spots, Picnic areas |
| Salas Cultural Centre | An important venue for cultural events, music, and theatre, attracting visitors interested in arts and performances. | Theater performances, Art exhibitions, Cultural events |
| Mirador de Salas | A viewpoint that offers panoramic views of Salas and its surroundings, a perfect spot for nature lovers and photographers. | Scenic vistas, Photography opportunities, Nature observation |
Understanding Airbnb License Requirements & STR Laws in Salas (2025)
With 22% of listings showing registration in 2025, understanding potential Airbnb license requirements is crucial in Salas. Always verify the latest short term rental regulations and Airbnb license requirements directly with local government authorities for Salas to ensure full compliance before hosting.
(Source: AirROI data, 2025, based on 22% licensed listings)
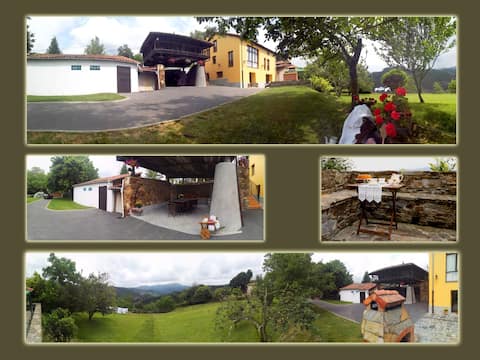
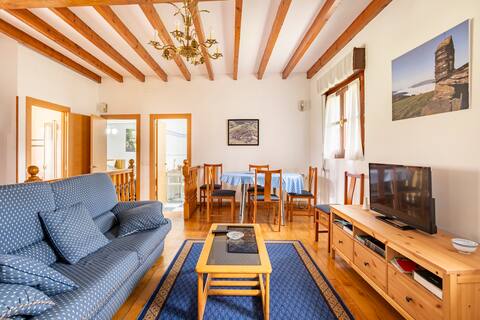
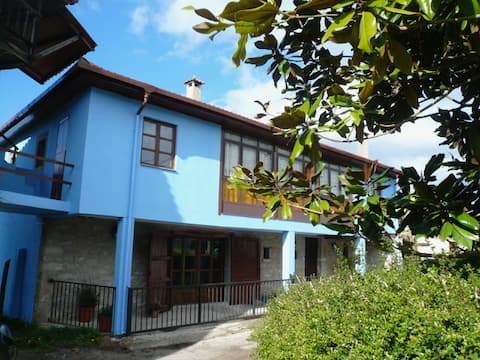
Top Performing Airbnb Properties in Salas (2025)
Benchmark your potential! Explore examples of top-performing Airbnb properties in Salasbased on Trailing Twelve Month (TTM) revenue. Analyze their characteristics, revenue, occupancy rate, and ADR to understand what drives success in this market.
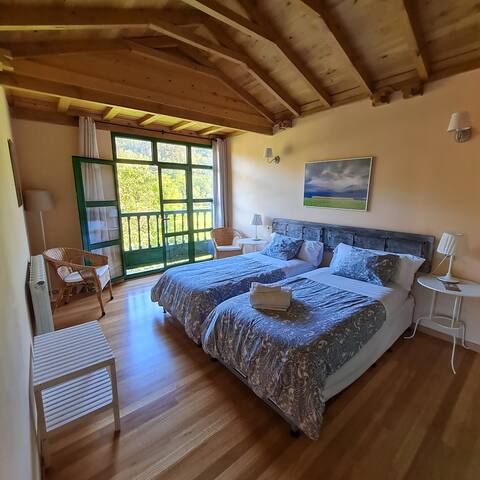
Casa Hortensia, Paradise in Asturias
Entire Place • 6 bedrooms
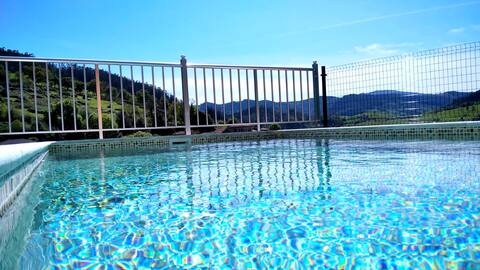
house with swimming pool and jacuzzi
Entire Place • 3 bedrooms

Las Vistas Holiday Housing
Entire Place • 3 bedrooms
La Casita del Campillo
Entire Place • 3 bedrooms
Charming house for 6-9 people, prado+panera
Entire Place • 5 bedrooms
Room for two with balcony
Private Room • 1 bedroom
Note: Performance varies based on location, size, amenities, seasonality, and management quality. Data reflects the past 12 months.
Top Performing Airbnb Hosts in Salas (2025)
Learn from the best! This table showcases top-performing Airbnb hosts in Salas based on the number of properties managed and estimated total revenue over the past year. Analyze their scale and performance metrics.
| Host Name | Properties | Grossing Revenue | Stay Reviews | Avg Rating |
|---|---|---|---|---|
| Maria Luisa | 5 | $40,851 | 80 | 4.93/5.0 |
| Maria Elena | 1 | $38,812 | 18 | 4.89/5.0 |
| Faustino | 1 | $30,912 | 87 | 4.95/5.0 |
| Mónica | 1 | $18,933 | 28 | 4.96/5.0 |
| Rafael | 1 | $17,709 | 41 | 4.95/5.0 |
| Inverdoriga | 7 | $16,829 | 45 | 4.47/5.0 |
| María | 1 | $14,689 | 3 | 5.00/5.0 |
| Luisa | 1 | $12,643 | 28 | 4.89/5.0 |
| Host #45226001 | 3 | $11,467 | 0 | 0.00/5.0 |
| Ana Olga | 1 | $10,711 | 63 | 4.65/5.0 |
Analyzing the strategies of top hosts, such as their property selection, pricing, and guest communication, can offer valuable lessons for optimizing your own Airbnb operations in Salas.
Dive Deeper: Advanced Salas STR Market Data (2025)
Ready to unlock more insights? AirROI provides access to advanced metrics and comprehensive Airbnb data for Salas. Explore detailed analytics beyond this report to refine your investment strategy, optimize pricing, and maximize your vacation rental profits.
Explore Advanced MetricsSalas Short-Term Rental Market Composition (2025): Property & Room Types
Room Type Distribution
Property Type Distribution
Market Composition Insights for Salas
- The Salas Airbnb market composition is heavily skewed towards Entire Home/Apt listings, which make up 77.8% of the 27 active rentals. This indicates strong guest preference for privacy and space.
- Looking at the property type distribution in Salas, House properties are the most common (66.7%), reflecting the local real estate landscape.
- Houses represent a significant 66.7% portion, catering likely to families or larger groups.
Salas Airbnb Room Capacity Analysis (2025): Bedroom Distribution
Distribution of Listings by Number of Bedrooms
Room Capacity Insights for Salas
- The dominant room capacity in Salas is 1 bedroom listings, making up 33.3% of the market. This suggests a strong demand for properties suitable for couples or solo travelers.
- Together, 1 bedroom and 3 bedrooms properties represent 55.5% of the active Airbnb listings in Salas, indicating a high concentration in these sizes.
- A significant 40.7% of listings offer 3+ bedrooms, catering to larger groups and families seeking more space in Salas.
Salas Vacation Rental Guest Capacity Trends (2025)
Distribution of Listings by Guest Capacity
Guest Capacity Insights for Salas
- The most common guest capacity trend in Salas vacation rentals is listings accommodating 3 guests (22.2%). This suggests the primary traveler segment is likely small families or groups.
- Properties designed for 3 guests and 6 guests dominate the Salas STR market, accounting for 40.7% of listings.
- 37.0% of properties accommodate 6+ guests, serving the market segment for larger families or group travel in Salas.
- On average, properties in Salas are equipped to host 4.1 guests.
Salas Airbnb Booking Patterns (2025): Available vs. Booked Days
Available Days Distribution
Booked Days Distribution
Booking Pattern Insights for Salas
- The most common availability pattern in Salas falls within the 271-366 days range, representing 77.8% of listings. This suggests many properties have significant open periods on their calendars.
- Approximately 100.0% of listings show high availability (181+ days open annually), indicating potential for increased bookings or specific owner usage patterns.
- For booked days, the 31-90 days range is most frequent in Salas (40.7%), reflecting common guest stay durations or potential owner blocking patterns.
Salas Airbnb Minimum Stay Requirements Analysis
Distribution of Listings by Minimum Night Requirement
1 Night
5 listings
20% of total
2 Nights
9 listings
36% of total
3 Nights
4 listings
16% of total
4-6 Nights
2 listings
8% of total
30+ Nights
5 listings
20% of total
Key Insights
- The most prevalent minimum stay requirement in Salas is 2 Nights, adopted by 36% of listings. This highlights the market's preference for shorter, flexible bookings.
- A significant segment (20%) caters to monthly stays (30+ nights) in Salas, pointing to opportunities in the extended-stay market.
Recommendations
- Align with the market by considering a 2 Nights minimum stay, as 36% of Salas hosts use this setting.
- If feasible, allowing 1-night stays, especially midweek or during low season, could capture last-minute bookings, as only 20% currently do.
- Explore offering discounts for stays of 30+ nights to attract the 20% of the market seeking extended stays.
- Adjust minimum nights based on seasonality – potentially shorter during low season and longer during peak demand periods in Salas.
Salas Airbnb Cancellation Policy Trends Analysis (2025)
Flexible
2 listings
9.1% of total
Moderate
11 listings
50% of total
Firm
7 listings
31.8% of total
Strict
2 listings
9.1% of total
Cancellation Policy Insights for Salas
- The prevailing Airbnb cancellation policy trend in Salas is Moderate, used by 50% of listings.
- There's a relatively balanced mix between guest-friendly (59.1%) and stricter (40.9%) policies, offering choices for different guest needs.
- Strict cancellation policies are quite rare (9.1%), potentially making listings with this policy less competitive unless justified by high demand or property type.
Recommendations for Hosts
- Consider adopting a Moderate policy to align with the 50% market standard in Salas.
- Using a Strict policy might deter some guests, as only 9.1% of listings use it. Evaluate if potential revenue protection outweighs possible lower booking rates.
- Regularly review your cancellation policy against competitors and market demand shifts in Salas.
Salas STR Booking Lead Time Analysis (2025)
Average Booking Lead Time by Month
Booking Lead Time Insights for Salas
- The overall average booking lead time for vacation rentals in Salas is 45 days.
- Guests book furthest in advance for stays during August (average 70 days), likely coinciding with peak travel demand or local events.
- The shortest booking windows occur for stays in January (average 19 days), indicating more last-minute travel plans during this time.
- Seasonally, Summer (64 days avg.) sees the longest lead times, while Winter (33 days avg.) has the shortest, reflecting typical travel planning cycles.
Recommendations for Hosts
- Use the overall average lead time (45 days) as a baseline for your pricing and availability strategy in Salas.
- For August stays, consider implementing length-of-stay discounts or slightly higher rates for bookings made less than 70 days out to capitalize on advance planning.
- Target marketing efforts for the Summer season well in advance (at least 64 days) to capture early planners.
- Monitor your own booking lead times against these Salas averages to identify opportunities for dynamic pricing adjustments.
Popular & Essential Airbnb Amenities in Salas (2025)
Amenity Prevalence
Amenity Insights for Salas
- Essential amenities in Salas that guests expect include: Washer, Essentials. Lacking these (any) could significantly impact bookings.
- Popular amenities like Hot water, Wifi, Hangers are common but not universal. Offering these can provide a competitive edge.
- Warning: Wifi is not universally provided but is considered essential globally. Ensure reliable Wifi is offered.
Recommendations for Hosts
- Ensure your listing includes all essential amenities for Salas: Washer, Essentials.
- Prioritize adding missing essentials: Washer, Essentials.
- Consider adding popular differentiators like Hot water or Wifi to increase appeal.
- Highlight unique or less common amenities you offer (e.g., hot tub, dedicated workspace, EV charger) in your listing description and photos.
- Regularly check competitor amenities in Salas to stay competitive.
Salas Airbnb Guest Demographics & Profile Analysis (2025)
Guest Profile Summary for Salas
- The typical guest profile for Airbnb in Salas consists of a mix of domestic (56%) and international guests, often arriving from nearby Madrid, typically belonging to the Post-2000s (Gen Z/Alpha) group (50%), primarily speaking English or Spanish.
- Domestic travelers account for 56.1% of guests.
- Key international markets include Spain (56.1%) and France (9.1%).
- Top languages spoken are English (33.3%) followed by Spanish (27.2%).
- A significant demographic segment is the Post-2000s (Gen Z/Alpha) group, representing 50% of guests.
Recommendations for Hosts
- Balance marketing efforts between domestic and international channels based on the guest mix.
- Tailor amenities and listing descriptions to appeal to the dominant Post-2000s (Gen Z/Alpha) demographic (e.g., highlight fast WiFi, smart home features, local guides).
- Highlight unique local experiences or amenities relevant to the primary guest profile.
- Consider seasonal promotions aligned with peak travel times for key origin markets.
Nearby Short-Term Rental Market Comparison
How does the Salas Airbnb market stack up against its neighbors? Compare key performance metrics like average monthly revenue, ADR, and occupancy rates in surrounding areas to understand the broader regional STR landscape.
| Market | Active Properties | Monthly Revenue | Daily Rate | Avg. Occupancy |
|---|---|---|---|---|
| A Fonsagrada | 16 | $1,737 | $154.77 | 41% |
| Villaviciosa | 238 | $1,478 | $199.32 | 39% |
| Portomarín | 13 | $1,477 | $152.10 | 49% |
| Llanera | 13 | $1,369 | $198.00 | 39% |
| Caravia | 25 | $1,304 | $162.64 | 41% |
| O Saviñao | 18 | $1,289 | $144.03 | 36% |
| Piloña | 113 | $1,287 | $154.28 | 37% |
| Ribeseya | 243 | $1,259 | $180.23 | 39% |
| Gijón | 1,271 | $1,229 | $130.17 | 43% |
| Pravia | 38 | $1,209 | $149.95 | 42% |